
Bitcoin (BTC) continues to move along the trend line; what will the price do next? — October 17 Chart Analysis
Bitcoin (BTC), which formed a large bullish candlestick on October 15 and surged significantly, has shown a temporary pullback after the rise, and continues to move with the price action using the downward trend line as resistance. On today, October 17, Bitcoin continues to move along the trend line; what kind of price action will we see in the future? We will check the chart.
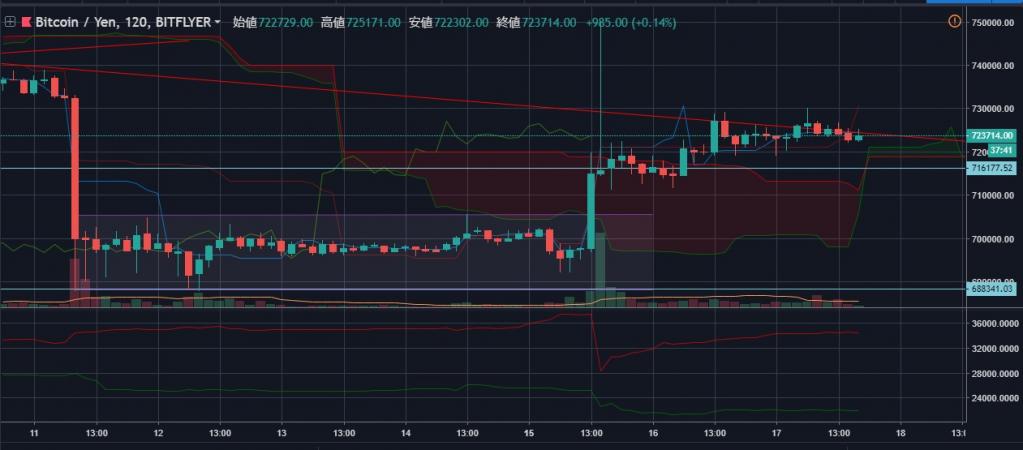
After forming a large bullish candlestick, Bitcoin (BTC) is rising gradually but its price action is being constrained by the trend line