Learn about lines: What is a "trend line"?
The “Trendline” is also
one of the most effective technical tools derived from the Dow Theory,
and is as well known as “Support” and “Resistance,”
with many traders around the world paying close attention to it.
Upward Trendlineis drawn by connecting the lows of two points that rise from the first and third pointsto form a right-shoulder-upward “line”
There,the third point (5) encountering resistance completes the “Trendline.”

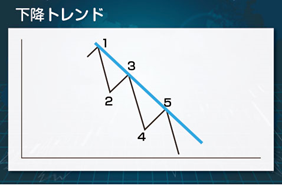
Downward Trendlineis drawn by connecting the highs of two points that fall from the first and third points to form a right-shoulder-downward “line.”
There,the third point (5) encountering resistance completes the “Trendline.”
As a concept of trends,
once a trend starts, it tends to continue for a while,
and a trend determined by the Trendline (three-point rule) tends to maintain a certain velocity and slope,
indicating entry points for “pullback buying” or “rebound selling,”
and signaling timing for trend reversals caused by breaking the Trendline.
When actually drawing the lines,in an uptrend, start from the lowest price of the trend,
and draw lines branching toward the current price up to the highest price of the trend,
touching the lows at two points2points apart, forming angles for the “lines.”


Trading targets are shown below5→6 and 7→8 (pullback buying).

Trading targets are shown below5→6 and 7→8 (rebound selling).

At point 9, the line is broken,
but that simply means the current angle of the trend has ended, so
you should not enter thinking the trend has reversed simply because of a break.
However, it depends on the situation.
If at 6 or 8, after encountering strong resistance, point 9 occurs,
that can be an appropriate entry timing,
and if the angle of the trend in the above figure is so close to horizontal that it can be called a trendless state,
the momentum after a line break may be strong, so there are cases where you should consider entering.
(Please refer to the “Principle ②”)