

Bitcoin (BTC) shows price movement along a downward trend line. What will the price do next? — October 16 Chart Analysis
Bitcoin (BTC), which surged from the 690,000 yen level to as high as around 750,000 yen on October 15, later retraced about half of that gain on a strong rebound. Since then, BTC has shown price action along a downward trend line. We will examine BTC's chart.
After the pullback, Bitcoin (BTC) is restrained from rising by the downward trend line
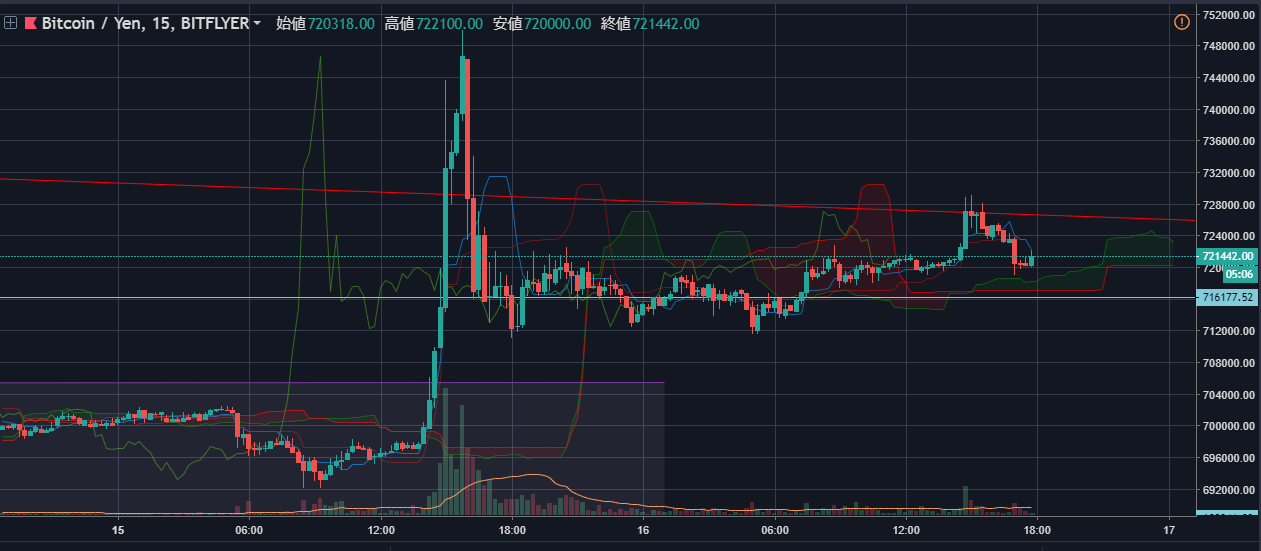
After the pullback, BTC, with a support around 710,000 yen, continued to rebound around the 710,000 yen level as of October 16. After the pullback, BTC touched the low three times and showed upward movement, but its rise was capped by the downward trend line established since September 5.
Since the sharp rise on October 15, BTC has continued trading in a new price range. Moving forward, the price action is expected to maintain the support around the 710,000 yen level and resistance along the trend line since September 5.
× ![]()