

Using the bankruptcy probability of Valsara as a reference, unravel the EA's performance from backtesting④
Unraveling the Bankruptcy Probability of a Gold EA That Delivers 300%+ in 13 Years
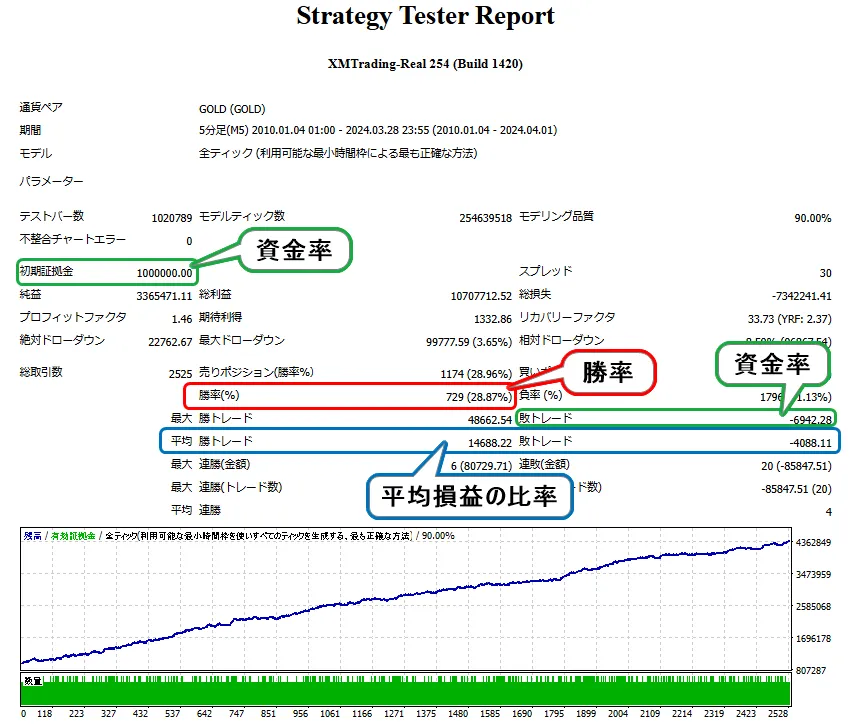
The second EA prepared is a Gold 5-minute chart specialist EA.
It shows 13-year returns of 330%, a maximum drawdown of 9.9% against initial capital, an annual recovery factor of 2.37 on average, and about 188 trades per year on average, which also looks numerically like a high-performing EA.
Now, let's calculate each of these numbers.
Win rate is"28.87%."Compared to the previous EA, this has dropped significantly.
Average profit-to-loss ratio is"14688.22 ÷ 4088.11 = 3.59," approximately 3.6
Capital adequacy ratio is"6942.28 ÷ 1000000.00 = 0.0069," less than 1%
Thus we use the 1% of the Balsa-ras bankruptcy probability table.
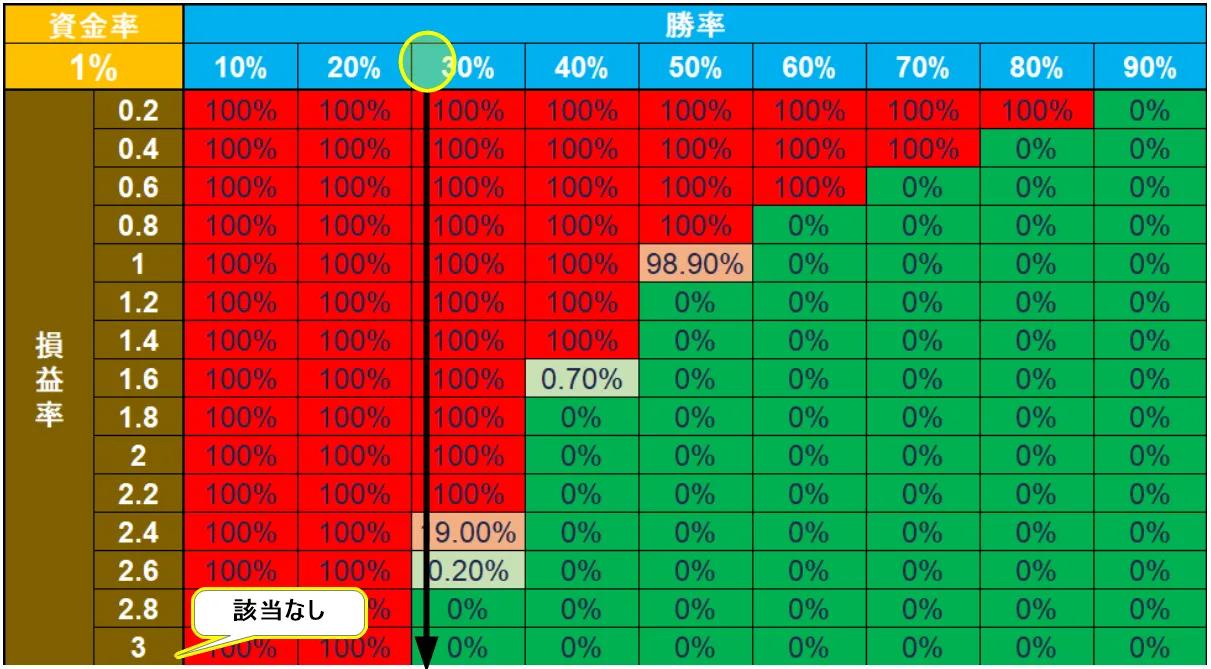
Considering that the win rate is close to 30%, the profit-to-loss ratio is so favorable that it exceeds the losses listed in the Bankruptcy Probability Table from Balasara (likely a misspelling of BALSARA/Balsera),
and if we assume 4 items or fewer, looking at the trend up to item 3, even with a win rate of 20%, the probability of "0% bankruptcy" is high, and since the capital adequacy ratio is well below 1%, the 0% case is almost certain.
In other words, if you run this EA with a capital of 1,000,000 yen and 0.1 lots,"Even repeating trades at maximum loss will not lead to bankruptcy."That is the conclusion.
There is no absolute in the market, so this is based on the premise of "as far as backtests show," but it can be considered a relatively reliable EA to operate.
In this way, not only from backtest reports but also by analyzing as a discretionary trading method, you can analyze EA from various angles as part of your portfolio.
For long-term operation, it is important to not view this as a hassle and to conduct such analyses as part of your portfolio.
× ![]()