
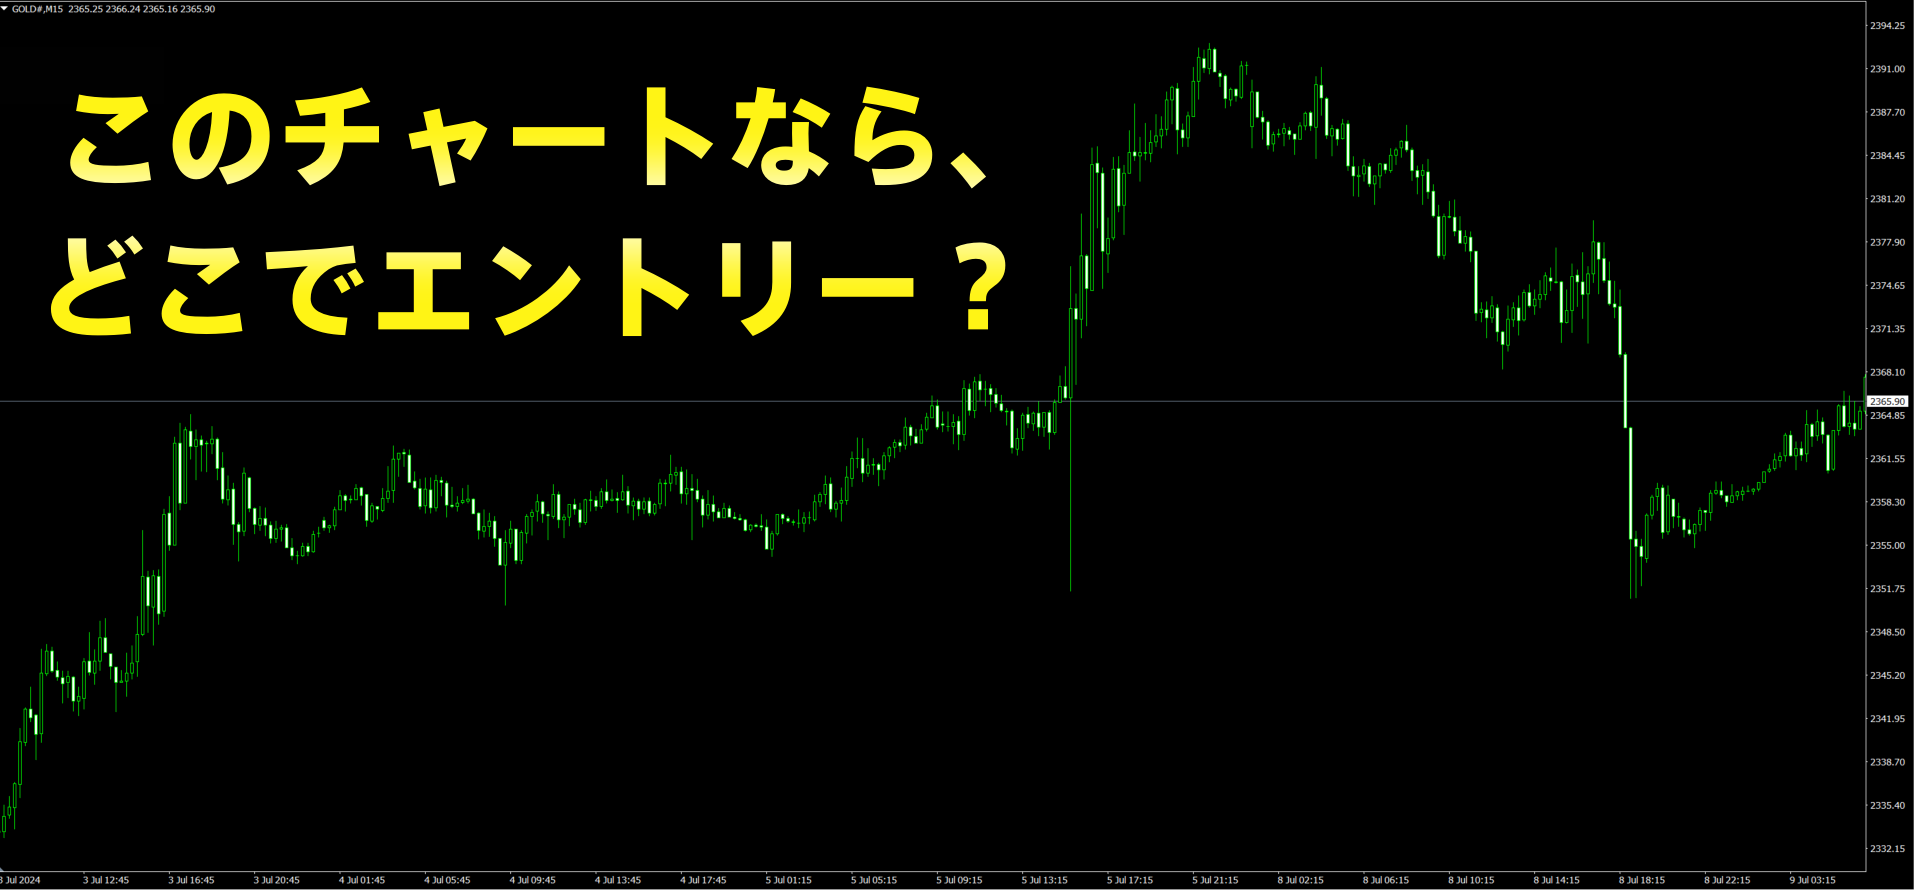
If you read the crowd psychology from the chart, an 80% win rate is easy.
If you read the crowd psychology from the chart, FX becomes able to win.
I will explain it using the GOLD chart, which has been traded frequently lately.
This is the 15-minute GOLD chart as of July 10, 2024.
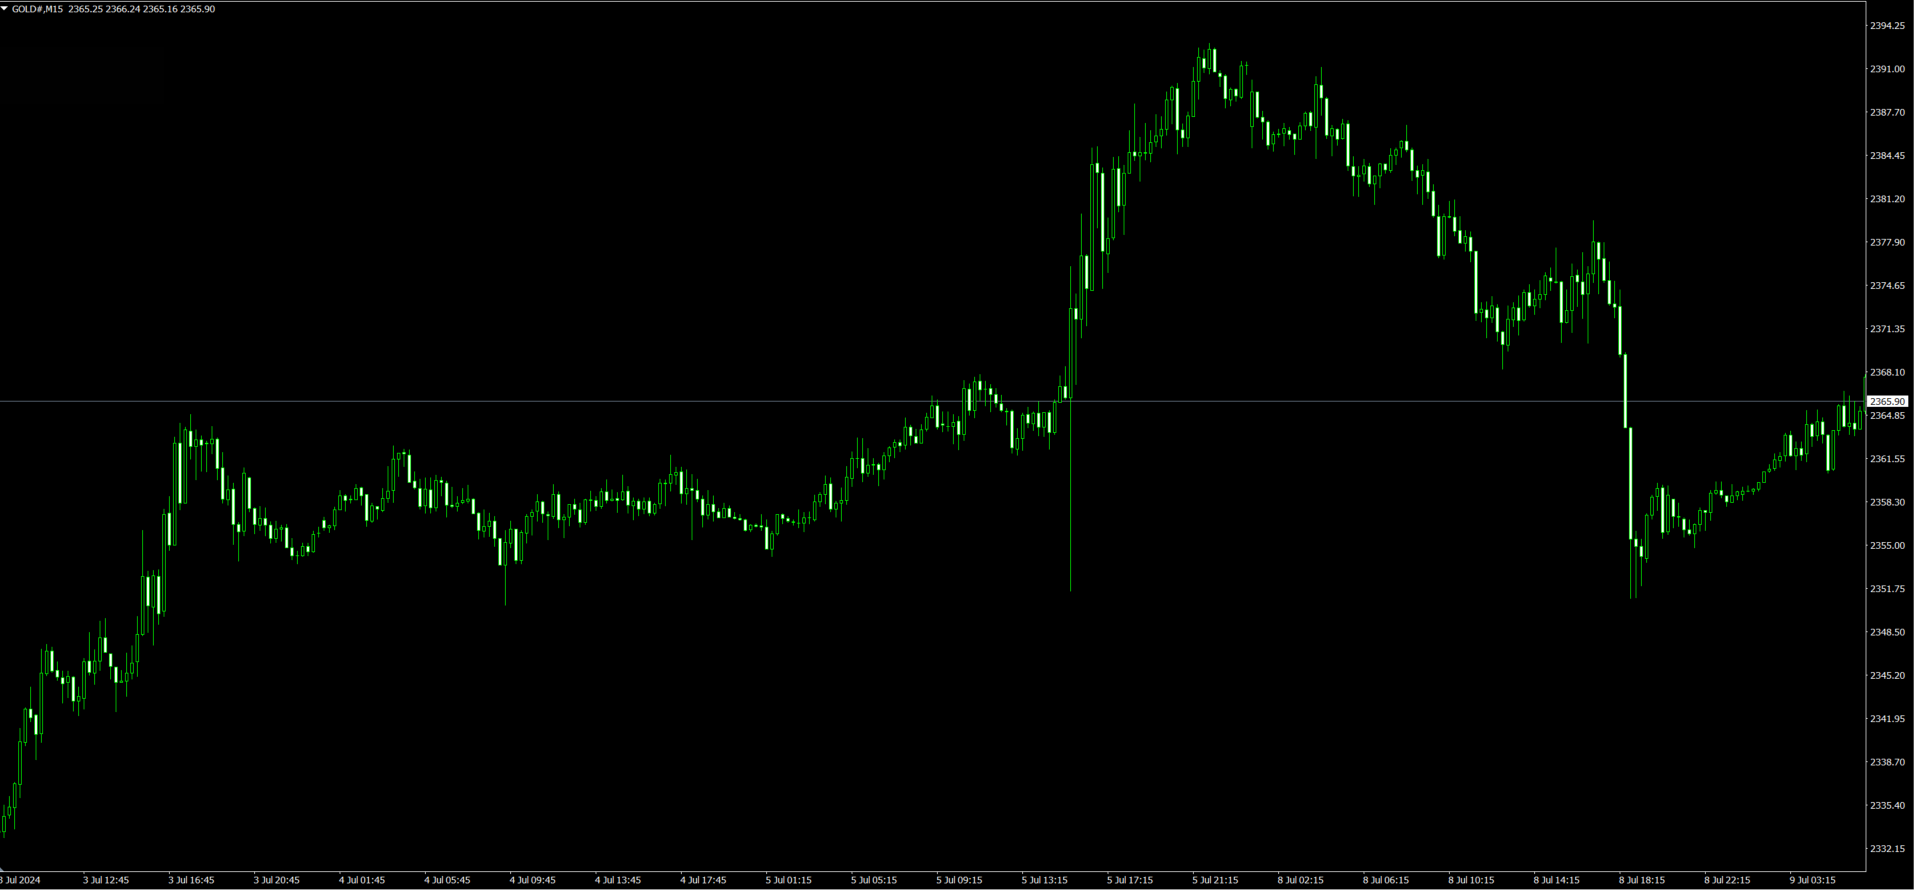
Where would you enter on this chart?
I can tell at a glance.
If I add one note, after the chart is completed, anyone can come up with explanations about what happened later.
I understand that.
However, this is the point where I entered on July 8 and quickly made about 80 pips, so I will delve a little deeper and explain it based on that.
If you read this explanation, I think you may somewhat understand what “crowd psychology” means.
『Crowd Psychology Trading』is related to the method explained in it, but for those who have not purchased, please consider it a service.
I started MT4 and looked at the chart in the afternoon of July 8.
On this chart, it is around the top area.
First, when I looked at the chart at a glance, I organize it in my head as follows.
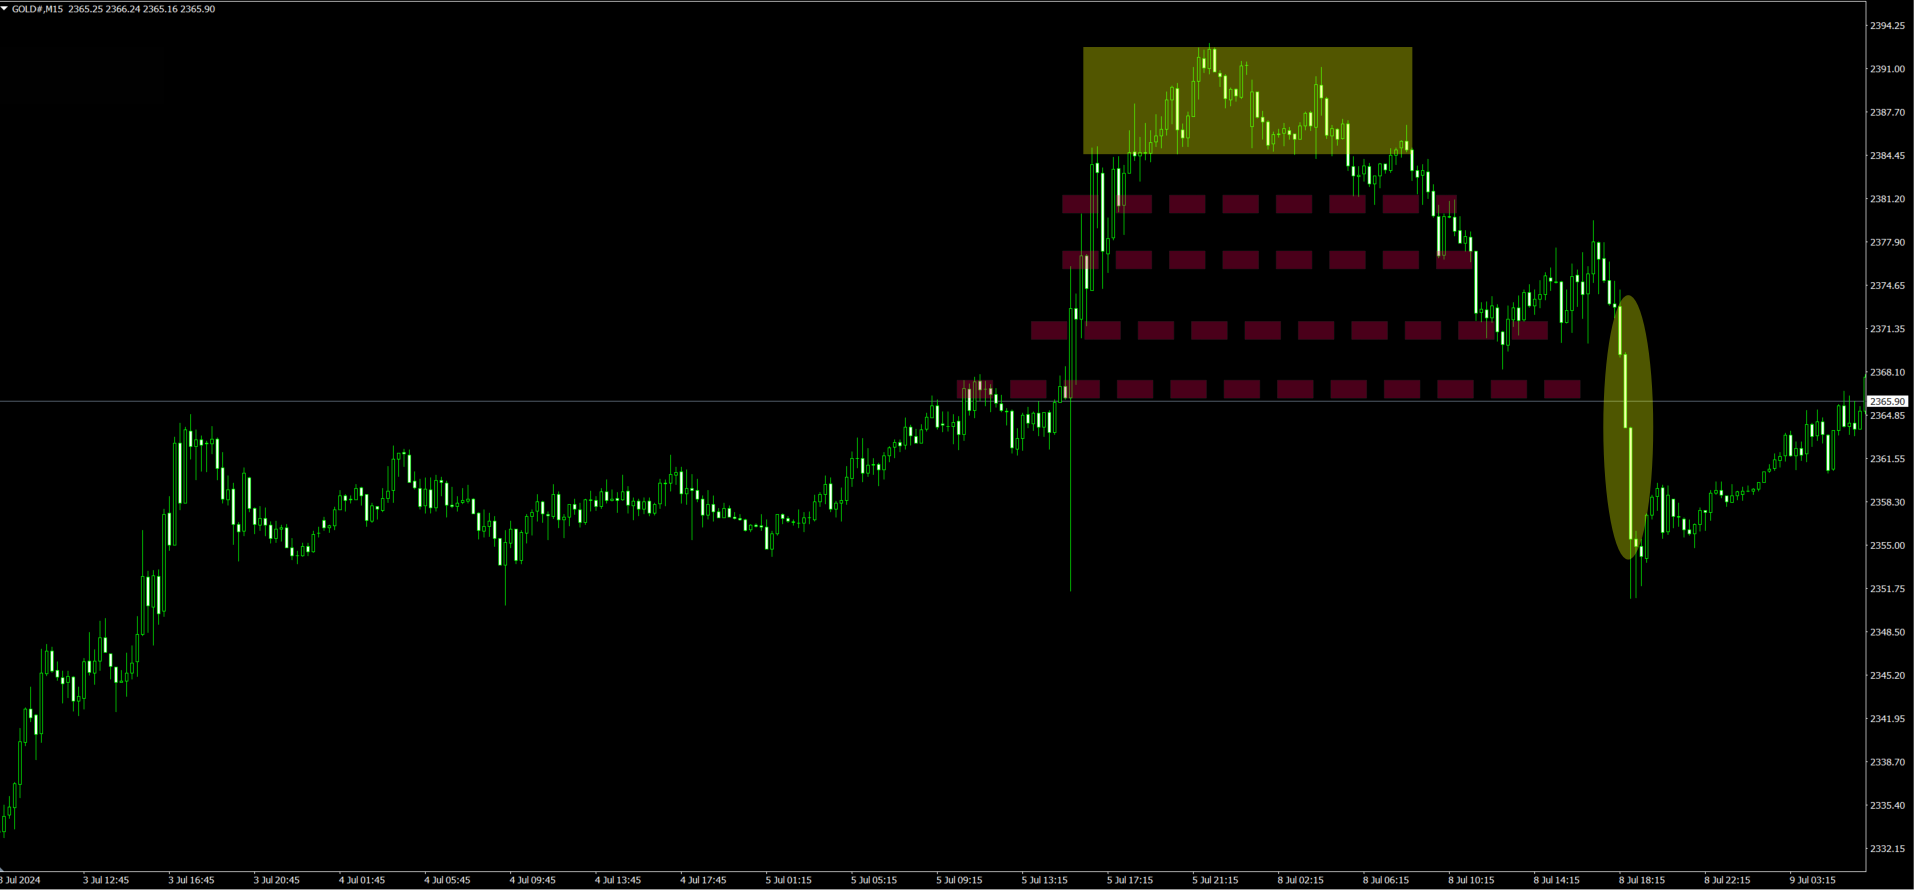
There is a range forming in the top area (yellow rectangle)
The lines being watched are around here, touched and broken about four times (below the yellow rectangle)
The left side of the chart is somewhat stair-stepped (pink dashed line on the left)
This is around where there are many buy positions on the left, so it is being watched (pink dashed line)
The long wick on the left was probably stretched by some indicator or something
If so, the candles that extended by this indicator probably involved stop hunts along the way
Next, (not displayed, but) I also look at moving averages and their slopes.
And I target points where “this range will be solid here” and “this will surely go down here.”
You do not need to take hundreds of pips.
That is what small-lot traders and demo traders do.
Common trait among traders who earn tens of millions per year or more is“to take small price moves with large lots”.
“I took several hundred pips from here to here”
That is something a naive indicator seller would push, so do not take it as reference.
This trade, because the currency pair was GOLD and it looked solid, I entered with a few positions and ended up with 80 pips, but that is too good to be true.
It is fine to take 15 pips or 20 pips per trade.
If you repeat that calmly every day, your funds will steadily grow.
By the way, on the far-right of this chart, in the yellow circled area, the chart is dropping with great momentum, isn’t it?
From the chart, I will read this crowd psychology within the visible range.
(I wasn’t watching in real time, so sorry if it was different due to indicators)
Looking at the left side of the chart, the chart surged due to indicators, and many stops were involved.
There should be a considerable amount of buy positions piled up.
So, to break through here on the right side, momentum was necessary.
Thus, the yellow circled area is where momentum was built to push through.
If you were watching this in real time and managed to take it, you were lucky, right?
In this way, by focusing on what can be read from the chart rather than relying on signal tools or indicators, your win rate will naturally rise.