

Use of the "Visualization Indicator" (Part 154)
Utilization of the "Visualization Indicators" (part)154)
1. Further evolve the "28 Currency Pairs List Indicator" into an indicator
"8CPVisualization Indicator"to drawNZDUSD.
The "8CPVisualization Indicator" includesOceaniaLondon版,NewYork版,AnyCP版. This time, theOceania版 was used.
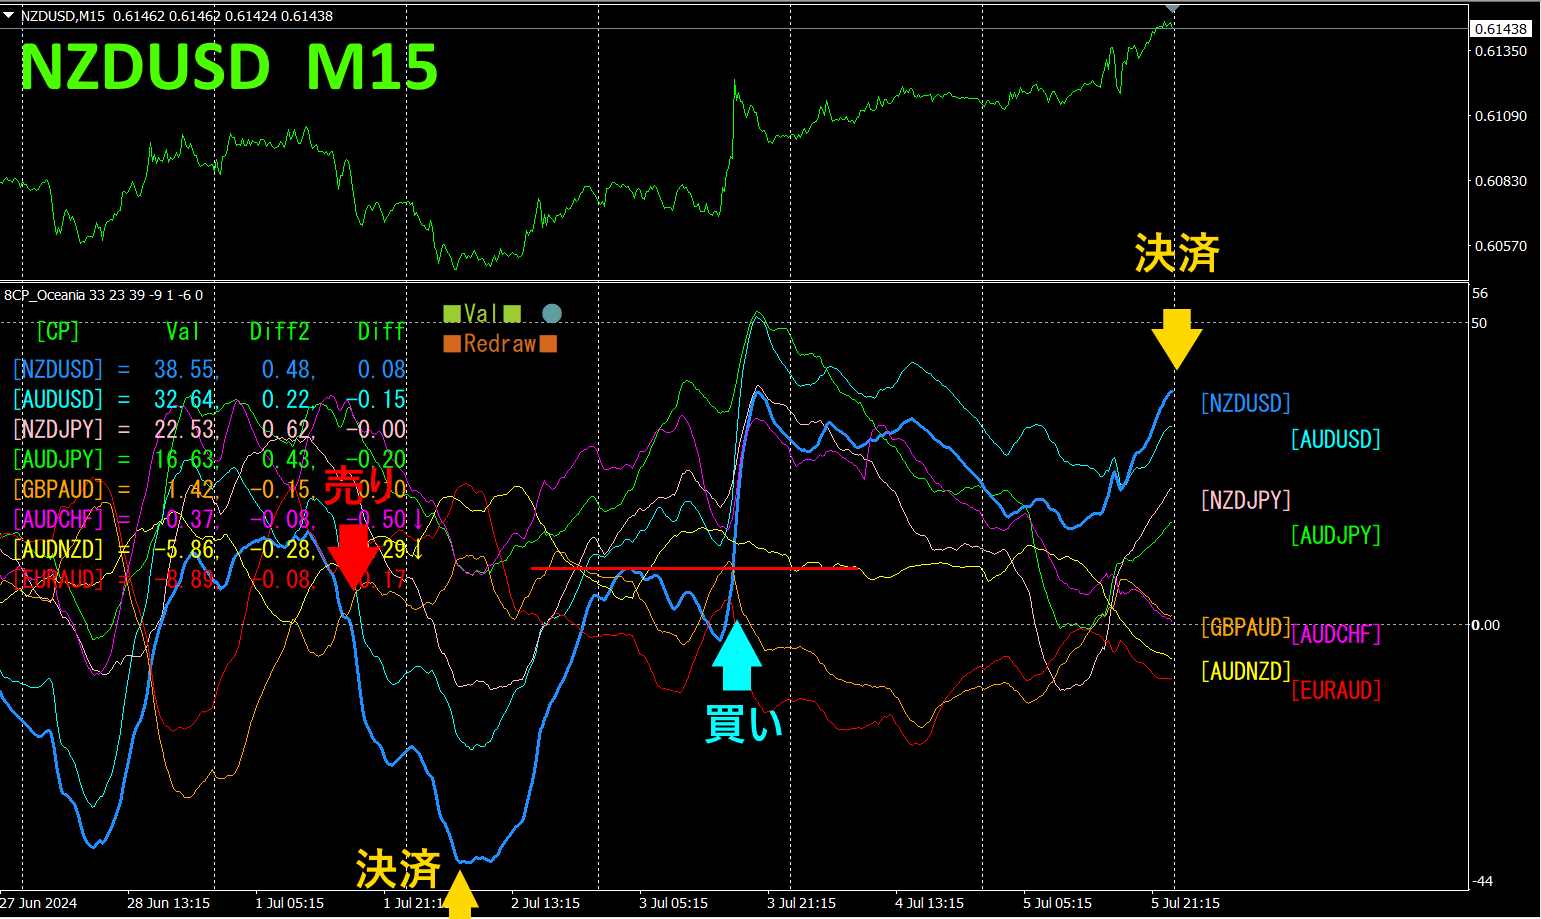
The top half is a 15-minute chart ofNZDUSD. The bottom half is from the "8CPVisualization Indicator"; the blue thick line graph corresponds toNZDUSD.
NZDUSD graph has fallen below other graphs, indicating a selling point. Next, on Wednesday, theNZDUSD chart broke above its recent high, which is a buying point. For selling and buying, approximately40pips and approximately60pips, totaling about100pips profit were obtained.
If you use the "TrendLine-EX", entry and exit can be automated by a diagonal trendline breakout. You can leave it as is for easy trading. "TrendLine-EX" is a semi-automatic EA that can auto-sell on a trendline breakout and auto-close on a breakout above the trendline.TrendLine-EX is a semi-automatic EA that does auto-sell on a trendline breakout and auto-close on a breakout above the trendline.
2. Best SelectIndicator trial
The figure below is a screenshot taken on2024 year7 month3 day23:11
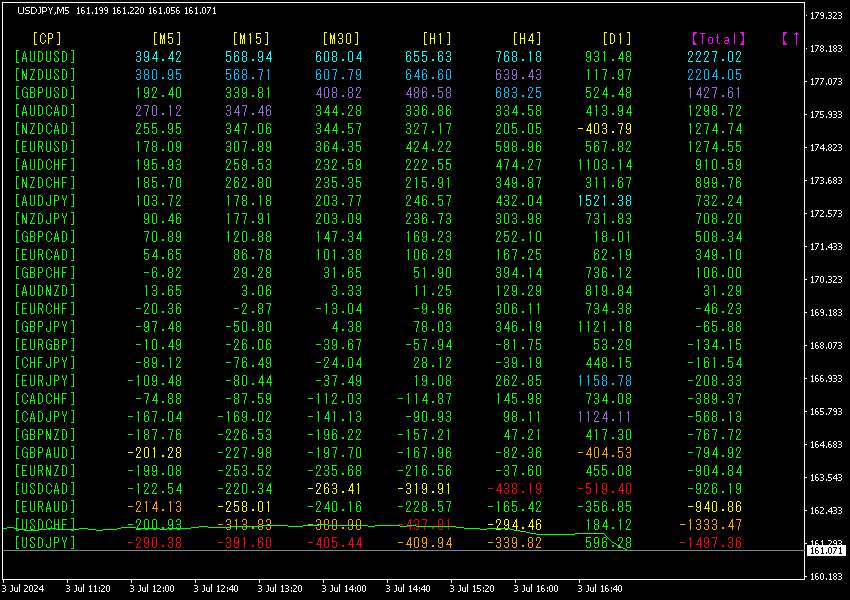
[Total]The numbers are in descending order. The top row'sAUDUSD shows blue coloring across timeframes excluding [D1]. Moreover, theTotal value is 2227.02, a positive number.AUDUSD indicates an uptrend.
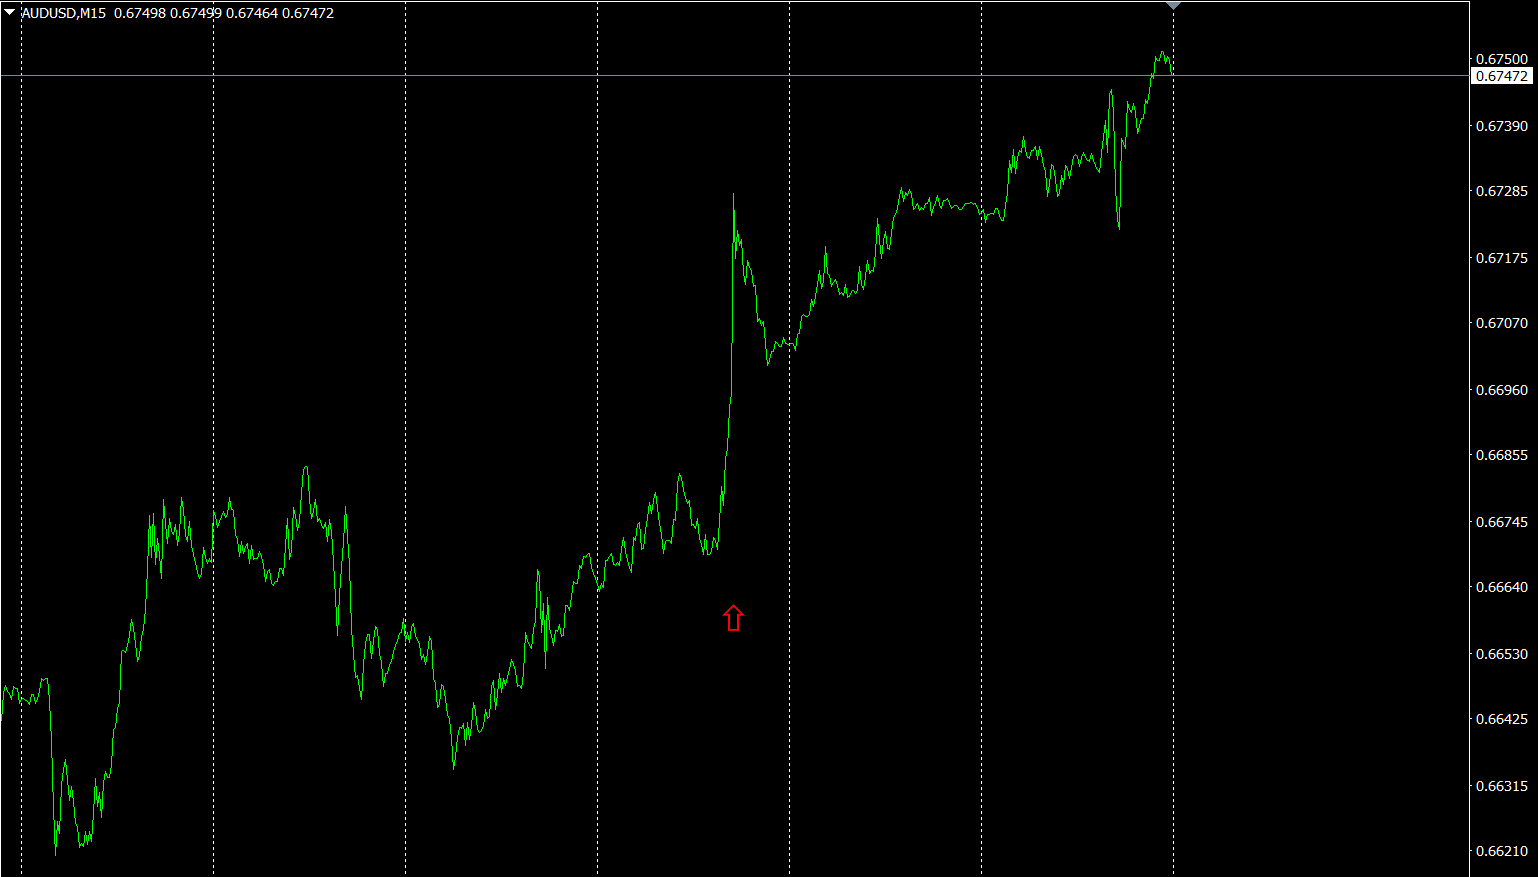
Now, let’s look at the AUDUSD chart.AUDUSD chart.
The red arrow marks the screenshot point, capturing a sharp rise.
“28 currency pairs Best Select can easily identify which currency has the strongest trend among 28 pairs. It also tells you, via numbers and colors, whether you should trade now. It provides a quick overview of all currency pairs’ movements.
“28 currency pairs Best Select indicator
https://www.gogojungle.co.jp/tools/indicators/35128

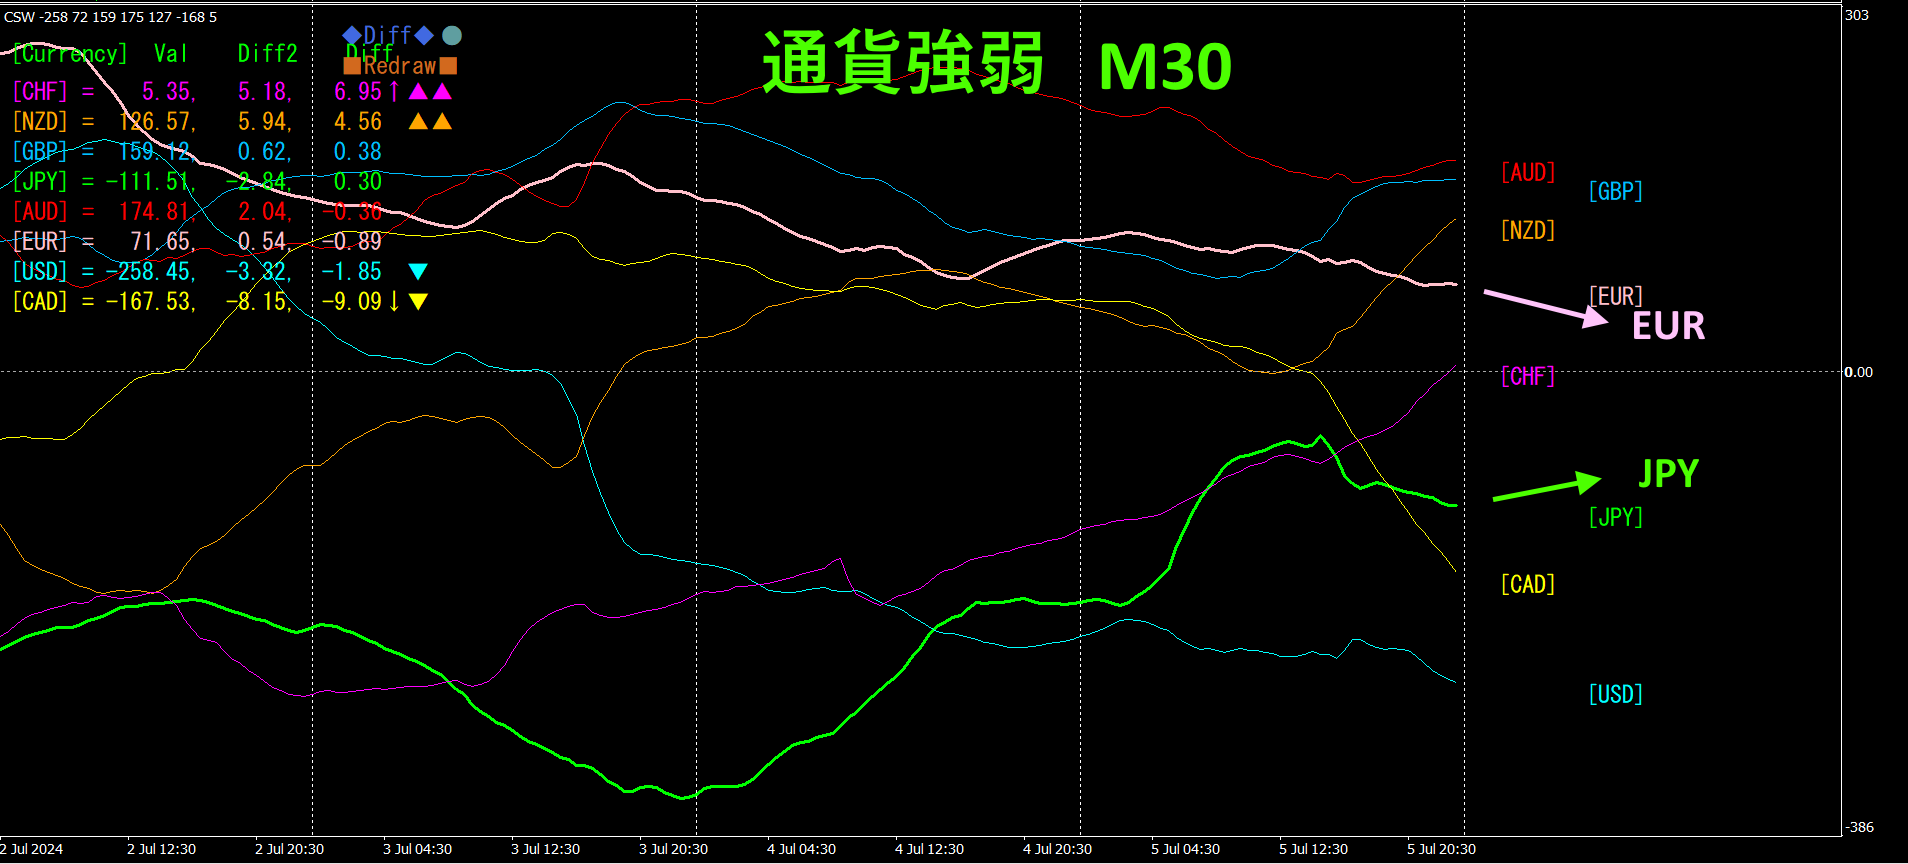
3. 2021 year5 monthto present EURJPY movement has what happened?
Since 2021 year5 monthEURJPY movement is being tracked.
To view the overall trend, a 30-minute chart of the last about3 weeks is drawn.
Last time I wrote the following.
JPY is the lowest position, and its direction is downward, whileEUR is slightly upward. Going forward, will likely continue to rise.
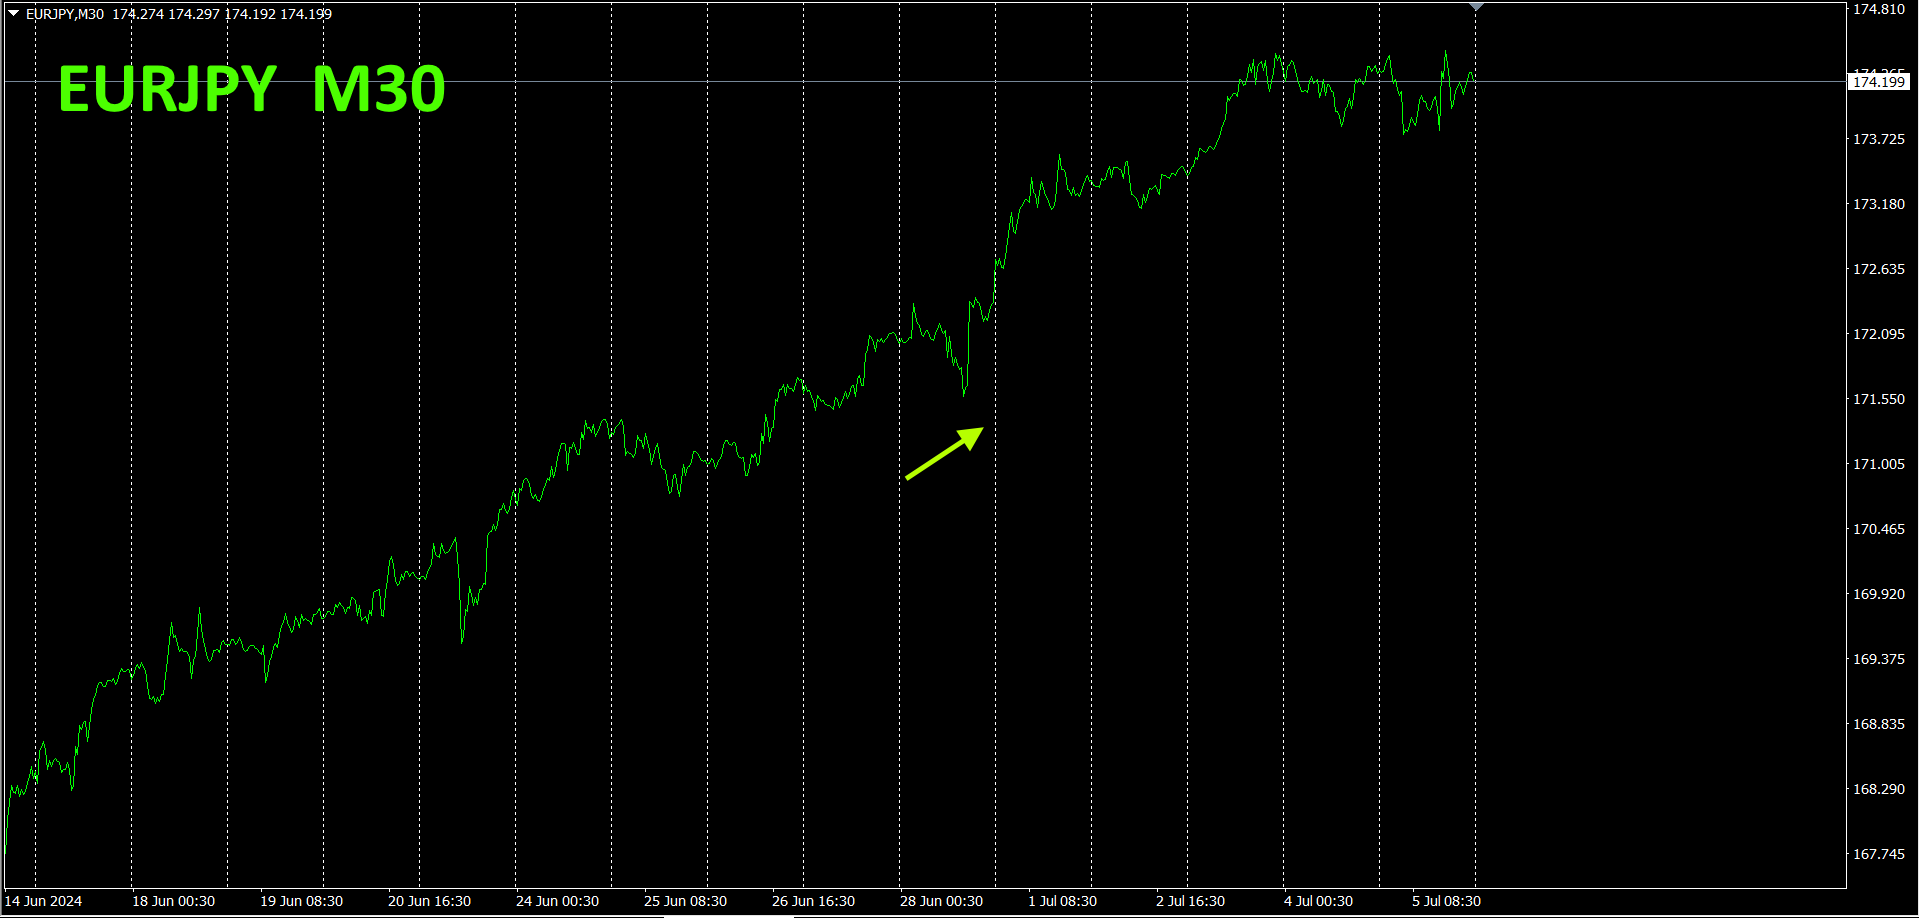
As expected, it has continued to rise.
30-minute currency strength chart.
Pink isEUR, green isJPY.JPY is slightly upward, is slightly downward. Therefore, is expected to trend slightly downward.
4. NewEA“AIOne-Spot) has started selling.
“AIOne-Spot” usesAI for market analysis, developed 90% of it into a “billion-dollar EA.” It targets only volatile times, like fishing a big catch in the vast market, without averaging down or martingale.
In the most recent forward test, the initial drawdown was high, but it has turned slightly positive again. Let’s look forward with expectations.

https://www.gogojungle.co.jp/systemtrade/fx/51292
https://www.gogojungle.co.jp/systemtrade/fx/51393

5.
Recommended indicators
“TrendLine-EX”
https://www.gogojungle.co.jp/tools/indicators/42257

“8CCurrency Strength Visualization Indicator” is described on the following pages.

MT4 version https://www.gogojungle.co.jp/tools/indicators/39150
MT5 version https://www.gogojungle.co.jp/tools/indicators/39159
【My listed products】


