

[July 2, 2024] Historical backtest using the sky-and-earth indicator (Yurooji)
This is the first post of July. I apologize for the decrease in article frequency recently. I tweeted about it on X, but I’m忙しい忙しい with tasks such as error checks for EA Pattern ⑧ (latest update of Ten to Chi EA), adding a line item to the dashboard, and layout changes for Oscillator DX, which will be released soon. I will deliver the best update, so please forgive me.
Then this time is a follow-up verification of Euro-OjiPrevious consideration article.
If you press the GOOD mark, it will be a boost for my future activities. I would appreciate your cooperation for further motivation enhancement.

・This article mainly uses“Ten to Chi Indicator” for past verifications.
・This tool is designed to be usable even without understanding classic FX theory(Elliott Wave, Dow Theory, Gann’s principle, cycle theory, price action, Fibonacci, support/resistance, channels, etc.)“15-minute chart + 4-hour chart simultaneous monitoring method”. as the premise for the configuration.
・In this tool, you can use the high-precision method known as
・In the articles linked below, we introduce precious DMs, reviews, posts from users. We have carefully selected winning reports and useful DMs, so I’m sure you’ll find them helpful.
【Updated daily】 User impressions (review version) from those who actually used Ten to Chi Indicator
【Updated daily】 User impressions (DM version) from those who actually used Ten to Chi Indicator
【Updated daily】 Search by “#Ten to Chi Indicator”

Ten to Chi Indicator is a trading method using my original indicator released in February 2022, developed by Abusan. Thanks to everyone’s support,“GogoJungle Award 2022, 2023 were won for two consecutive years.
■ Ten to Chi Indicatorhttps://www.gogojungle.co.jp/tools/indicators/35780
■ Ten to Chi Indicator【MT5 version】https://www.gogojungle.co.jp/tools/indicators/47523
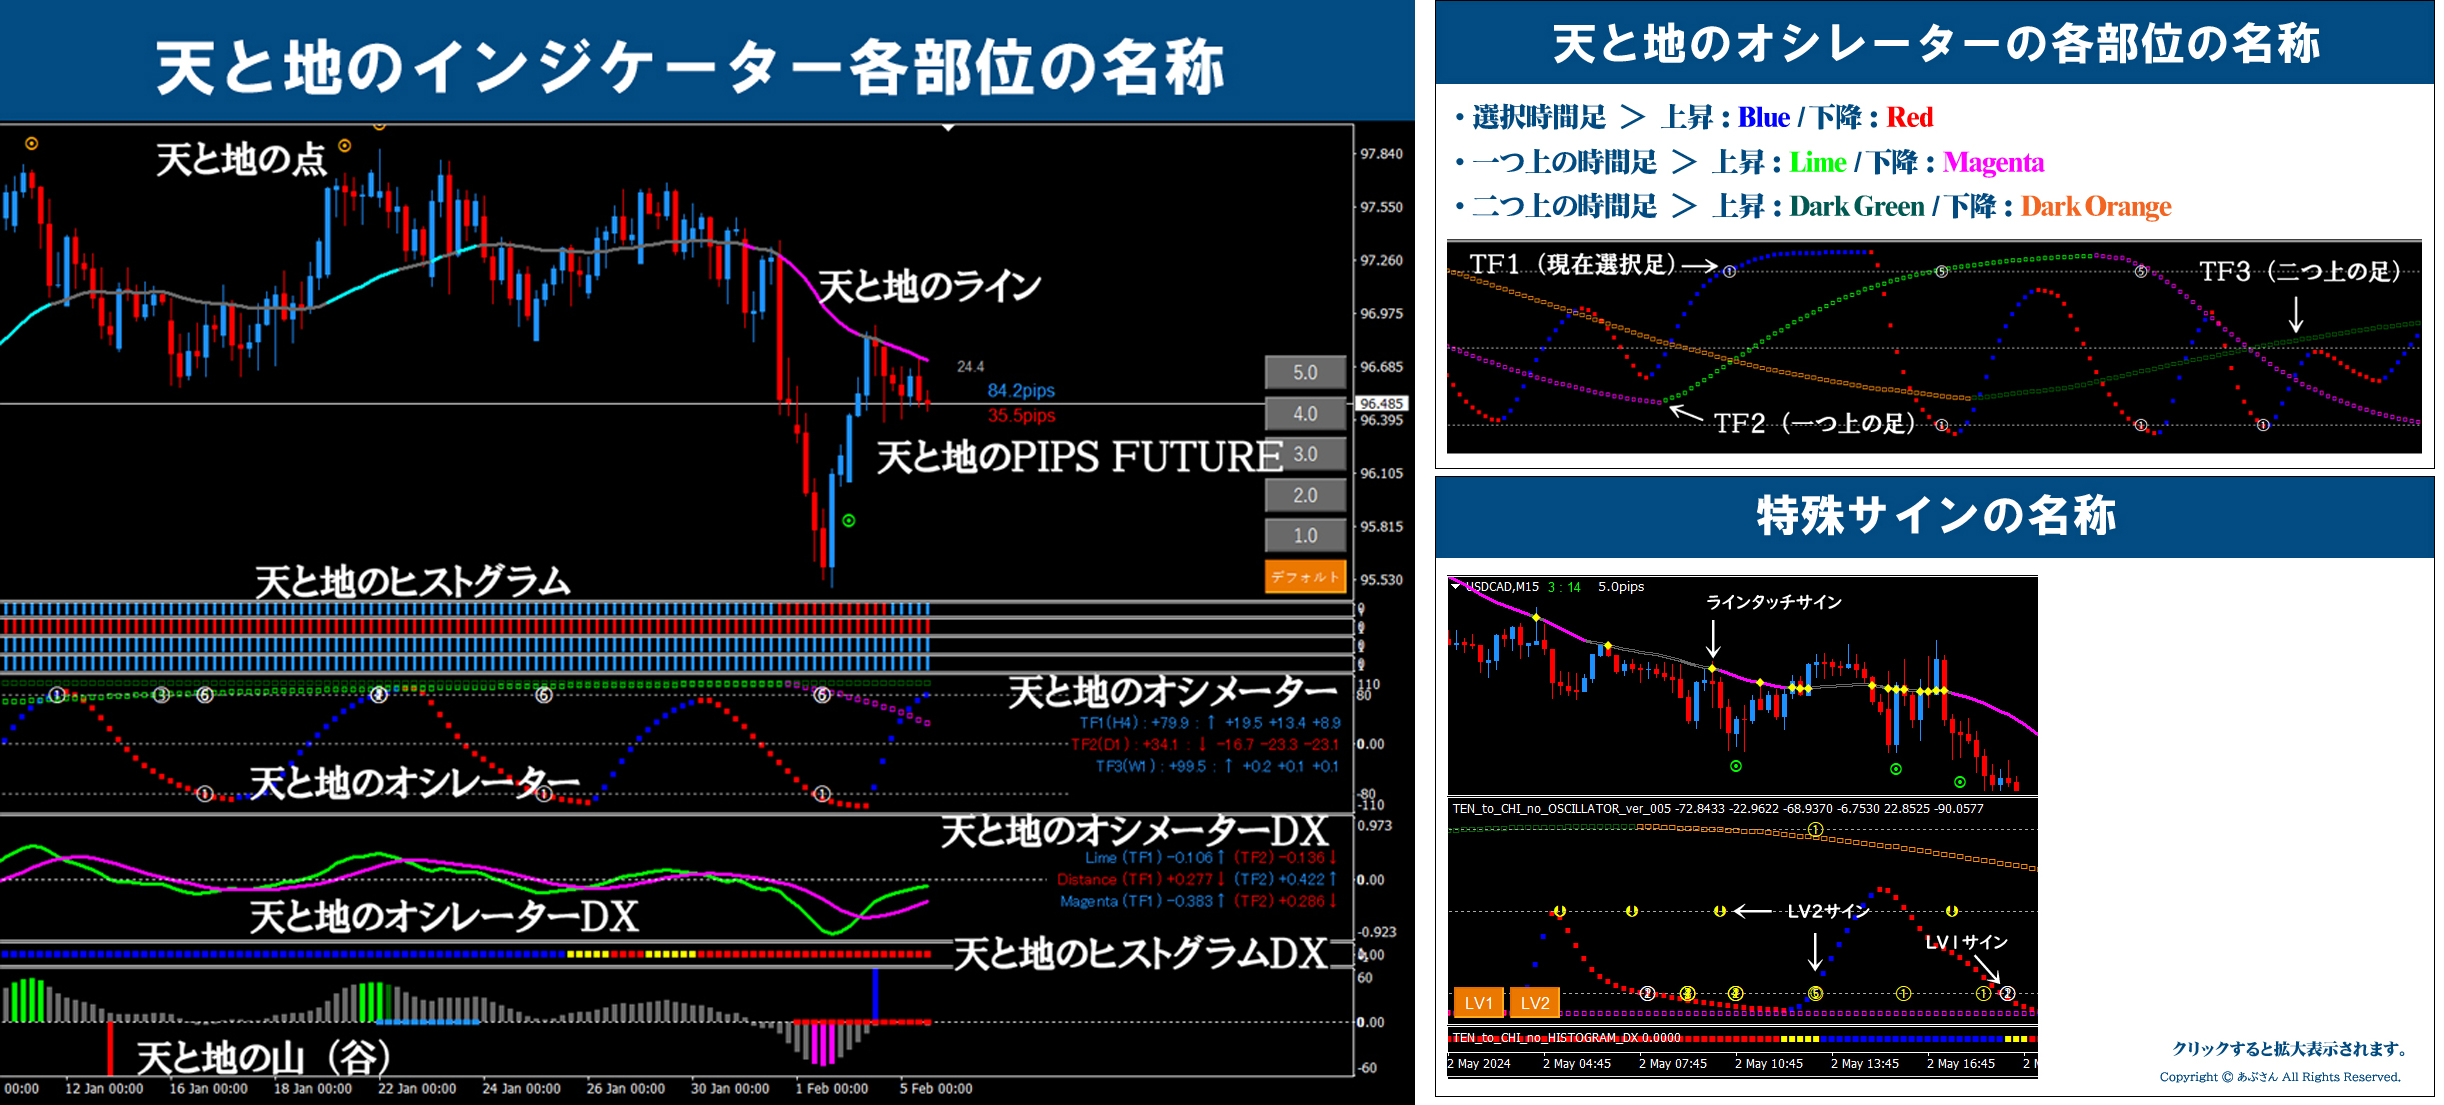
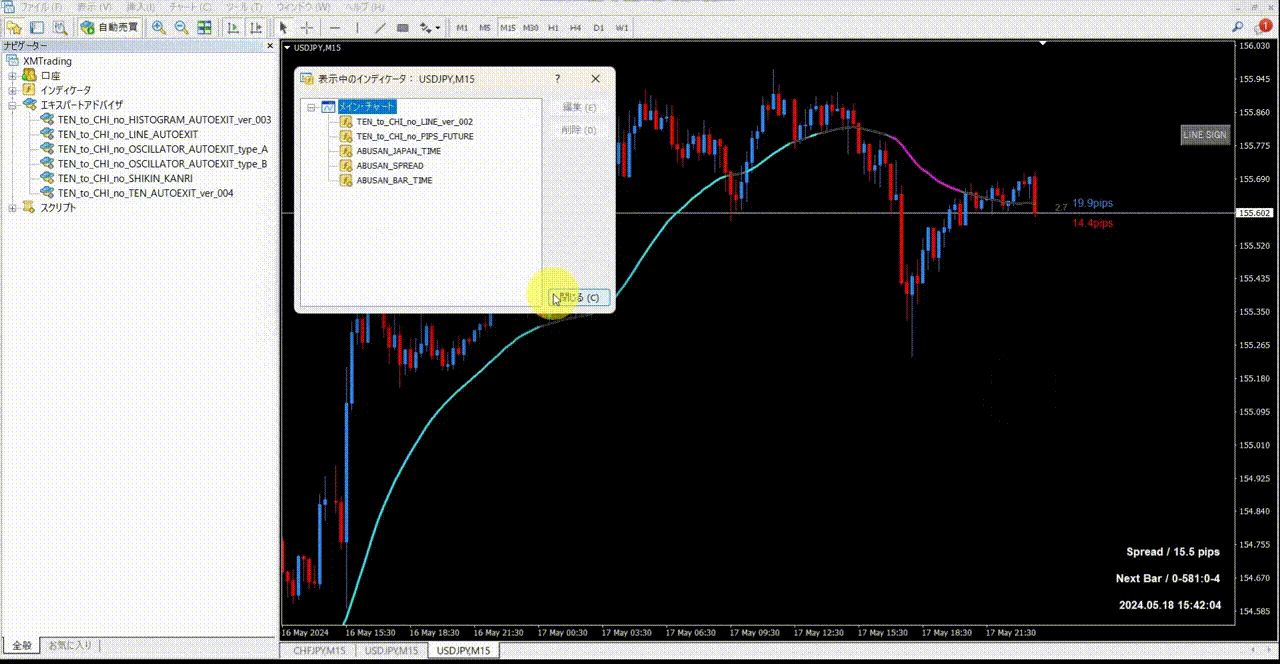
※ For terminology used in this blog, please refer to the images below.All images can be enlarged by clicking. If you have any other questions, please refer to the Ten to Chi Indicator sales page for a general understanding. Already, users can read the manual without issue, right?
Now, I would like to proceed to verification.
Thank you in advance!
※ All images can be enlarged by clicking.

Euro-Oji 15-minute + 4-hour past verification (July 2, 2024 –Present)
※ Please note the yellow vertical line. There is a yellow vertical line in the 15-minute chart at the same location. (Using the LINK LINE).
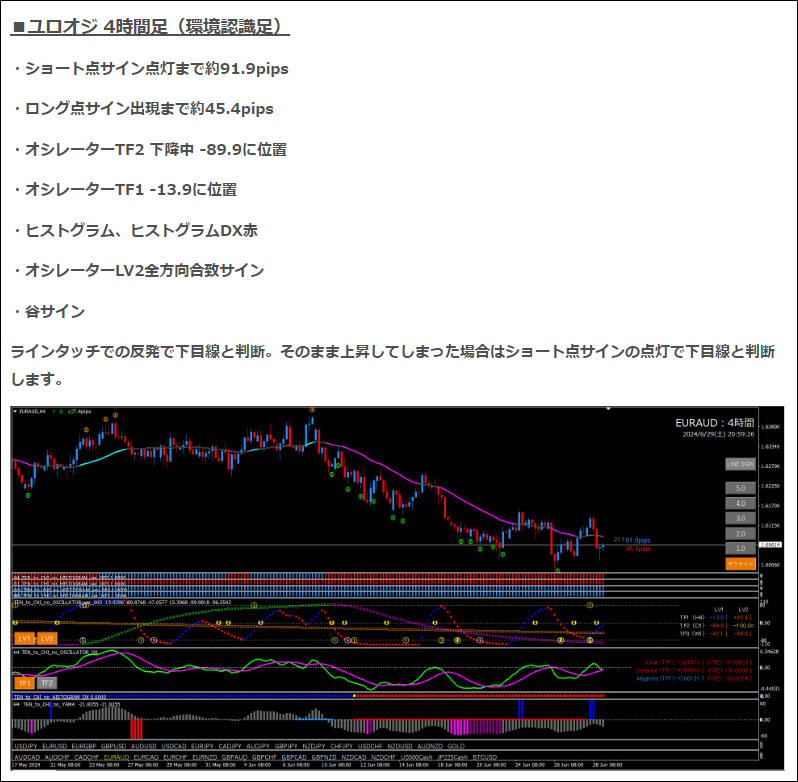
■ 4-hour chart (environment recognition)
The top of the image isthe previous article. The bottom is the current chart.
The current chart’s yellow vertical line is the location judged as lower-side in the previous article’s scenario.
As the scenario suggested, since the candlestick clearly crossed above the line, the short-entry signal is considered lower-side. The Oscillator DX is about to cross downwards, and there is a valley as well. However, the histogram DX is turning upwards, which is a concern. If Oscillator TF2 rises, promptly end the down-side view. A long-entry signal also ends the down-side view.

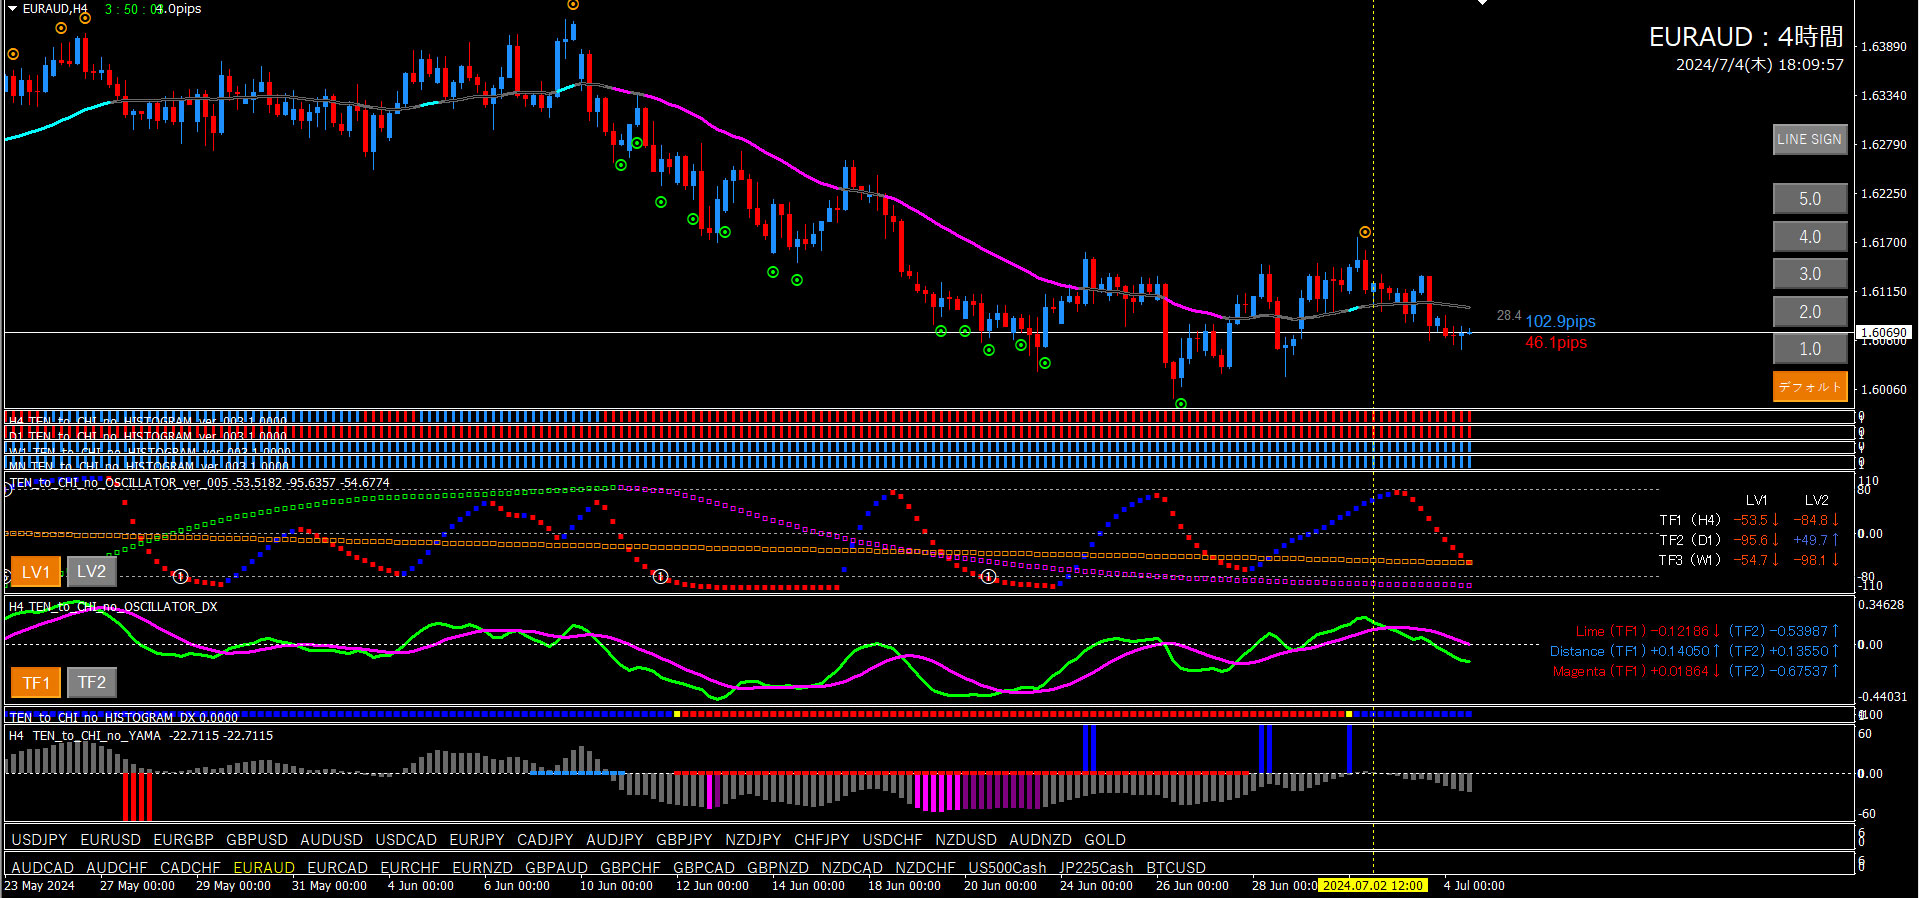
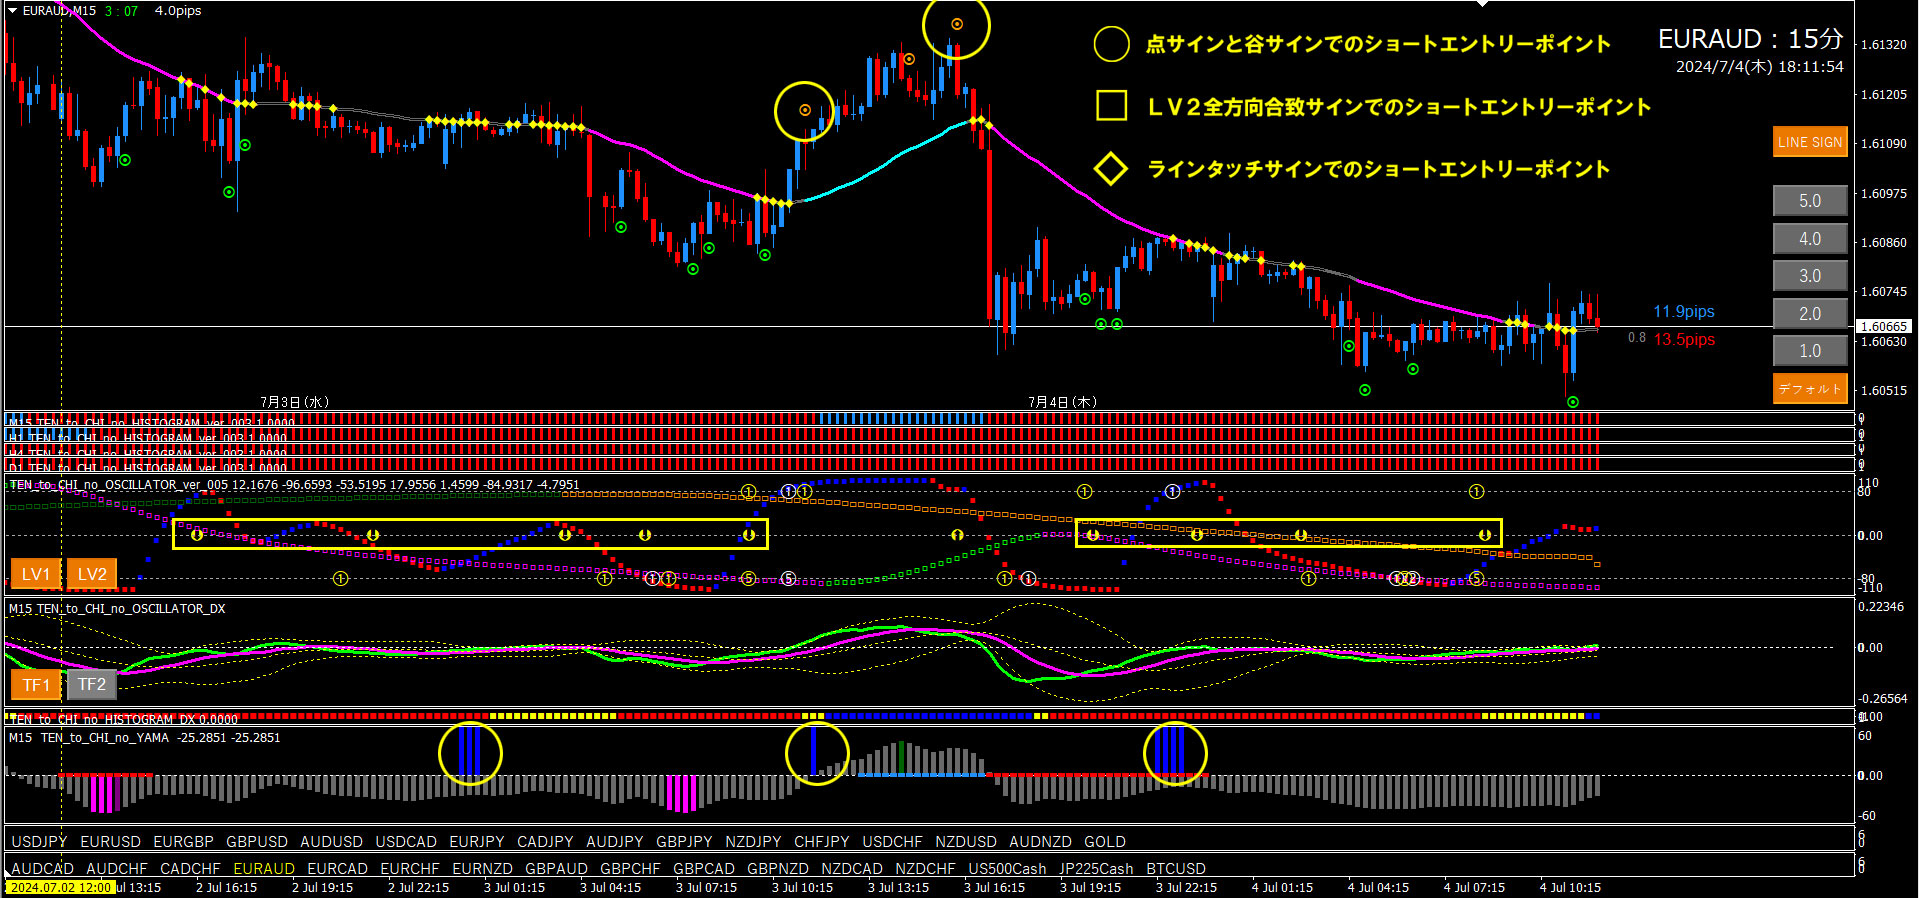
■ 15-minute chart (Entry trigger)
The yellow vertical line is the location where the 4-hour chart judged the down-side view.
Yellow circle indicates short-entry points at dot signals and valley signals.
Yellow square indicates short-entry points at Oscillator LV2 all-direction concordance signals.
Yellow diamond on the line indicates short-entry points at line-touch signals.
The second entry point around the second dot diverges from the Oscillator TF2, but since Oscillator TF2 is crossing down, it is fine. Entries from Oscillator LV2 all-direction concordance signals, but ignore those that are far from the line.
※ All-direction concordance signals and oscillator signals ⑥ depend on the higher-timeframe direction. Therefore, signals do not confirm until the higher timeframe is confirmed. (Ten to Chi signals and other signals that do not use higher-timeframe signals are not subject to this rule. They are completely no-repaint.)
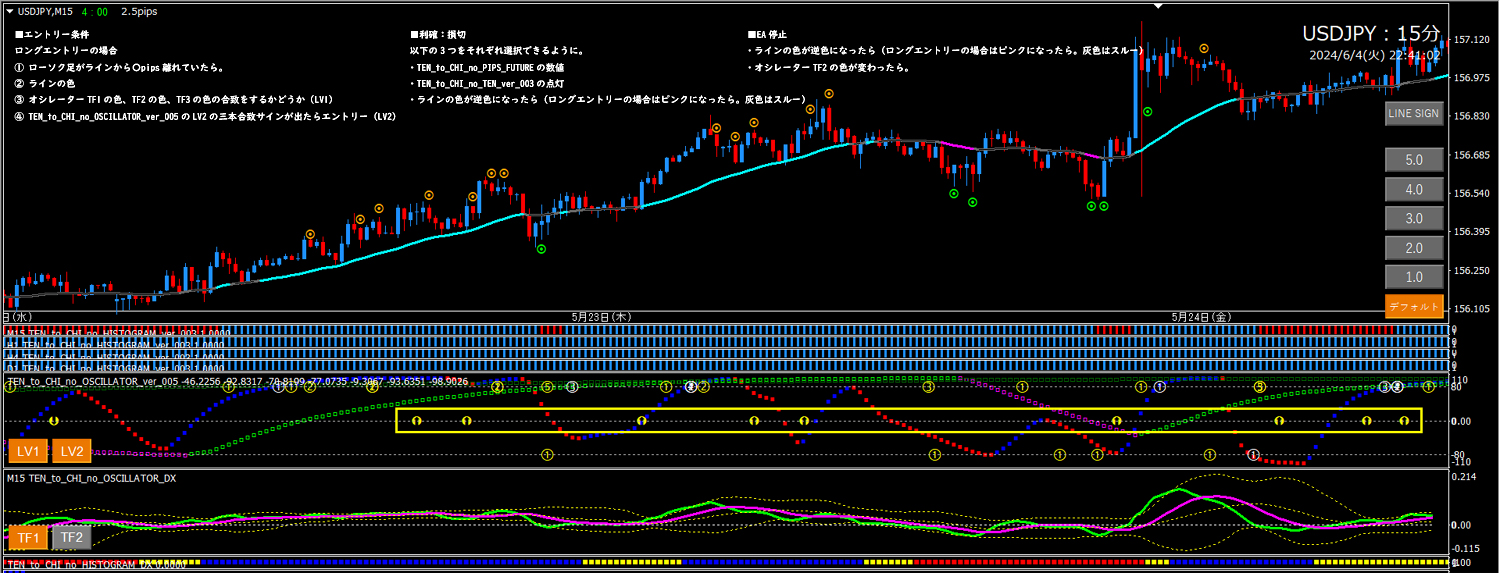
■ If you were to use Ten to Chi EA (on a 15-minute chart)
In market conditions like this, using the soon-to-be-released “Ten to Chi EA Pattern ⑧” is very effective. I will introduce the details again later, but roughly it will look like the image. It will be an incredibly powerful tool, so please look forward to it.
■Ten to Chi Capital Managementとは?

That is all.
I hope this is at least somewhat helpful to everyone.
If you press the GOOD mark, it will be a boost for my future activities. I would appreciate your cooperation for further motivation enhancement.
