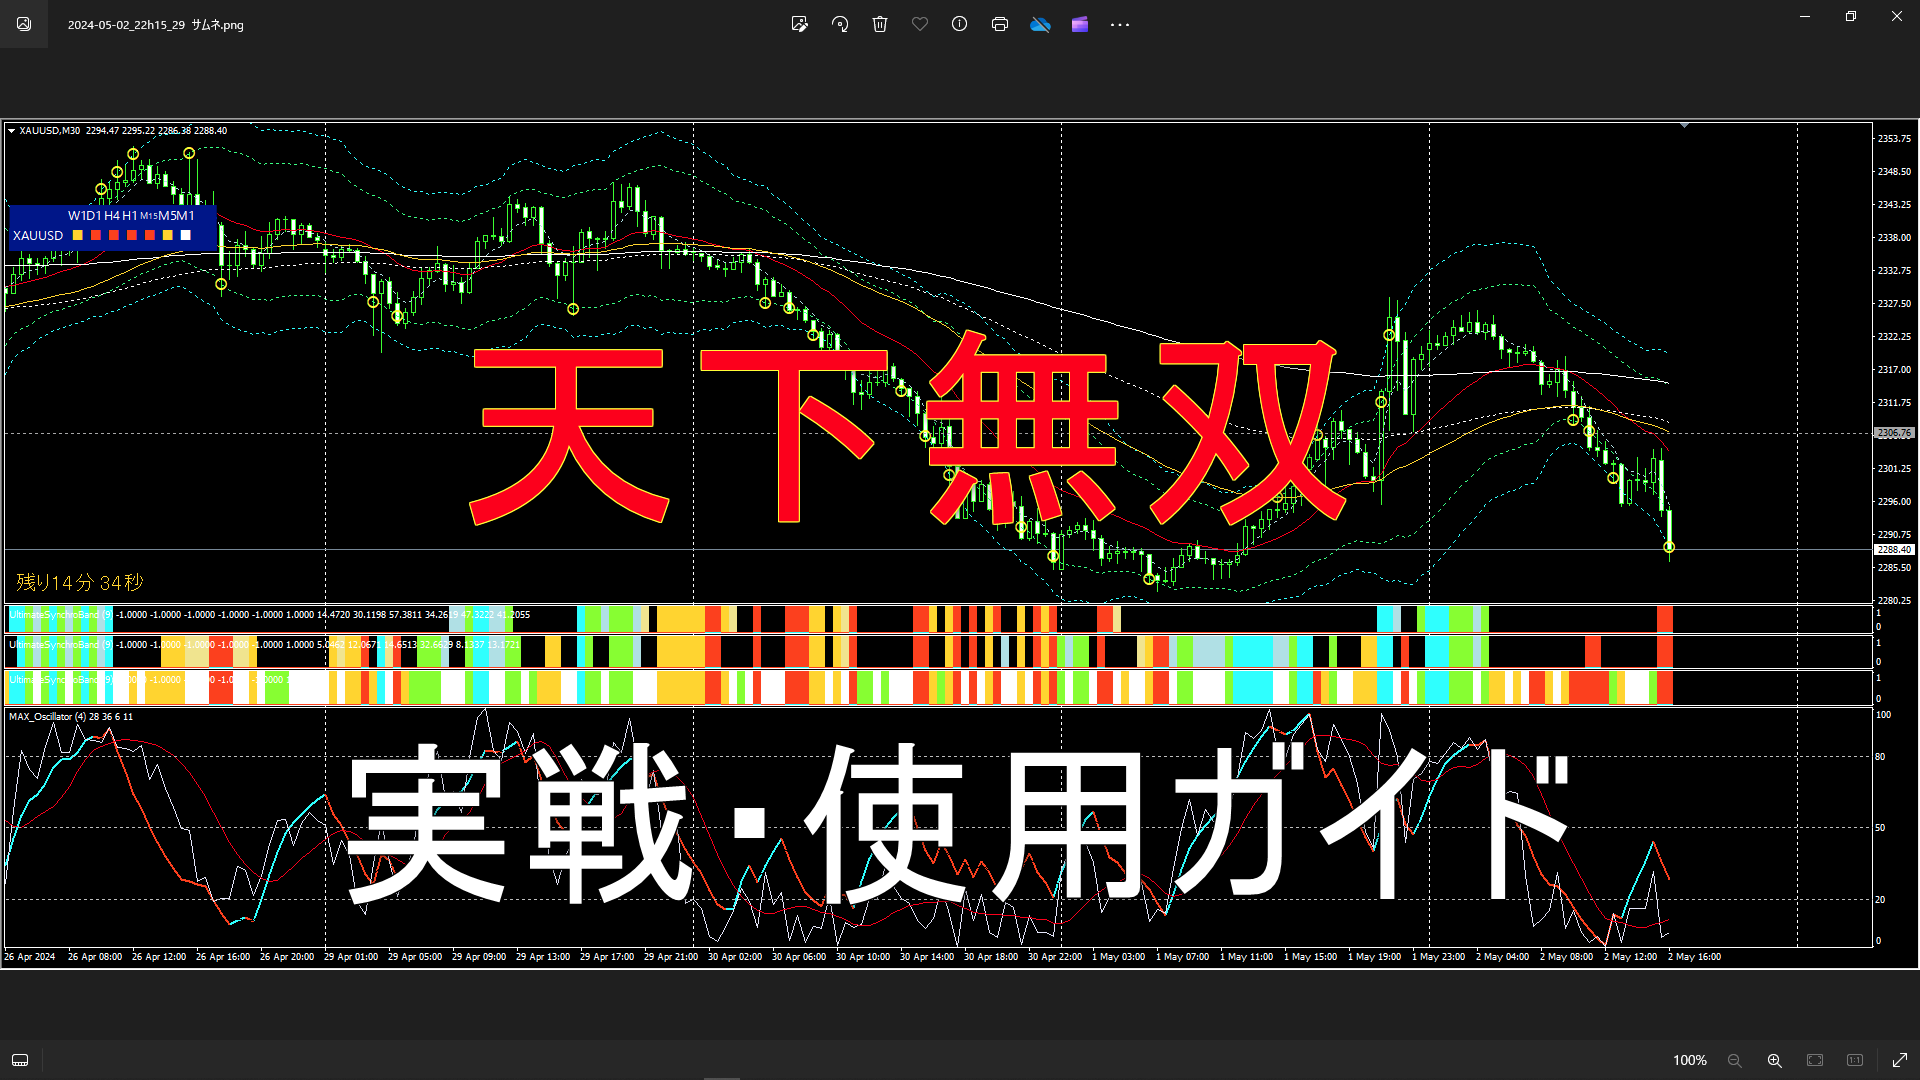

"Matchless Under Heaven" Synchro System Practical Edition 13: A Case Study of a Major Turning Point in the Flow / Key Points, Cautions, etc.
Introduction - Special Interview Video
We introduced it to you in the form of a video interview from Gogojan.
Content with viewing perksis available. If you haven't watched it yet, please take a look.
Episode 1
https://www.gogojungle.co.jp/info/22070
Episode 2
https://www.gogojungle.co.jp/info/22078
Episode 3
https://www.gogojungle.co.jp/info/22089
“Tenka Musou” Sync System - Configuration
■ Indicator configuration and priorities
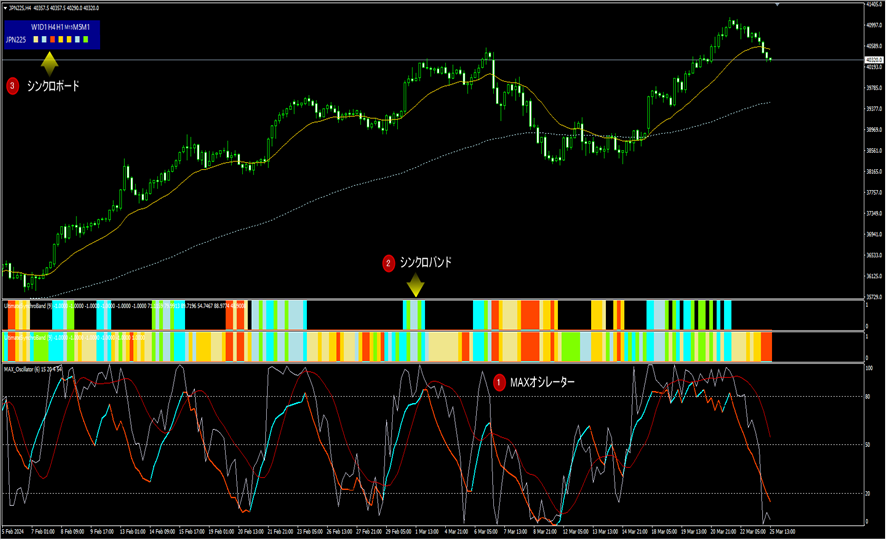
Indicators consist of the followingThree mains and Sub2 for a total of five indicators.
Main/Display these three first and understand. They work powerfully in combination.
① MAX Oscillator:A newly developed oscillator.
② Ultimate Syncro Band:Color band of the oscillator window
Direction of price movement, strength, monitoring recommended state・MTFConformity visualizes.
③ Ultimate Syncro Board:Color board.
Displays the state of synchrony across multiple currencies and multiple timeframes in one glance.
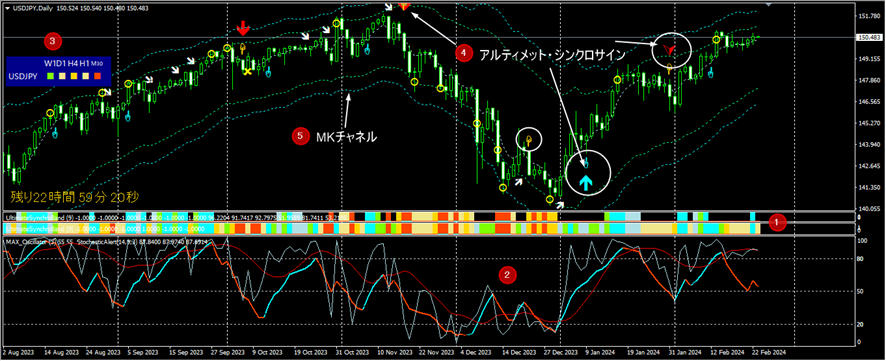
Sub:④①②③ become familiar and confirm you can win with just ①②③, use as an aid
④ Ultimate Syncro Sign:Arrow signs.
Shows upward/downward signs, marks a temporary disable, and depicts divergences.Useful for reinforcing reasons and raising awareness。(Originally this was the main one.
⑤ MK Channel:A belt like on the main chart.
Essentially an amplitude measuring tool, measuring range,MAdeviations, choking on high buys, suppressing sharp sells, taking profit targets, etc.
The order of reading the manual is alsoprogress through ①②③, display only ①②③, and proceed to verification and practice
After that, incorporate ④ and ⑤ and selectively decide what is needed or unnecessary.
※ The following are recommended examples for day trading, scalping, and swing trading.
■ To see a list of past articles, please check the link below.
https://www.gogojungle.co.jp/finance/navi/series/1745
■ This article content: Practical example of caution during a reversal ①
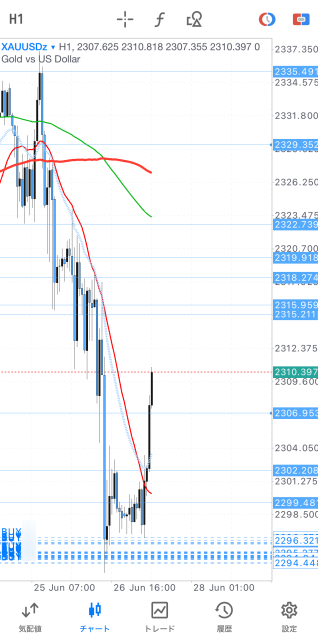
From June 26 to 27, after forming a bottom, gold turned up.
At this time, entry times vary, butall users entered by buying near the bottomand
Most earned profits of 200 pips or more, and some are still holding.
My entry
Screenshots of others' entries: each is a different person (a few others were listed)
Several other people also entered together by buying.
In response to thisUser Community "Mukyo Kaigi" (Invincible Conference)asked why everyone could take long-bottom buying positions, so
we would like to explain the perspective and key points.
Point ①: Identify the reversal point
A
it is better to rough out candidates.
Methods
A Horizontal lines drawn from past price movements
B Key highs and lows from the past
C 重要 price derived from volume profile indicators, etc.
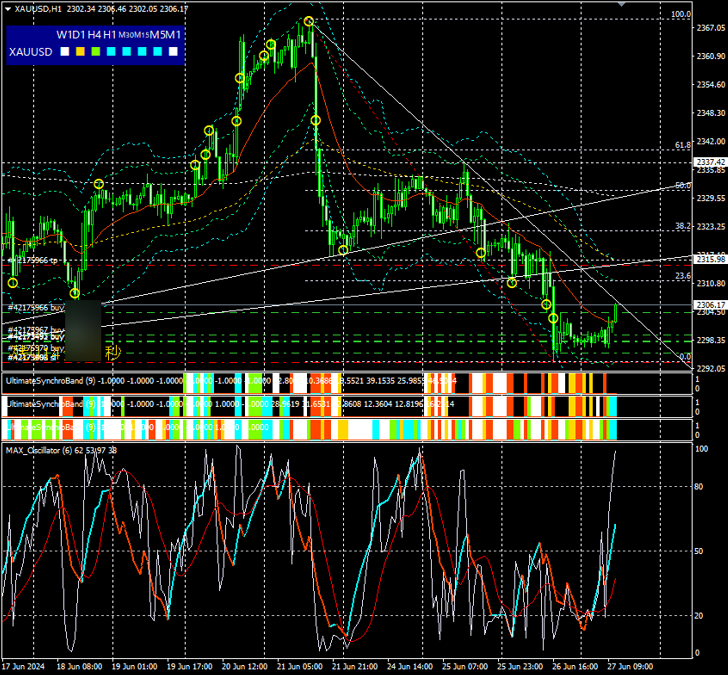
Please look at the screenshots below.
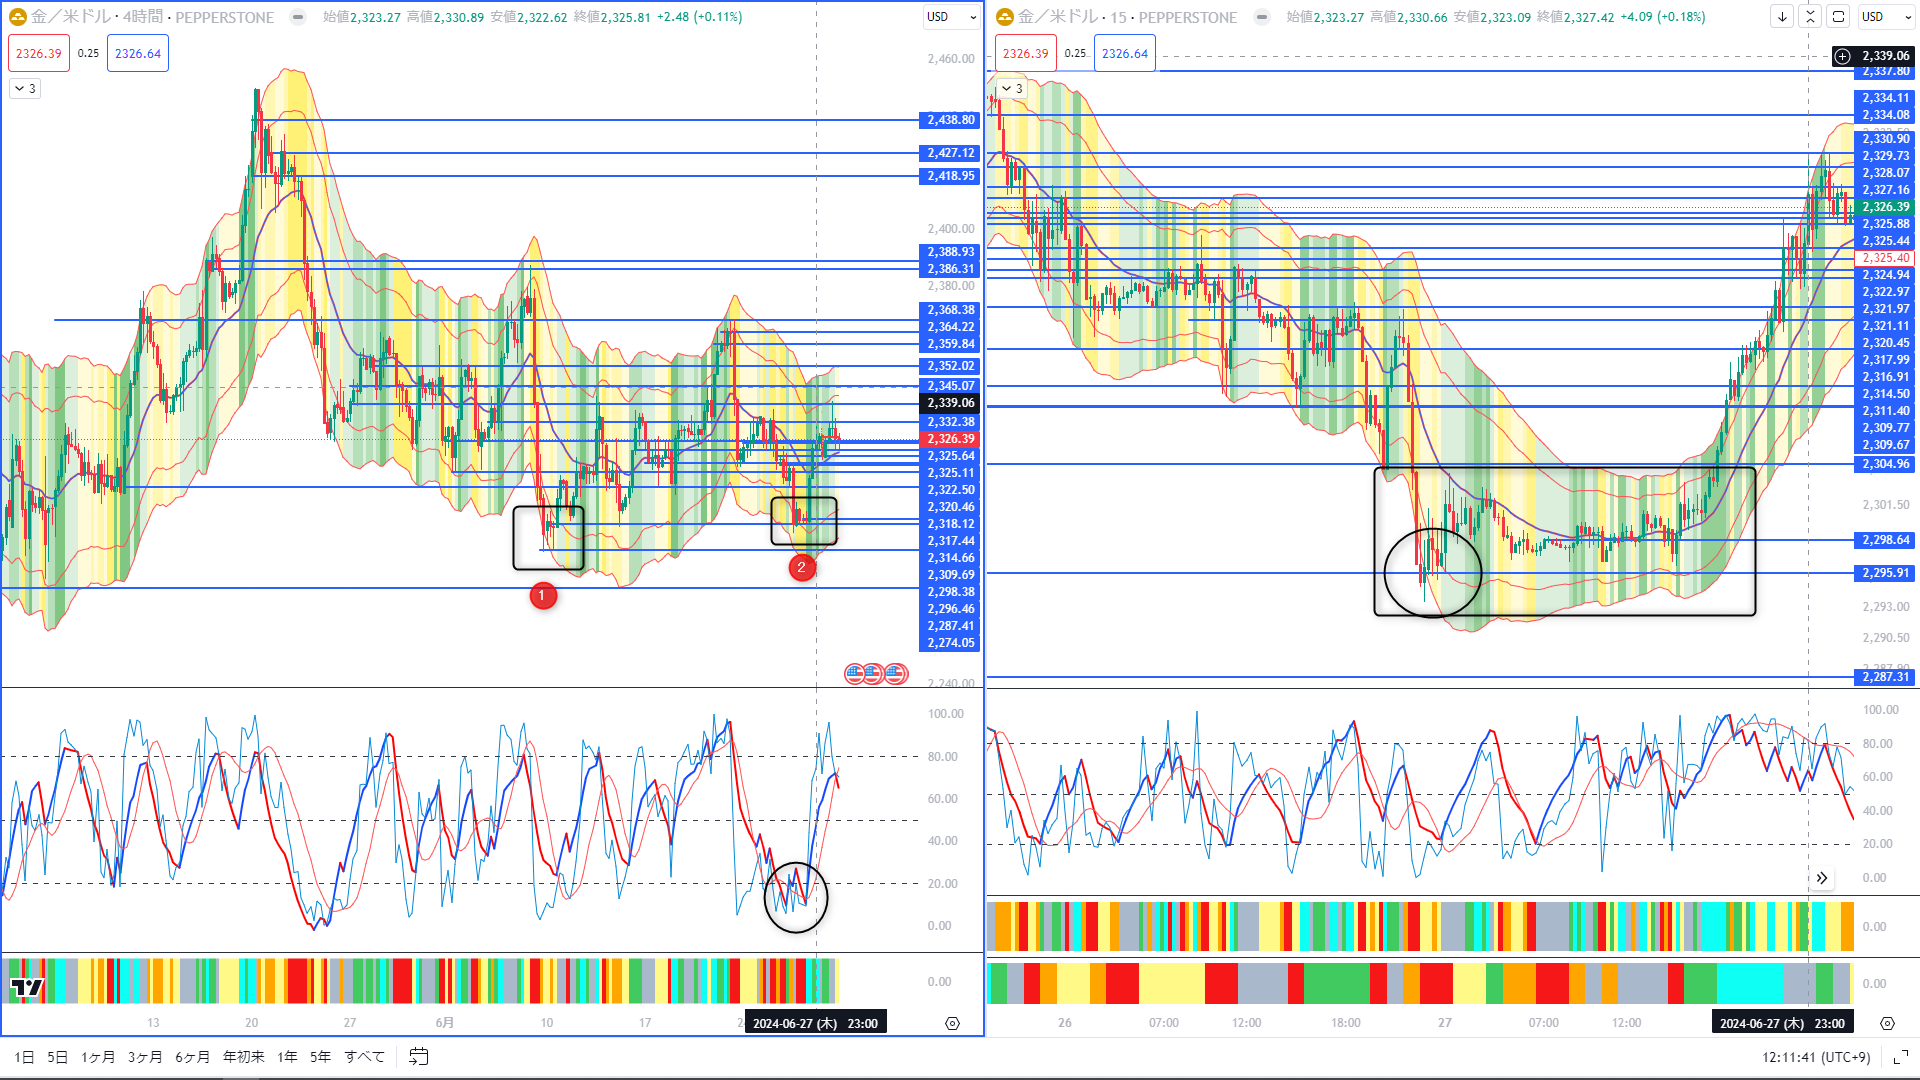
First, the horizontal lines, drawn since last year,
Trace of Volume Profile Indicator called AAVP Auto AnchorVolume profile indicator traces
As well as,horizontal lines drawn at important high/low points.
The reversal turning point is near the nearest recent low of the line of ①.
B Position of MAX Oscillator and MK Channel vs price movement
Check the position of the MAX Oscillator on the 4-hour chart. It is close to the bottom.It is near the bottom.
While further decline is not impossible,the possibility of a reversal is high.
Also, the MK Channel is far from balance, near three deviations. Pay attention to such areas.
C Time zones are also important
Next, switch to 1-hour and 5-minute charts.
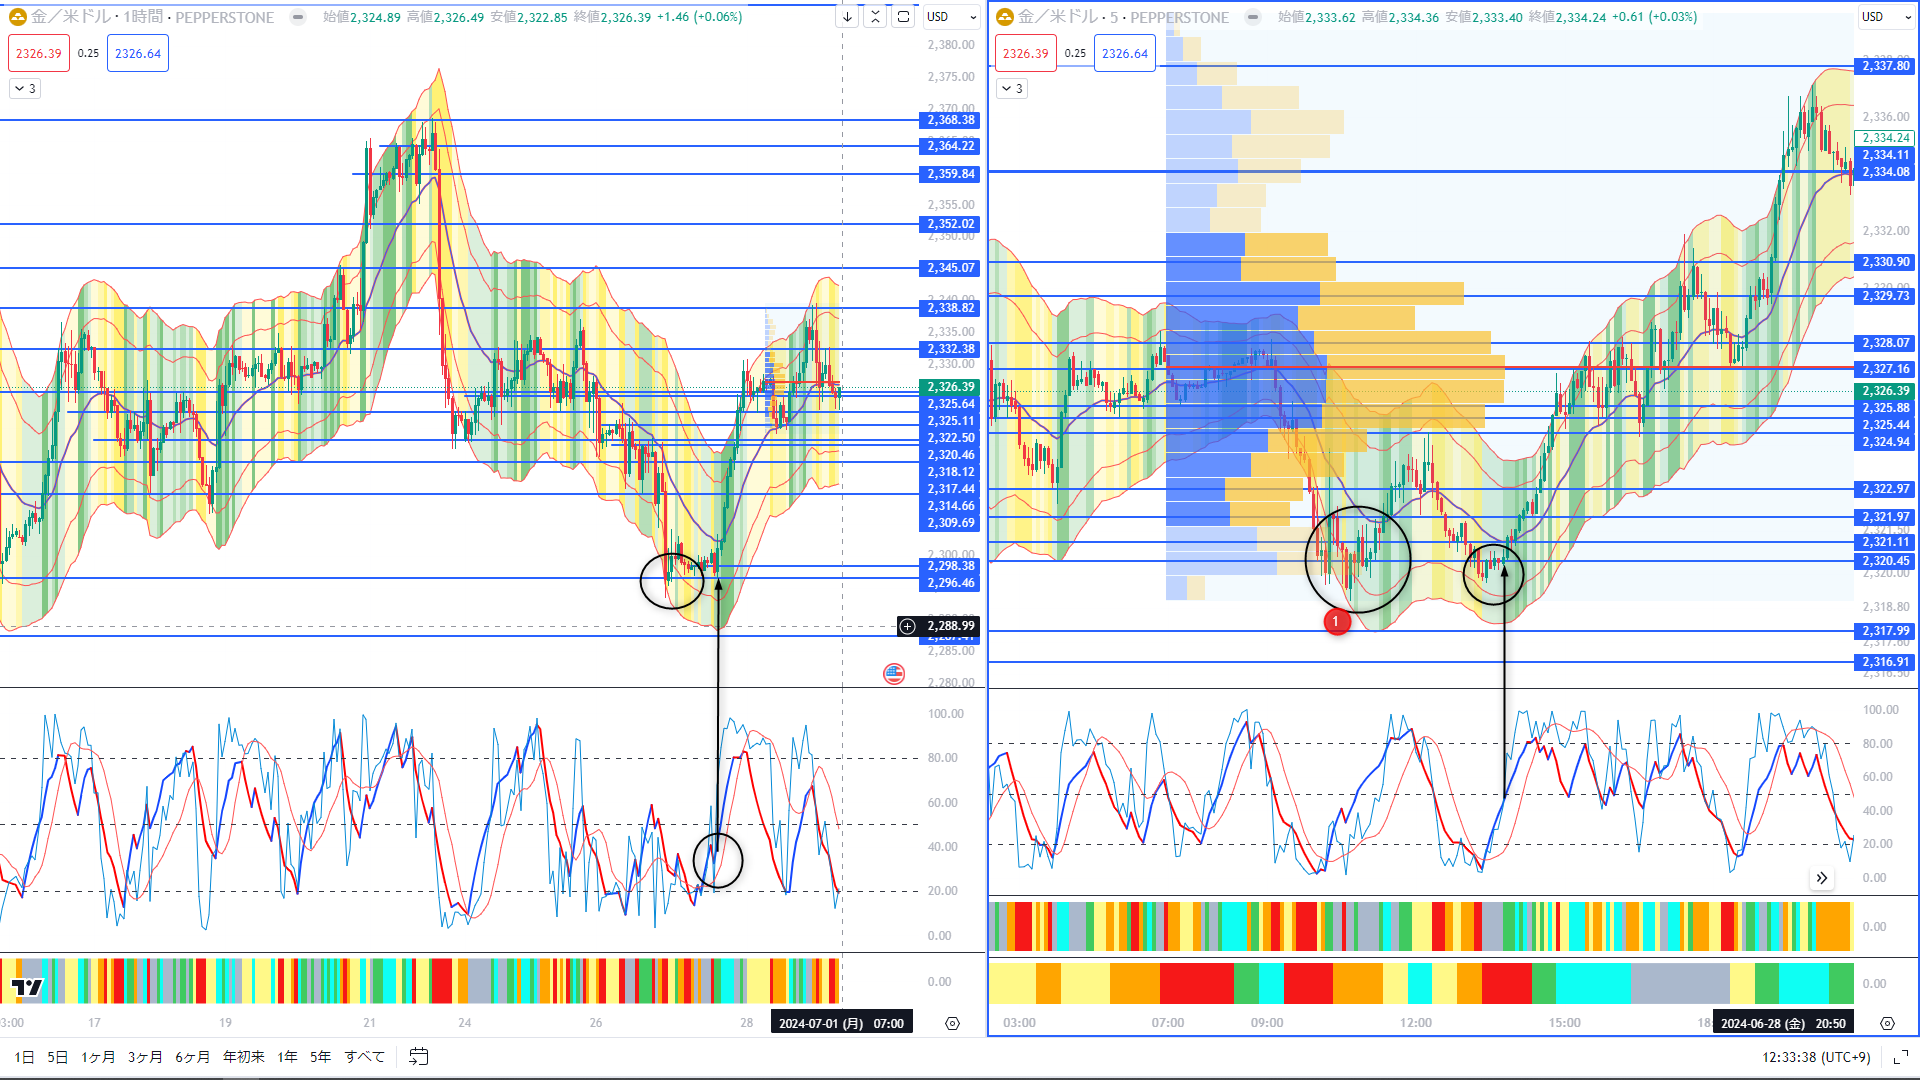
The time when the rebound low was reached is
June 26 (Wednesday) after 22:00By this time, the US market opened and indicators released, causing a large drop.
In the early European session → US market open (around 21:00) → US stock market open (around 22:30) → London fix (0:00),
these are times that become turning points, and US economic indicators also cluster in this window.
It is not predetermined when the flow will reverse, butat some point in this time window,
the prior trend may pause and abruptly reverse in some cases.
In this case, the sharp drop from around 21:00 stops near the points mentioned above, and on the 5-minute chart you may see several rises.
Observe the price action near the points and consider taking a contrarian position as a test, or scalp on reactions.
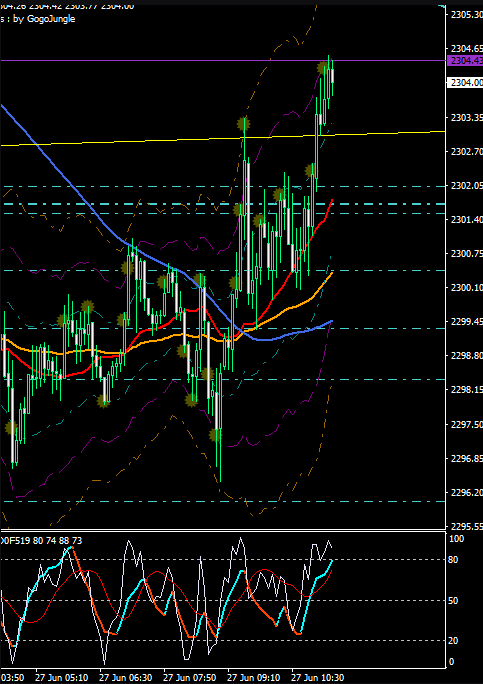
Point ②: Reversal confirmation: reversals often take time
I captured a 15-minute chart from the above screenshot.
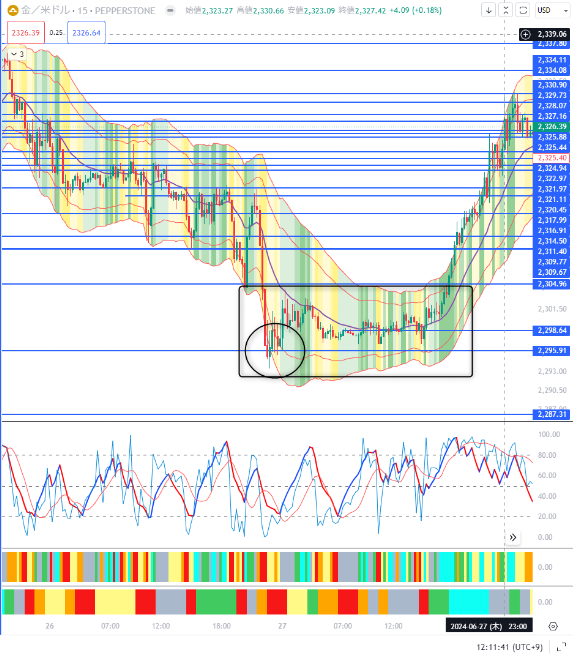
in most important reversals,at least one more attempt to push to new highs/lows will be made.
■ Important!Do not hard-code this as the bottom or top.
If you assume it is the bottom and build a large position, you may be forced to sell again on a pullback.
Even after taking a position, monitor closely for another reversal high/low; if not yet confident, take profits first. Ormanage funds so you can handle a reversal that you anticipated.
B Confirm reversal is definite and build or add positions
Next, switch to the 1-hour chart.

The 1-hour chart's Sync Band changes to a strong upward move (light blue),the next day at around 16:00. This is when the European market intensifiesthis band.
Also, as seen on the 5-minute chart, the price forms a double bottom without breaking the previous day’s low.
■ B Important!Wait for a larger 30-minute or 1-hour chart reversal before entering
※ When formations like double bottoms or triple bottoms appear, wait for a strong reversal before entering, as this increases the likelihood of a reversal.Entering after the reversal is likely to be more reliable.
Summary
① Anticipating reversal points
※ Methods
A Horizontal lines drawn from past price movements
B Key highs and lows from the past
C Important price derived from volume profile indicators, etc.
■ 4-hour and daily, the positions of MAX Oscillator and MK Channel
■ Time of day is also important
Point ②: Reversal confirmation – reversals often take time
A Do not be reassured even if you think it is a turning point high/low!
Do not hard-code this as the bottom/top.
BWait for reversal confirmation on a slightly larger 30-minute or 1-hour chart before entering
■ Sync Band strong synchronization onset, complete reversal of MAX Oscillator
■ Consider characteristic formations and price actions
■ Time of day is important
If you confirm carefully and respond to reversals prudently,
you can start a trade with very high expected value.
Practice well, verify, and then implement!
※ Nowadays the market is driven by advanced AI developed with enormous investment or by genius engineers.
Do not take it lightly, be humble, learn repeatedly, and grow!
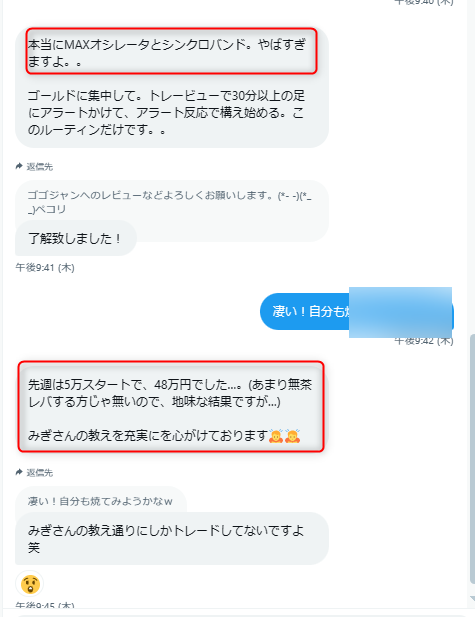
About the Ikusa Musou Series: Analysis Tools
■ From user DMs
※ For details on the Tenka Musou Sync System, please see below
“Tenka Musou” Sync System
https://www.gogojungle.co.jp/tools/indicators/50319
Toreview edition - Ultimate Syncro System
https://www.gogojungle.co.jp/tools/ebooks/50353
※ Each system indicator is also available as a one-time purchase version.
■ MAX Oscillator - MT4/5 version
https://www.gogojungle.co.jp/tools/indicators/50340
■ Also the Toreview version
https://www.gogojungle.co.jp/tools/ebooks/50353
■ Ultimate Syncro Band
https://www.gogojungle.co.jp/tools/indicators/42606