

Bitcoin (BTC) breaks below the support line with a sharp drop; what will happen to the price moving forward? - October 10 Chart Analysis
Since October 9, after breaking below the pennant pattern's descending trendline and turning it into support, Bitcoin (BTC) had supported by the line only briefly, and subsequently showed a sharp drop breaking the support line. It is currently exhibiting a rebound after the recent drop. How will Bitcoin move in the near future? We will check the chart.
Bitcoin (BTC), which once broke the trendline, rose but struggled to advance and faced strong selling pressure
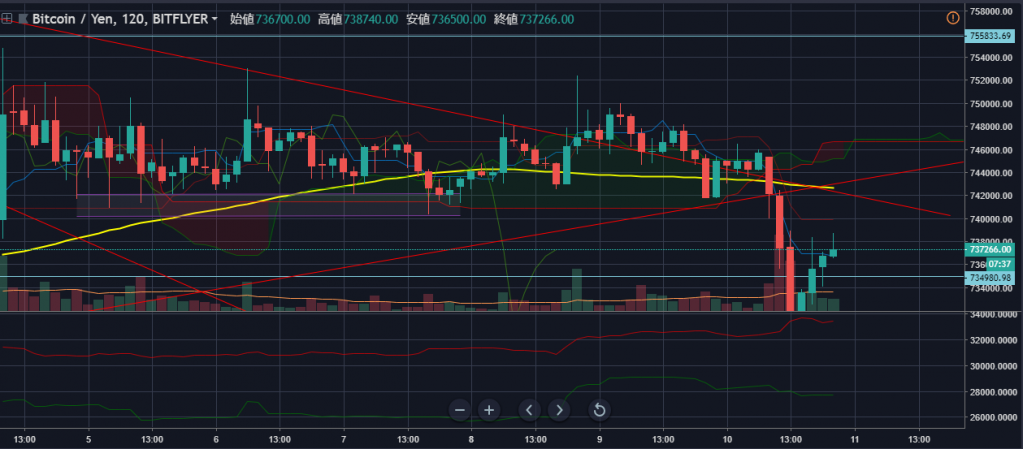
Although BTC gained a factor for switching to an uptrend after breaking the trendline, the rise did not materialize significantly, and it faced a rebound around the 750,000 yen level. On the BTC 2-hour chart, the candlestick ended up with a long upper wick.
Afterward, the price continued to move with the trendline acting as support, but on October 10 today, there was again a movement that broke below the trendline. Although the price rebounded immediately after dropping below the trendline and recovered, the downward momentum was strong, resulting in BTC falling to the 720,000 yen level. After touching the 720k yen region, BTC is currently showing a rebound and is moving around the 730,000 yen level.
※ Above this line is public for everyone
If you delete this notice, everything will be public for everyone, so please be careful.
Also, images can be pasted by drag-and-drop from outside.
※ Below this line is public to purchasers
(Please rewrite this part for purchaser access)