
This Week's Trade Commentary
I would like to start a series that selects and explains trades from this week that may be useful for everyone, and (if possible) publish it once a week.
This time, the trade I will explain is around 2 o'clock on Monday early in the week (MT4 time).
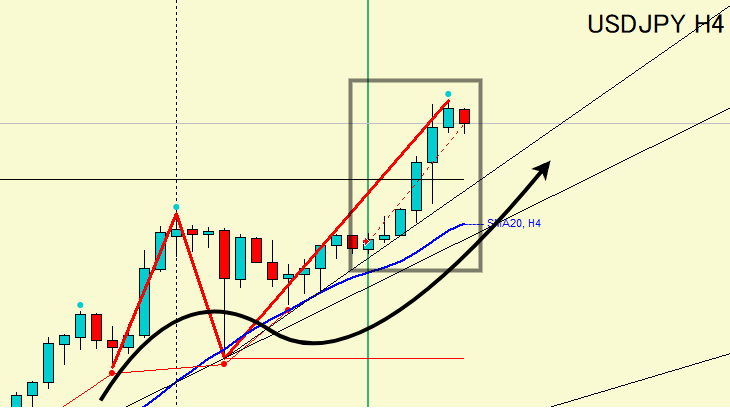
・4-hour chart
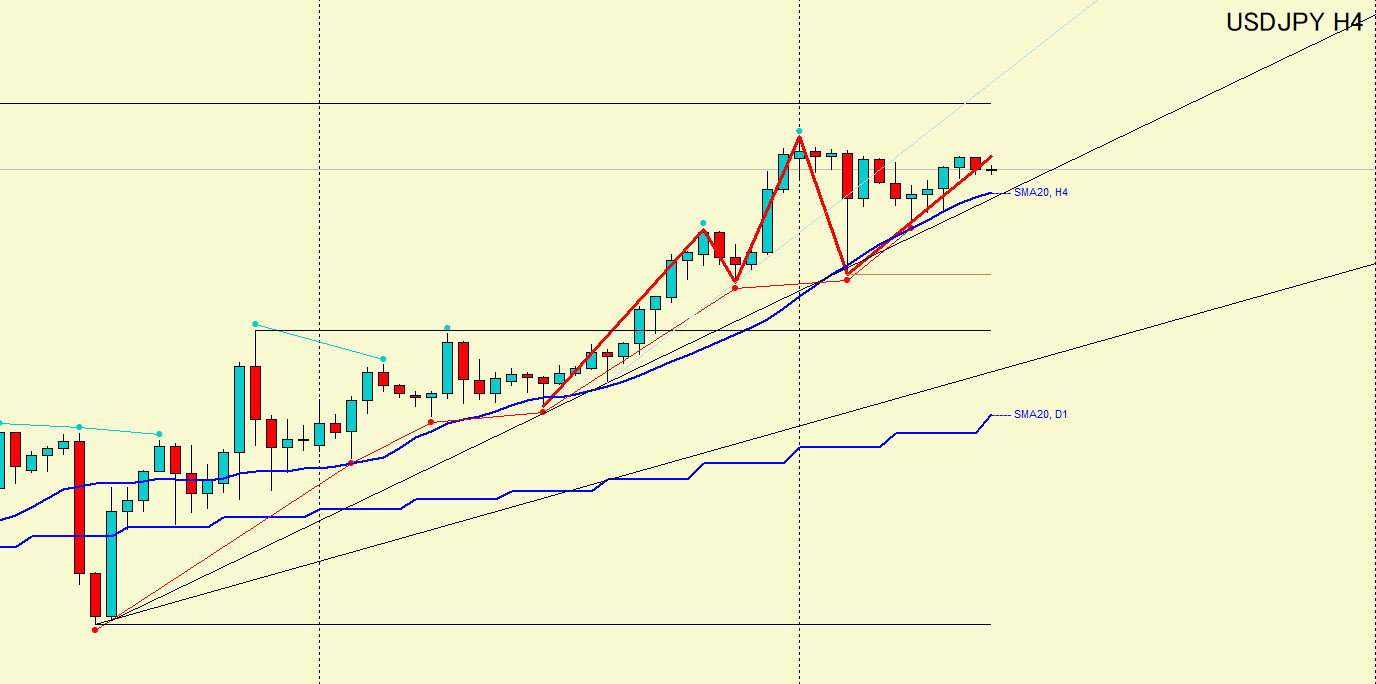
・An uptrend is forming, supported by moving averages and trendlines.
・There are past horizontal lines at the highs, so even if it rises there is a possibility of a pullback.
・1-hour chart
Now, let's look in more detail on the 1-hour chart.
This is the pullback (correction) part of the uptrend seen on the 4-hour chart.
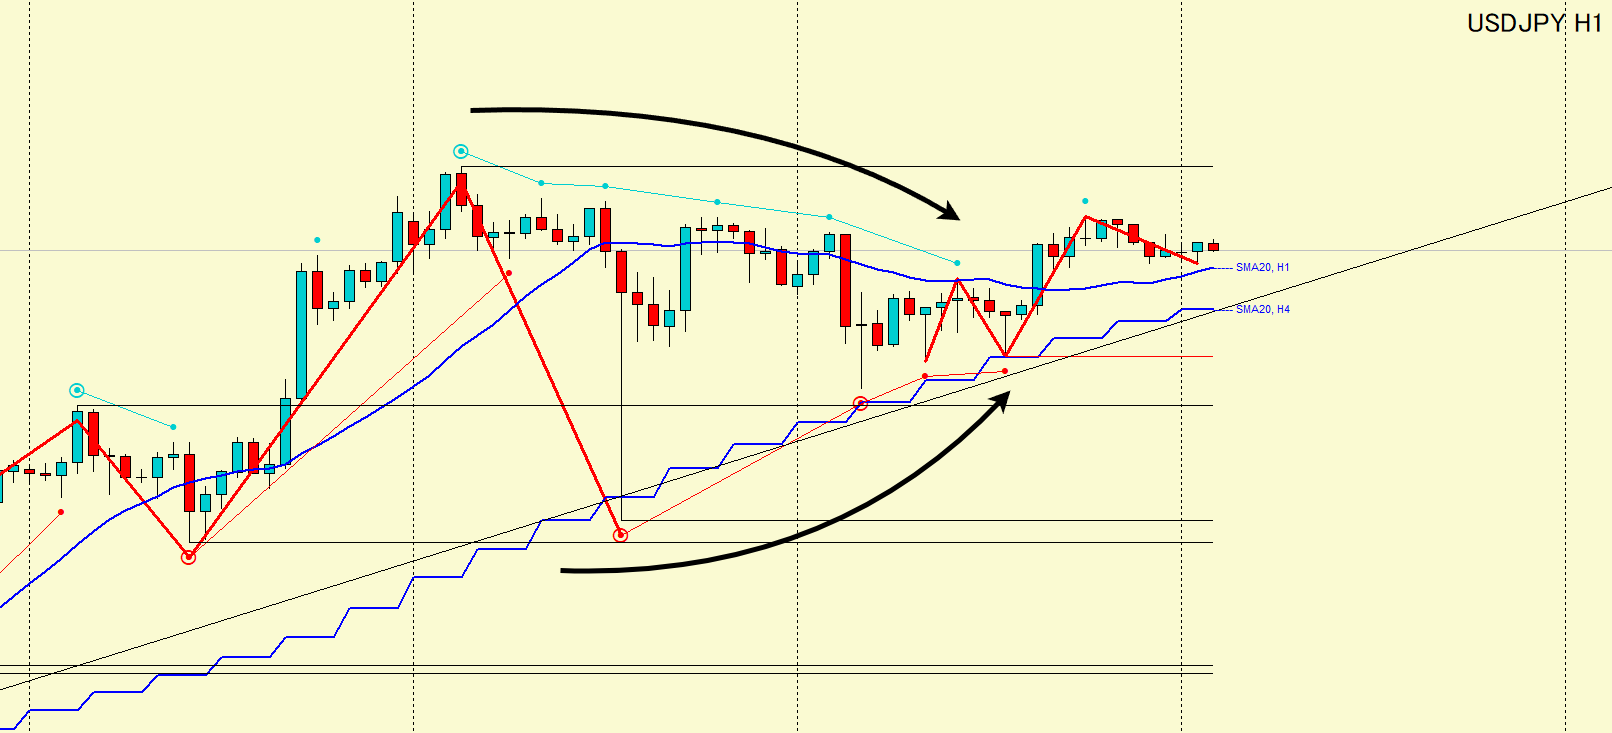
・As a correction wave forms by making lower highs, the lows are also risingleading to a convergence in price movement, which can be observed.
This often occurs when the timing of the correction wave or the direction of the trend is changing, or when there isn’t enough price momentum.
This time,at the timing of the correction wave,the price action had not settled yet, so such a situation occurred.
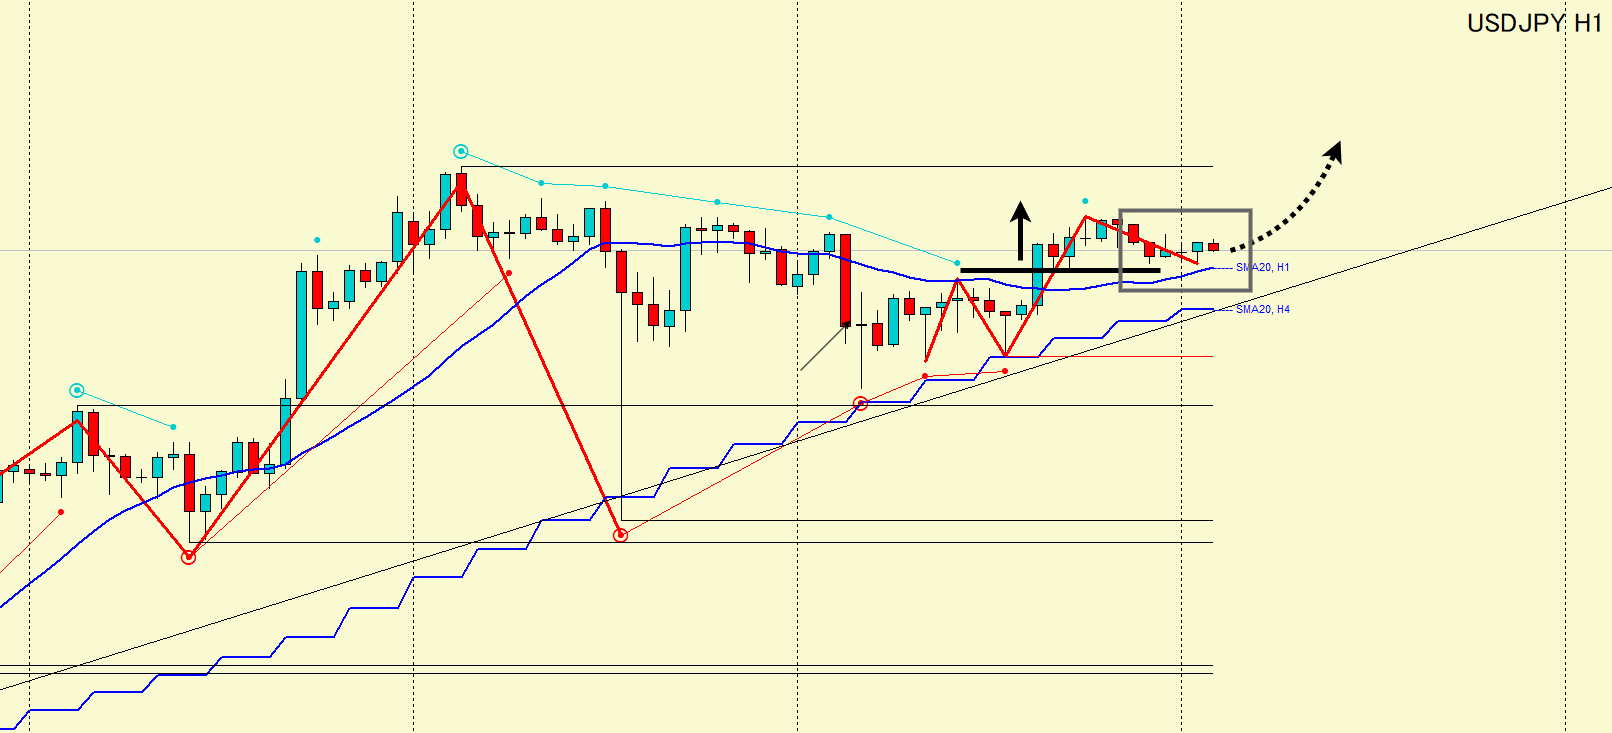
After the price action converged,the highs were broken and the market resolved to the upside, establishing an uptrendsimultaneously.
With the 1-hour uptrend established, I plan to trade by aiming to rise in the timing where the price is supported by the moving averages in the currently forming corrective black-box area.
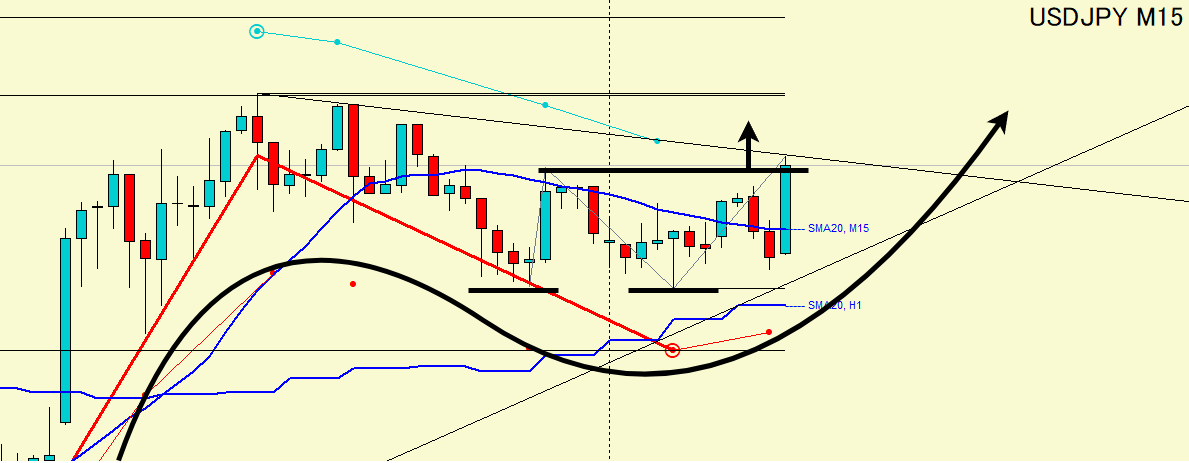
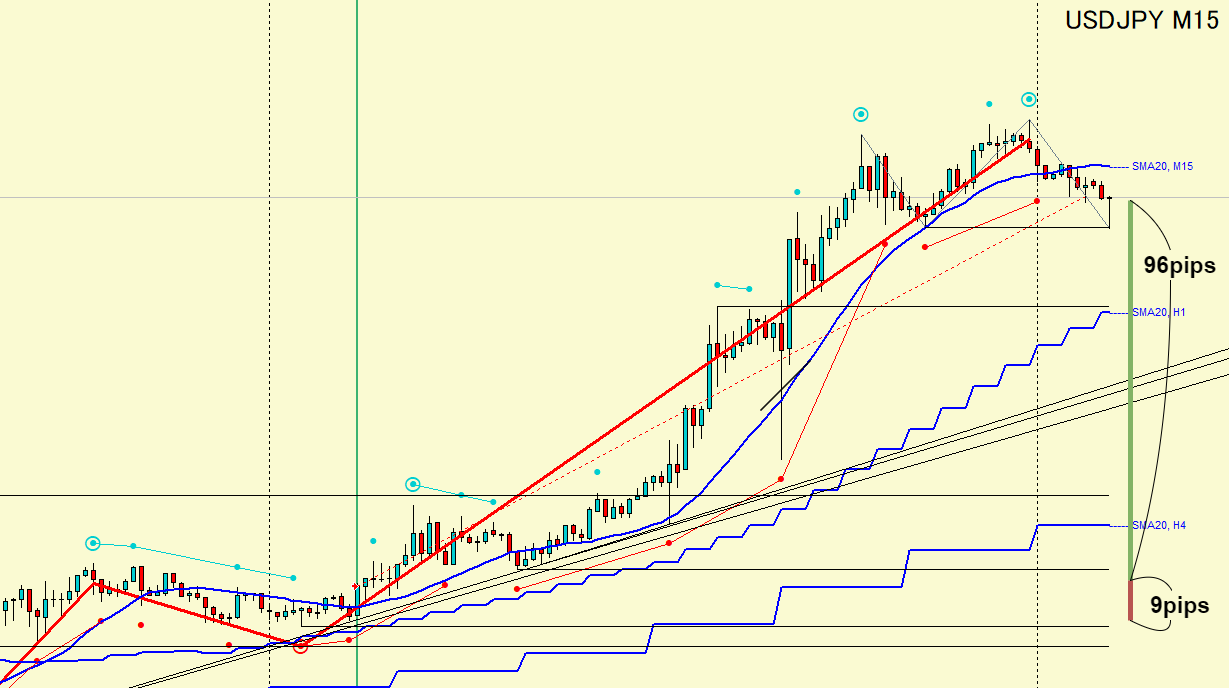
・15-minute chart
Now, let's look in more detail on the 15-minute chart.
This is the correction wave of the uptrend established on the 1-hour chart.
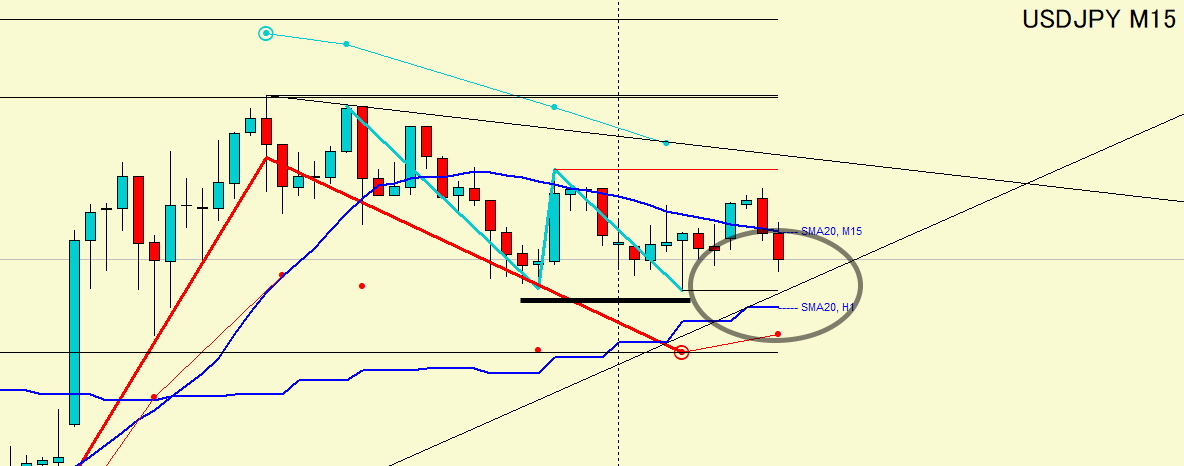
On the 15-minute chart, a downward correction wave has formed, but the lows have hardly moved,forming a double bottom.
In the black circle area, the “recent low, trendline, and moving average” overlap,providing very strong reversal material.

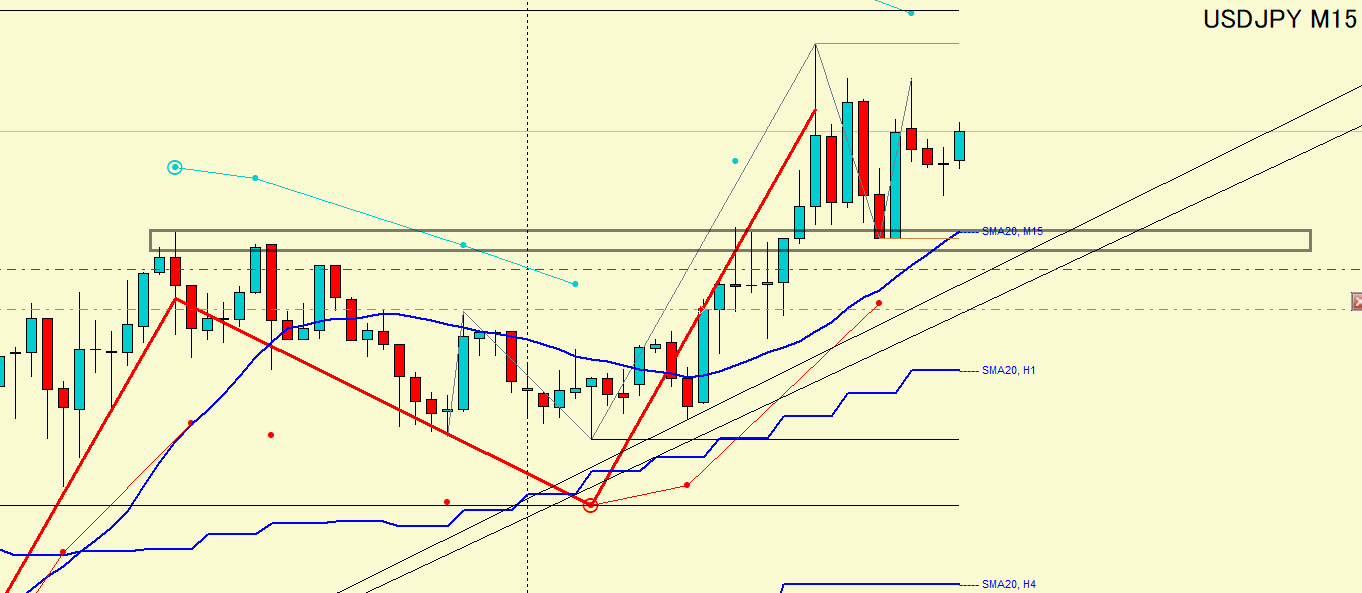
Subsequently, the neckline of the double bottom was brokenand the downtrend ended.
Although the 15-minute chair alone did not establish an uptrend,when combined with the higher-timeframe context there was strong justification, so I entered a long position at this timing.
・After the entry
I managed to capture the move and it rose.
The green dashed line is the entry point, and the red dashed line is the stop loss.
Since the price found support at the previous high within the black-box area and formed a lower low, I updated the stop loss below that level.
Later the price made a lower low and entered a downtrend, but it was supported by the trendline and the previous high, forming a double bottom.
Even if the stop had been hit, the trade would have been profitable, but it did not get hit.
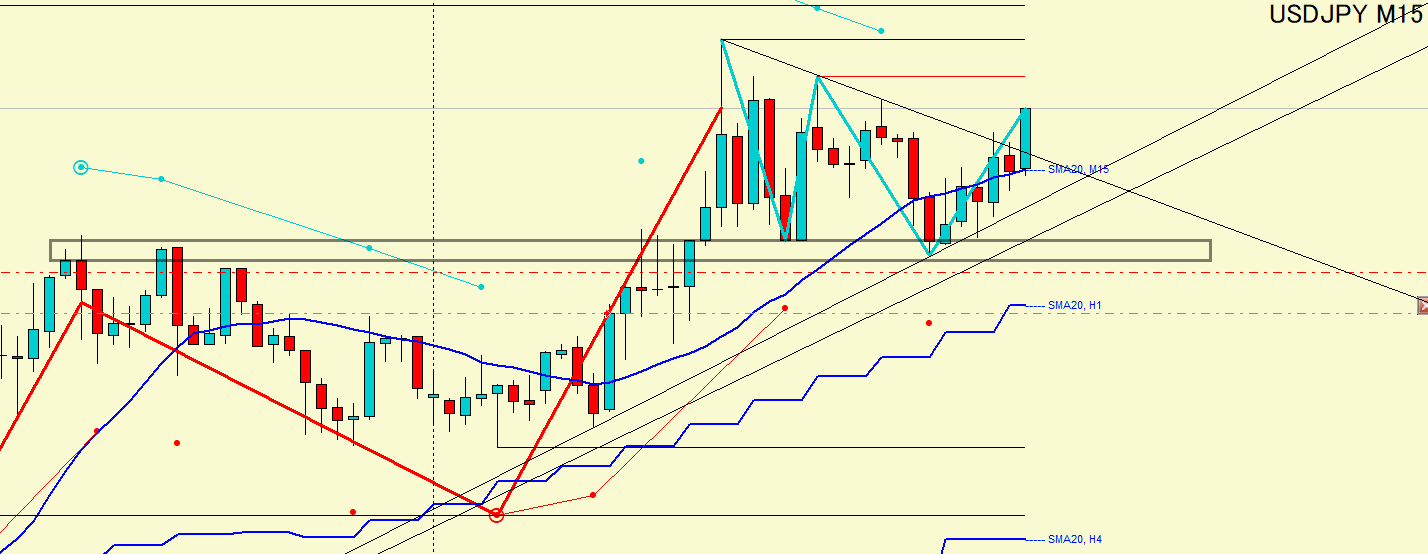
I can already see movement to break the counter-trend line and rise again.
Afterward, the momentum carried onto the 4-hour time frame’s buyers, creating a large trend.
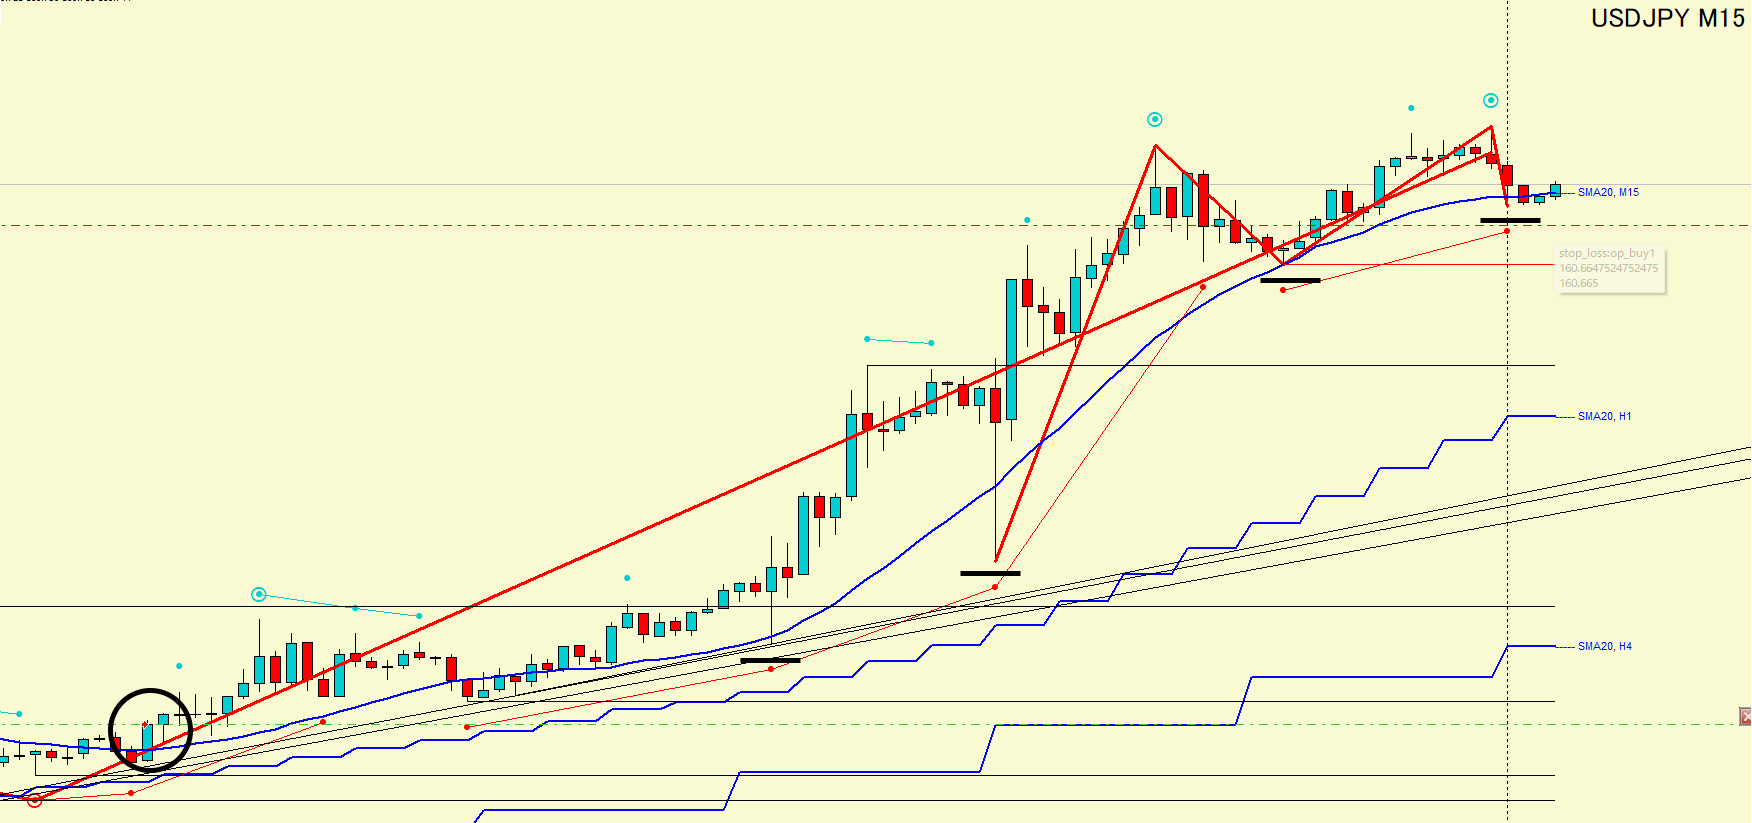
The black circle marks the entry position.
The price continued rising as it updated the stop loss higher while making a new low.
Ultimately, a double top formed and the price broke below the low, so the trade was closed.
In terms of risk-reward, it was about 1:10.
From a purely result-focused perspective, it might seem difficult, but the justification for the entry was confirmed by higher-timeframe context, and
on the 4-hour chart, I was simply targeting this black-line area.
Traders cannot manipulate the market during a trade.
I only updated the stop loss.
When you lose,it is because the market context before the trade was incorrect.
Of course, markets do not always move exactly as theories predict, so a loss does not necessarily mean the pre-trade context was completely wrong, but
for us traders, the area we can improve is in market analysis and timing.
The indicators used for this market context are here
The indicators used for this trade reproduction are here
Because some materials need to be prepared, I cannot guarantee weekly posts, but
I plan to regularly provide explanations of such trade examples from now on.
I would be happy if there is anything useful you can take away.