

【June 30, 2024】Chart examination using the Sky and Earth indicators (11 currency pairs)
This is a chart analysis. We have briefly explained 11 currency pairs whose future movements we are watching. We hope it will be helpful for your trades starting tomorrow.
Press the GOOD mark to boost our future energy. We would appreciate your cooperation for further motivation as well.
Please also remember to use Gogojungle's relief coupons distributed up to today.
https://www.gogojungle.co.jp/post/46/20320

・This article mainly involves backtesting using the “Heaven and Earth Indicator”.
・The content is based on using the most accurate tool, the“15-minute chart + 4-hour chart simultaneous monitoring method”.
・This tool is a groundbreaking trading tool that can be used even if you do not understand the so-called FX theories (Elliott Wave, Dow Theory, Grahame’s Law, cycle theory, price action, Fibonacci, support/resistance, channels, etc.).
・The articles linked below introduce valuable DMs, reviews, posts from users. We select winning reports and useful DMs, so we believe they will be helpful to everyone.
[Daily updates] Actual user impressions (Review版) using Heaven and Earth Indicator
[Daily updates] Actual user impressions (DM版) using Heaven and Earth Indicator
[Daily updates] Search for “Heaven and Earth Indicator”

Heaven and Earth Indicator is a trading method using an original indicator developed by me, Abusan, released in February 2022. Thanks to everyone's support, “GogoJungle Award 2022, 2023” we were awarded for two consecutive years.
■ Heaven and Earth Indicator【MT4版】https://www.gogojungle.co.jp/tools/indicators/35780
■ Heaven and Earth Indicator【MT5版】https://www.gogojungle.co.jp/tools/indicators/47523
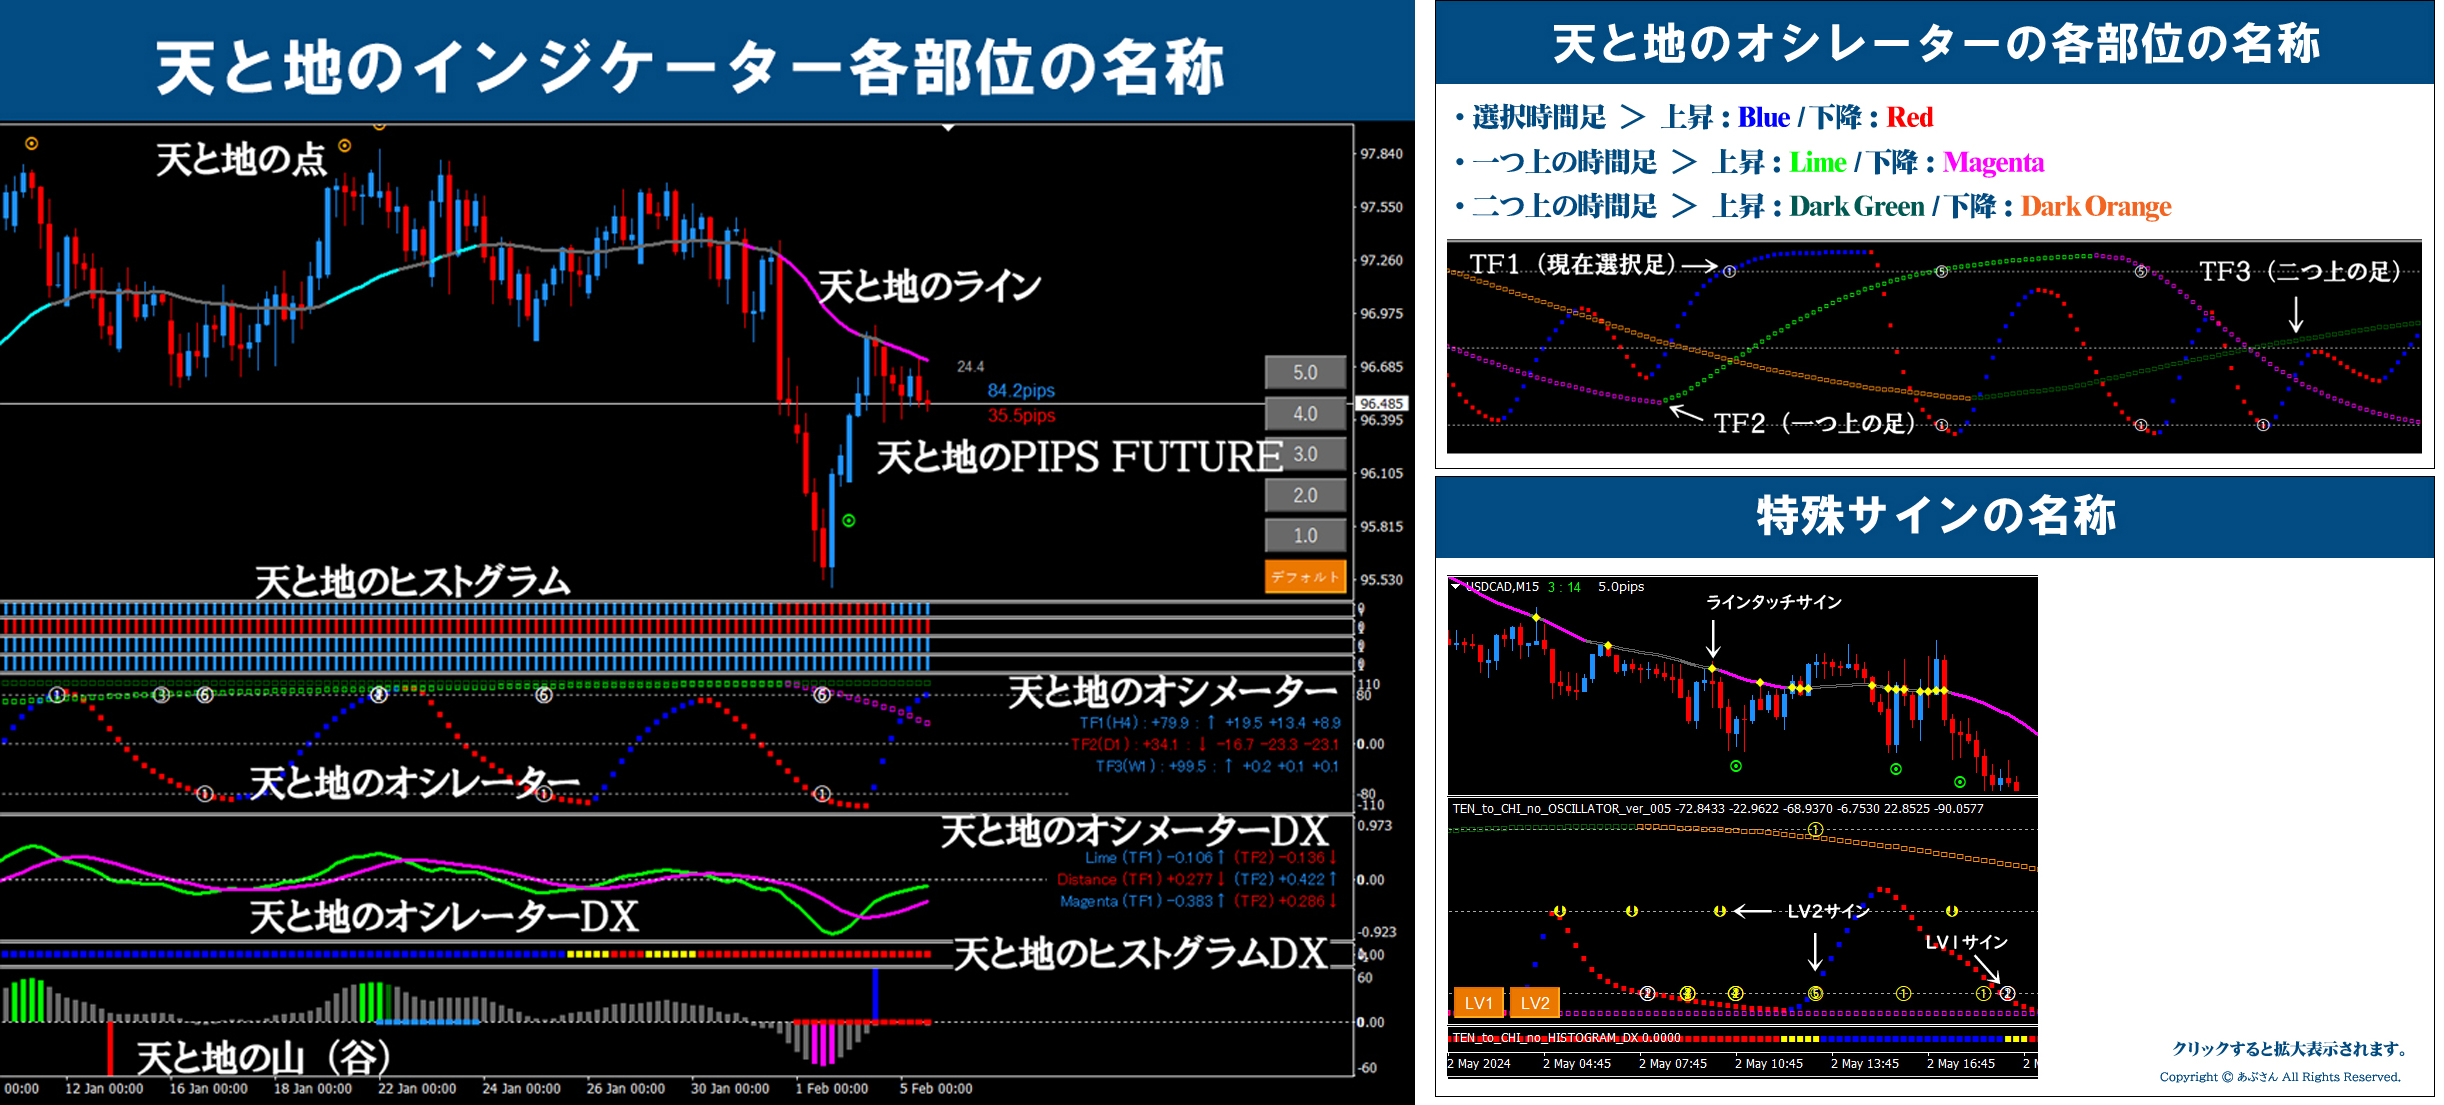
※For the specialized terms used in this blog,please refer to the image below. (All images enlarge when clicked) If you have any other questions, please refer to Heaven and Earth Indicator’ssales page for a general understanding. Already, users can just read the manual, right?
Now, let us move on to the analysis.
Thank you in advance!
※ All images enlarge when clicked.

※ Concise justification for what appears favorable is written. Set the viewpoint on this 4-hour chart, and look for entry points on the 15-minute chart that align with that direction.
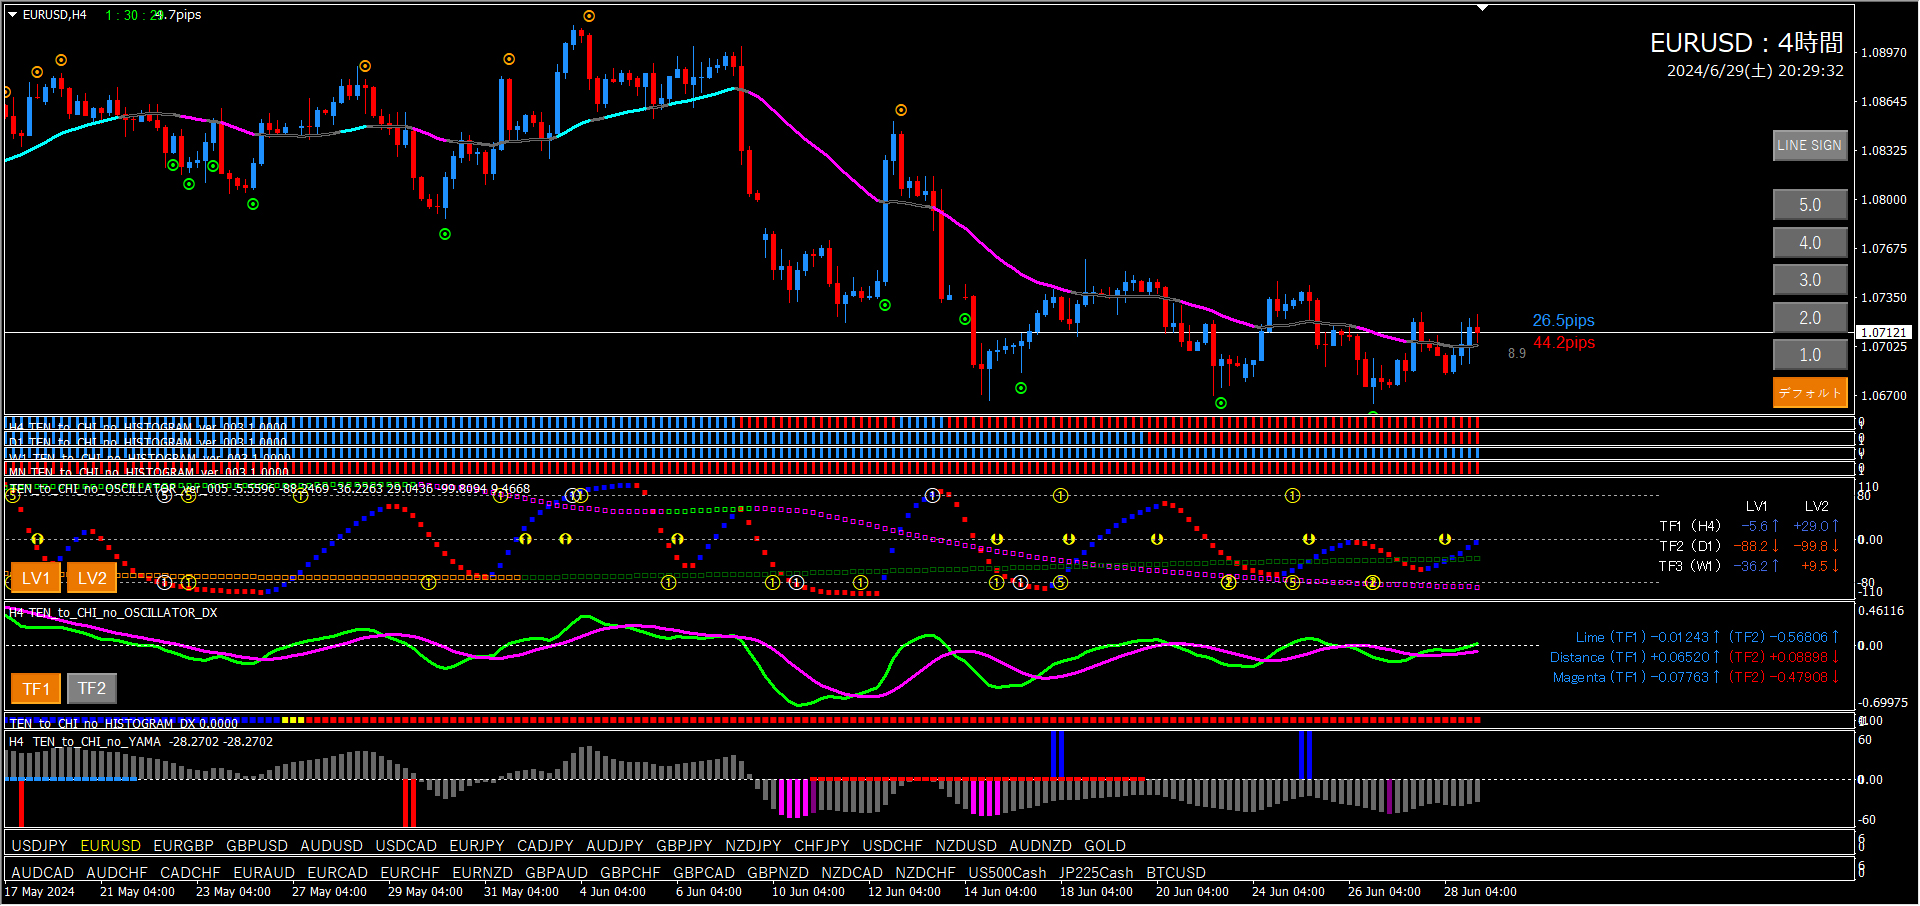
■ EURUSD 4-hour chart (environment recognition)
・Short entry signal around 26.5 pips
・Long entry signal around 44.2 pips
・Oscillator TF2 in decline, positioned at -88.2
・Oscillator TF1 positioned at -5.6
・Histogram, Histogram DX red
Currently below the downside target. If it rises further, we judge a downtrend from the short entry signal. The same applies if a long entry signal appears.
■ EURJPY 4-hour chart (environment recognition)
・Long entry signal around 35.7 pips
・Short entry signal around 11.2 pips
・Oscillator TF2 rising +0.3
・Oscillator TF1 positioned at +69.2
・Histogram, Histogram DX blue
If a long entry signal appears, adopt a bullish view. Lower the point level to confirm is preferable. For example, if the point level is 1.0 and a long entry signal is lit, you may use that as basis. Conversely, if signals appear frequently, raise the point level to reduce signal frequency and improve accuracy.
■ USDJPY 4-hour chart (environment recognition)
・Long entry signal around 48.4 pips
・Short entry signal around 18.4 pips
・Oscillator TF2 rising, positioned at -3.7
・Oscillator TF1 at -3.5
・Histogram, Histogram DX blue
・Oscillator LV2 all-direction convergence signals
First, judged as bullish from a line-touch rebound. If it then declines, judge bullish from the long entry signal.
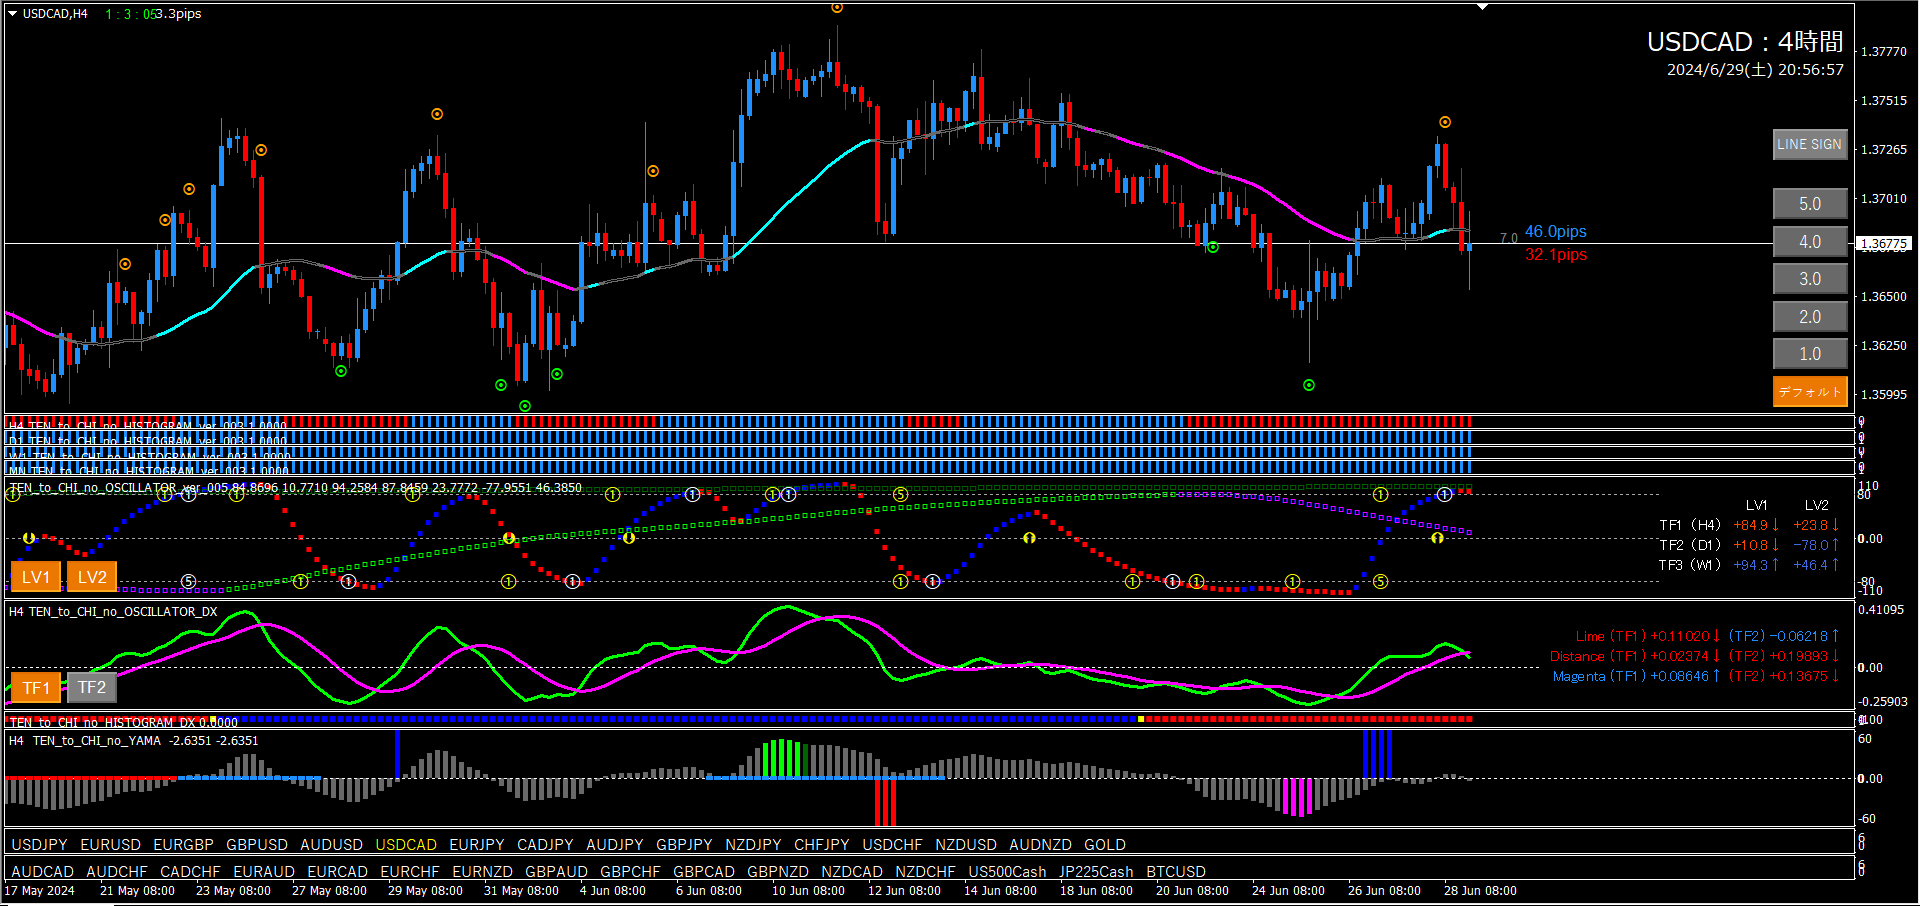
■ USDCHF 4-hour chart (environment recognition)
・Long entry signal around 32.1 pips
・Oscillator TF2 in decline, positioned at -10.8
・Oscillator TF1 at +84.9, just after a downward reversal
・Histogram, Histogram DX red
Although Oscillator LV2 all-direction convergence signals are present, Oscillator LV1’s pattern is very good, so we judge a downtrend from the long entry signal.
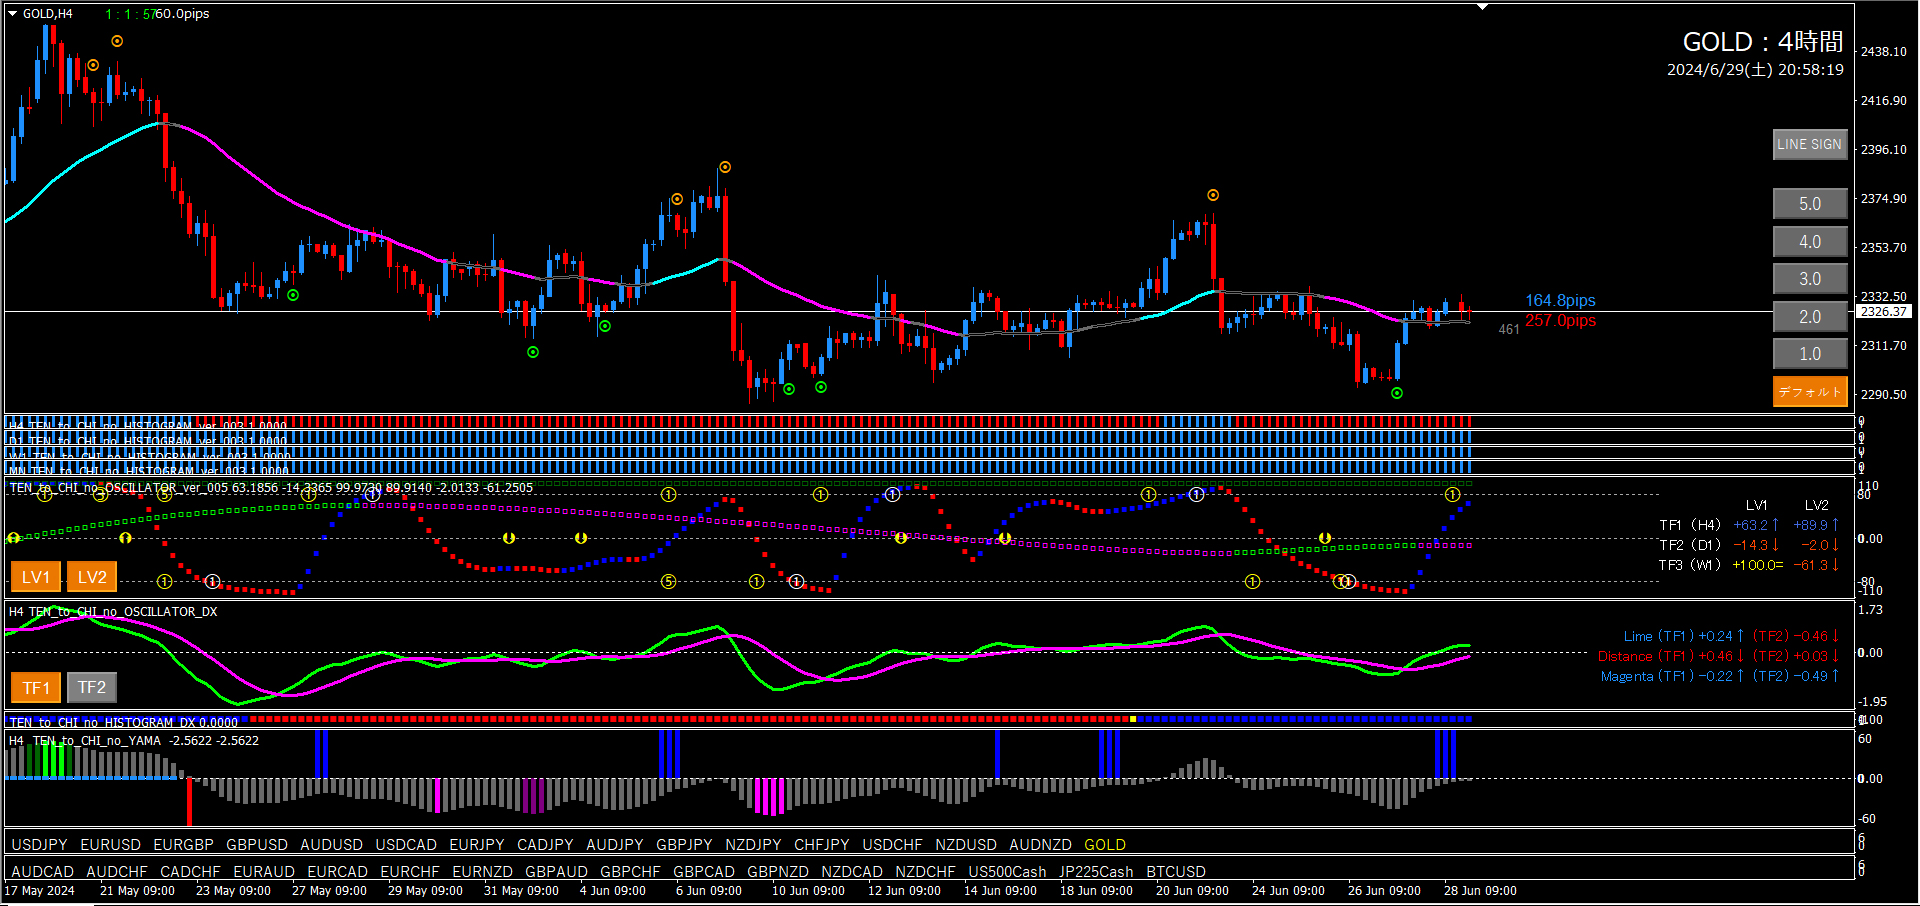
■ Gold 4-hour chart (environment recognition)
・Short entry signal appears around 164.8 pips
・Long entry signal appears around 257 pips
・Oscillator TF2 in decline, positioned at -14.3
・Oscillator TF1 at -63.2
・Oscillator LV2 first signal lit
・Valley signal
Although Oscillator TF2 shape is not ideal, other conditions are in place, so we judge a downtrend at present. If it rises further, wait for a short entry signal.
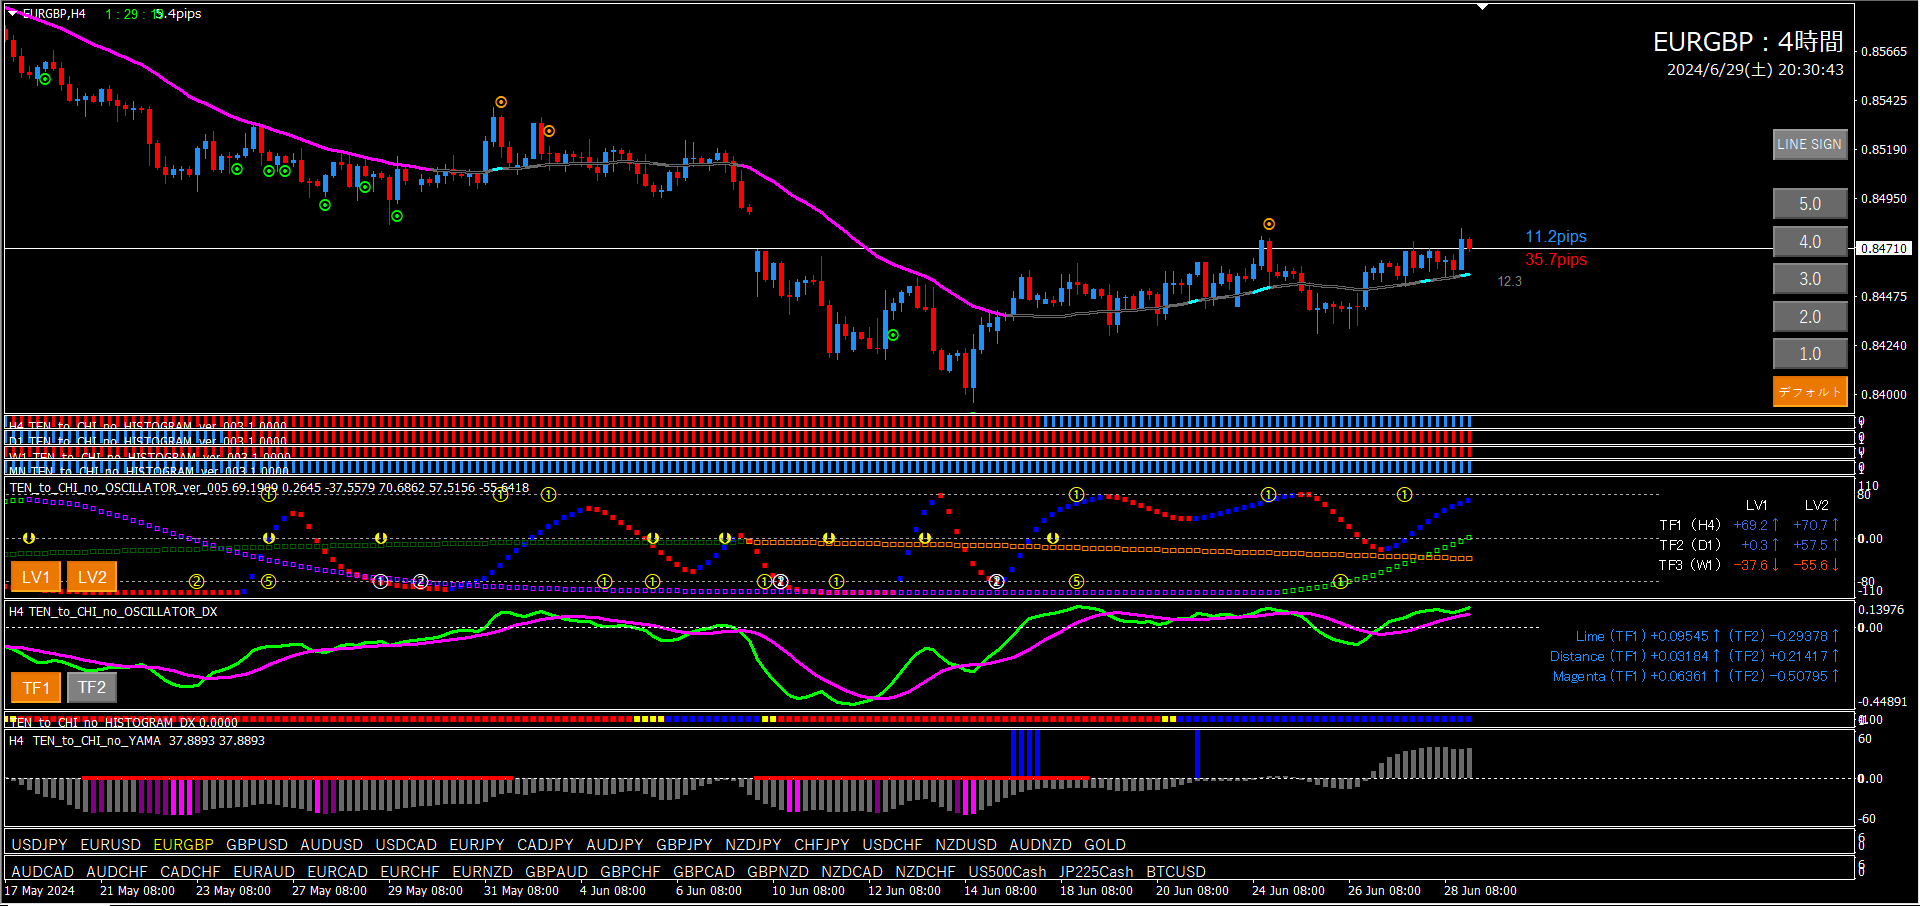
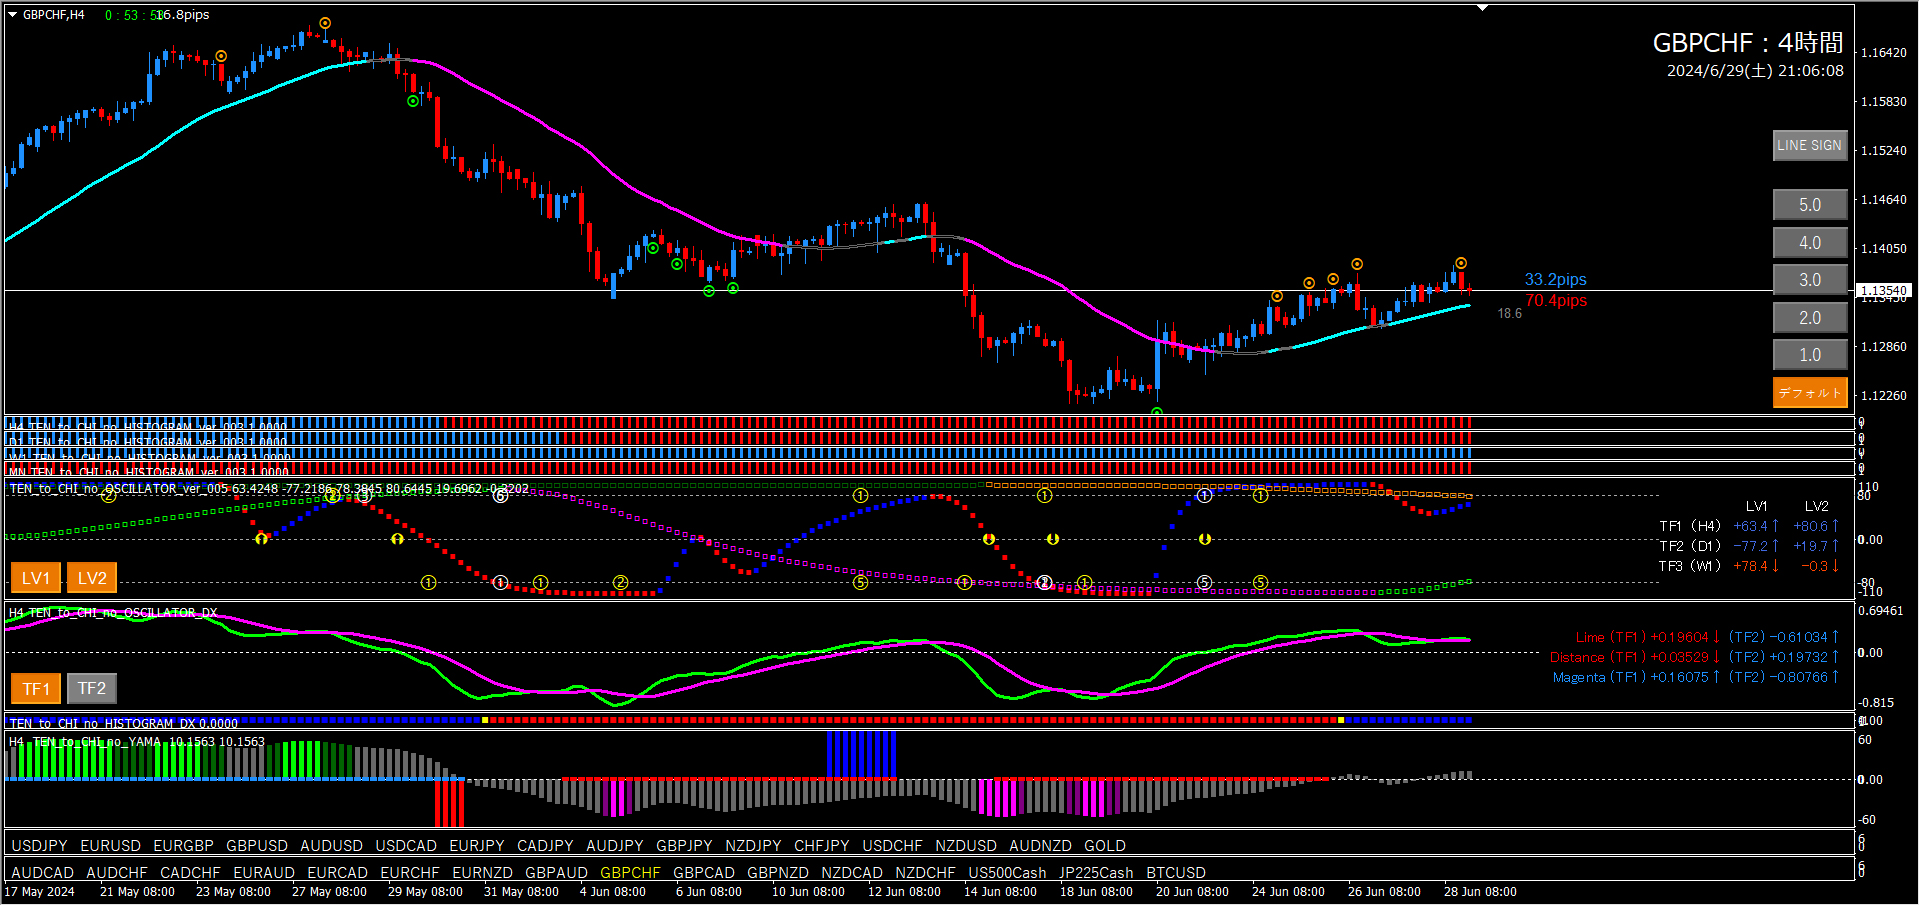
■ GBPCHF 4-hour chart (environment recognition)・GBPCHF 4-hour chart (environment recognition)
・Short entry signal lit
・Long entry signal lit up to about 70.4 pips・Short entry signal lit
・Oscillator TF2 rising, positioned at -77.2・Long entry signal lit up to about 70.4 pips
・Oscillator TF2 rising, positioned at -77.2
・Oscillator TF1 at +63.4・Oscillator TF1 at +63.4
Line-touch rebound indicates bullish. If the line is then broken downward, judge bullish from the long entry signal.Line-touch rebound indicates bullish. If the line is then broken downward, judge bullish from the long entry signal.
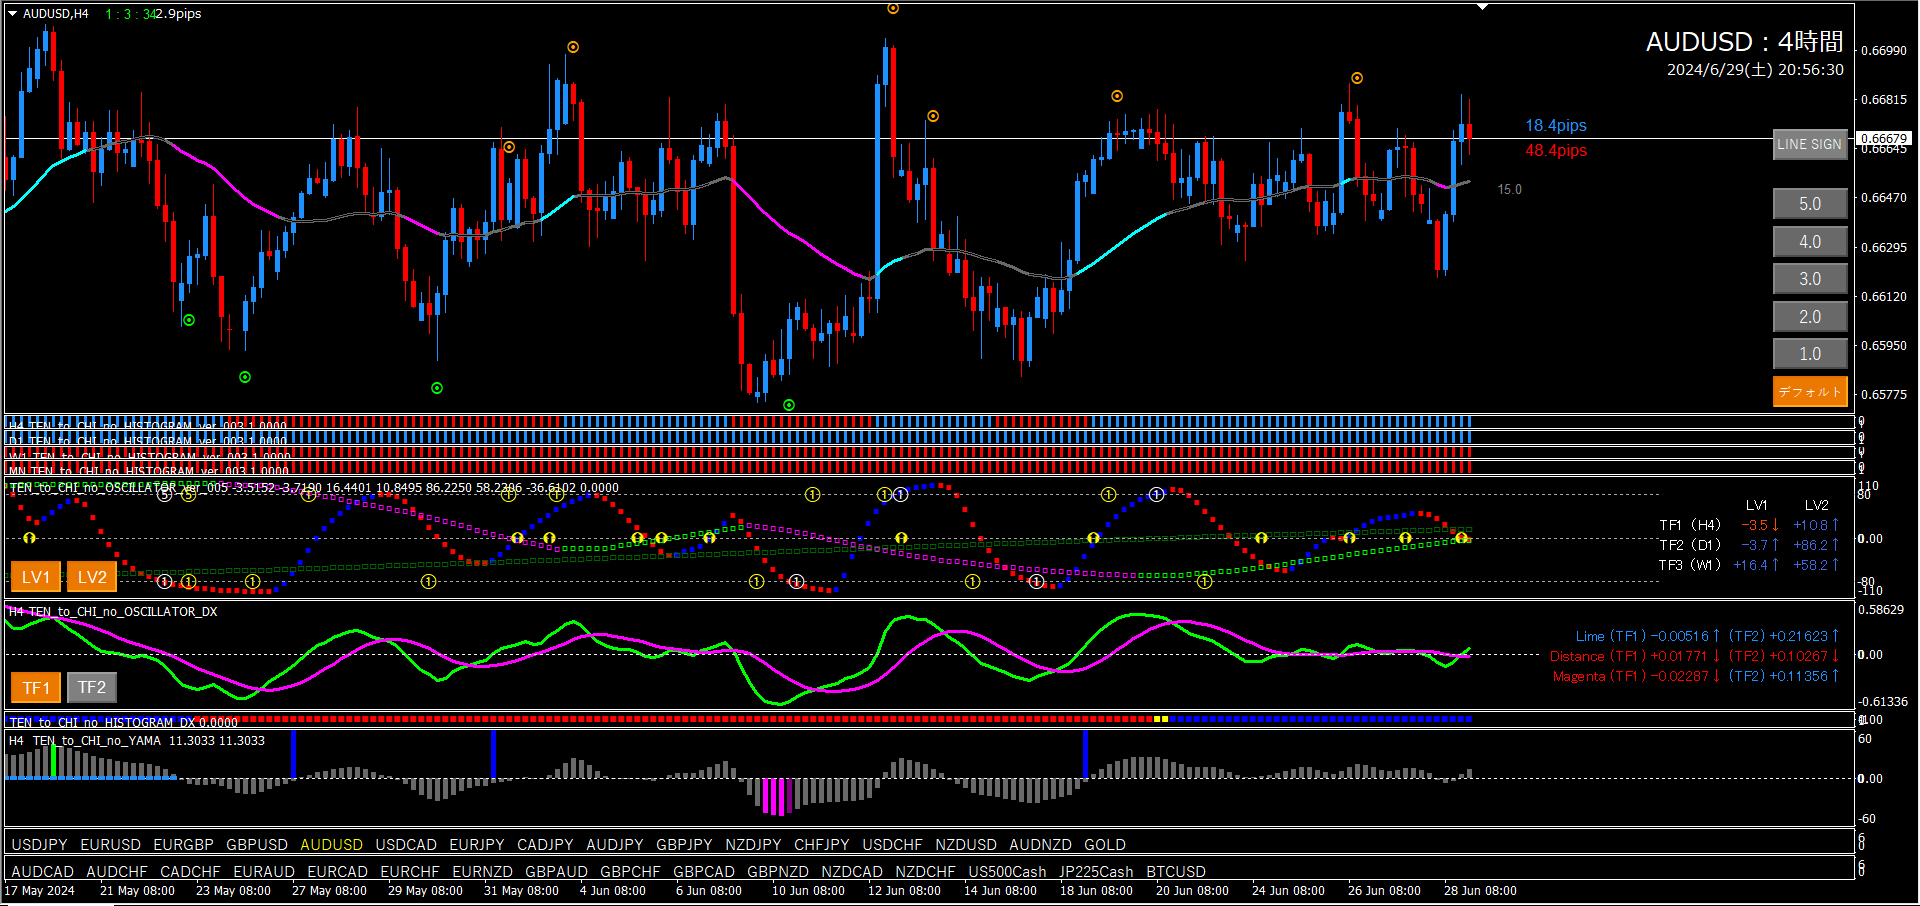
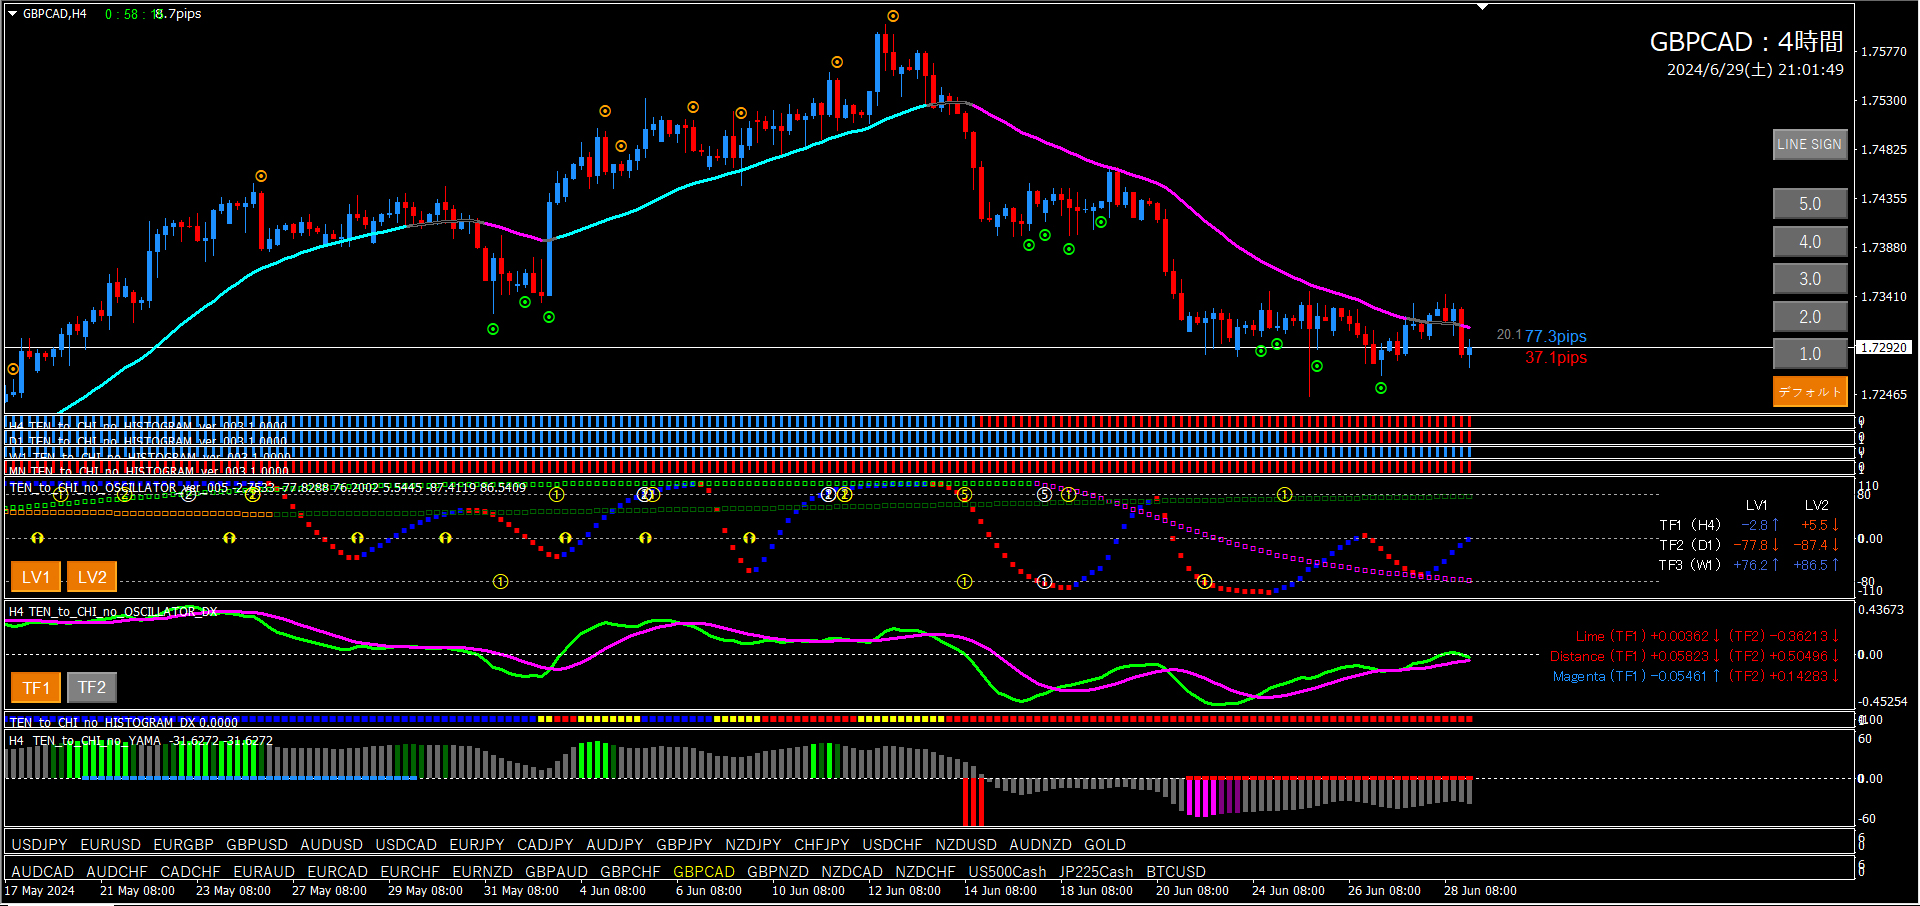
■ PONCHA 4-hour chart (environment recognition)■ PONKANA 4-hour chart (environment recognition)
・Short entry signal lit up to about 77.3 pips・Short entry signal lit up to about 77.3 pips
・Long entry signal lit up to about 37.1 pips・Long entry signal lit up to about 37.1 pips
・Oscillator TF2 declining, positioned at -77.8・Oscillator TF2 declining, positioned at -77.8
・Oscillator TF1 at -2.8・Oscillator TF1 at -2.8
Line-touch rebound indicates a downtrend. If the line breaks upward, judge bullish from the short entry signal. However, this is a scenario aimed at catching a rebound, so for now, consider a bearish outlook.Line-touch rebound indicates a downtrend. If the line breaks upward, judge bullish from the short entry signal. However, this is a scenario aimed at catching a rebound, so for now, consider a bearish outlook.
■ NZDCHF 4-hour chart (environment recognition)■ NZDCHF 4-hour chart (environment recognition)
・Short entry signal lit up to about 21 pips・Short entry signal lit up to about 21 pips
・Long entry signal lit up to about 35.6 pips・Long entry signal lit up to about 35.6 pips
・Oscillator TF2 rising, positioned at -97.3・Oscillator TF2 rising, positioned at -97.3
・Oscillator TF1 at -22.9・Oscillator TF1 at -22.9
・Histogram, Histogram DX blue・Histogram, Histogram DX blue
・Oscillator LV2 all-direction convergence signs・Valley signalOscillator LV2 all-direction convergence signs
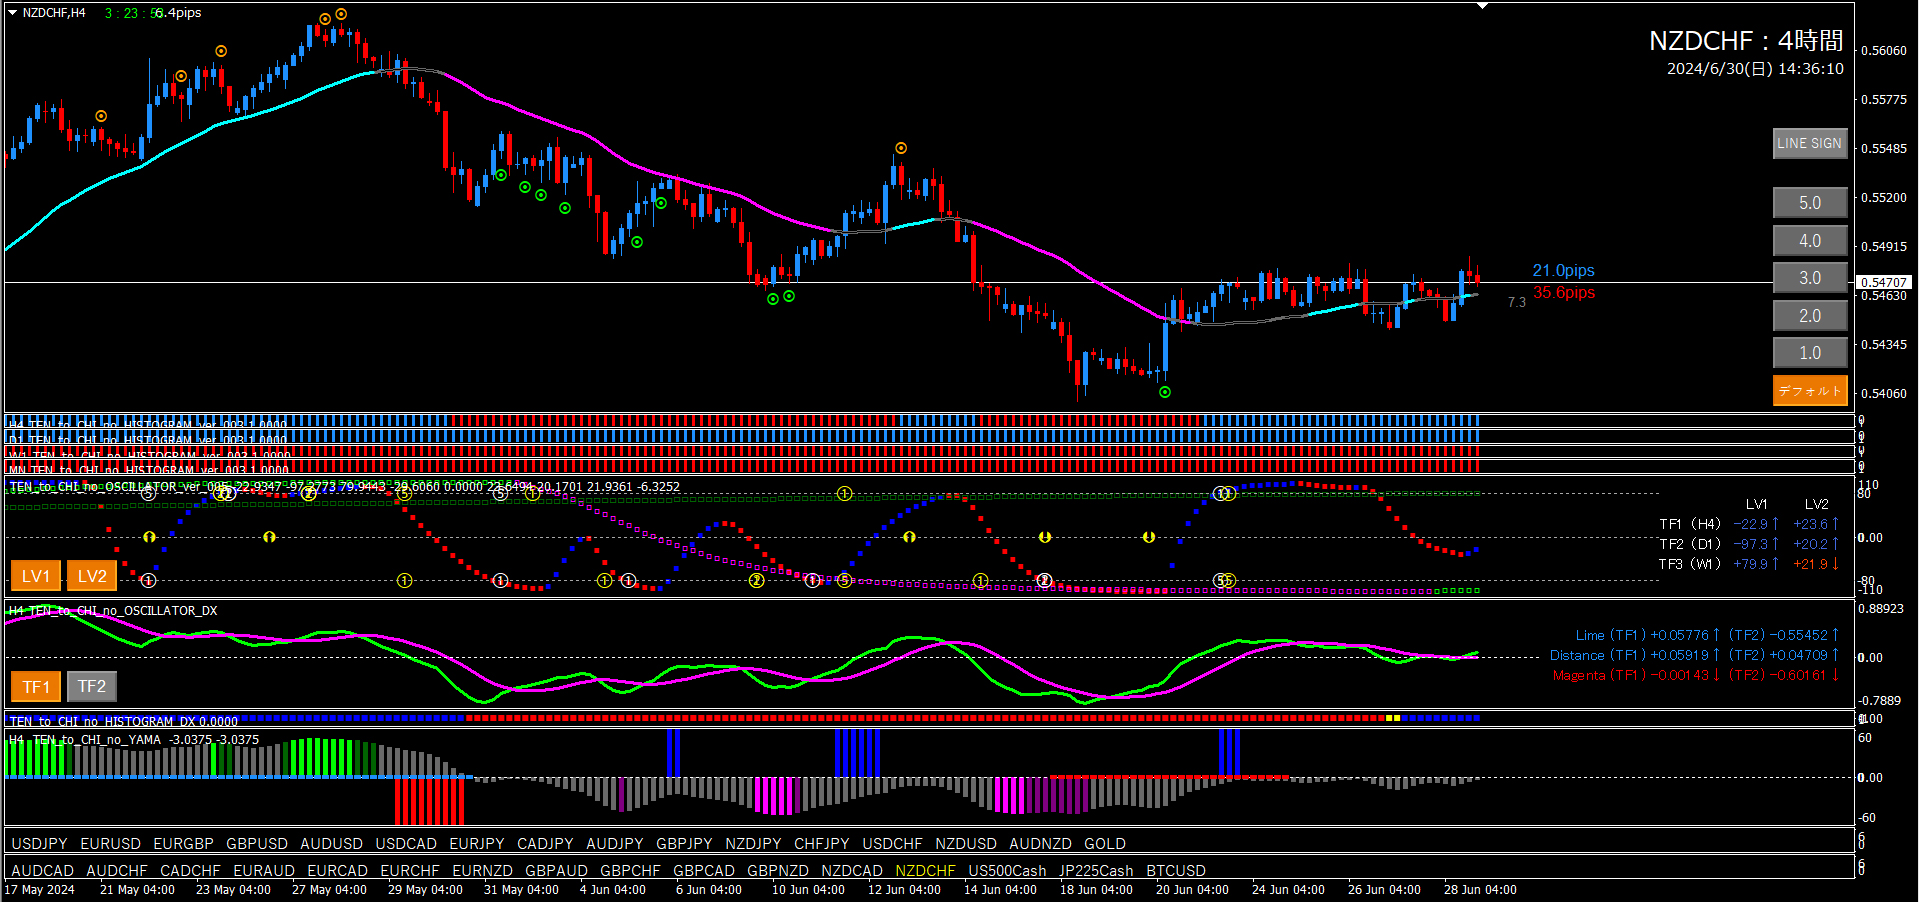
We judge a downtrend from line-break confirmation. If it rises further, judge bearish from the short entry signal. If Oscillator TF2 reverses higher, this scenario resets. By the way, Oscillator LV2 Signal ⑤ preceded just now. Signals ⑤ and ⑥ (LV1, LV2 both) are highly advantageous, but they may also trigger during trend changes. To avoid traps, watch TF1 and TF2 movements and positions closely (LV1 and LV2 if possible).■ USDCHF 4-hour chart (environment recognition)Oscillator LV2 convergence signs indicate a downtrend from line-break confirmation. If it rises, judge bullish from the short entry signal. Oscillator TF2 reversal would reset this scenario. Notably, Oscillator LV2 signal ⑤ appeared just prior. Signals ⑤ and ⑥ (LV1, LV2) are highly advantageous, but may occur during trend changes. To avoid false signals, monitor TF1 and TF2 movements and positions carefully (preferably LV1 and LV2).■ USDJPY 4-hour chart (environment recognition)・GBPCHF 4-hour chart (environment recognition)
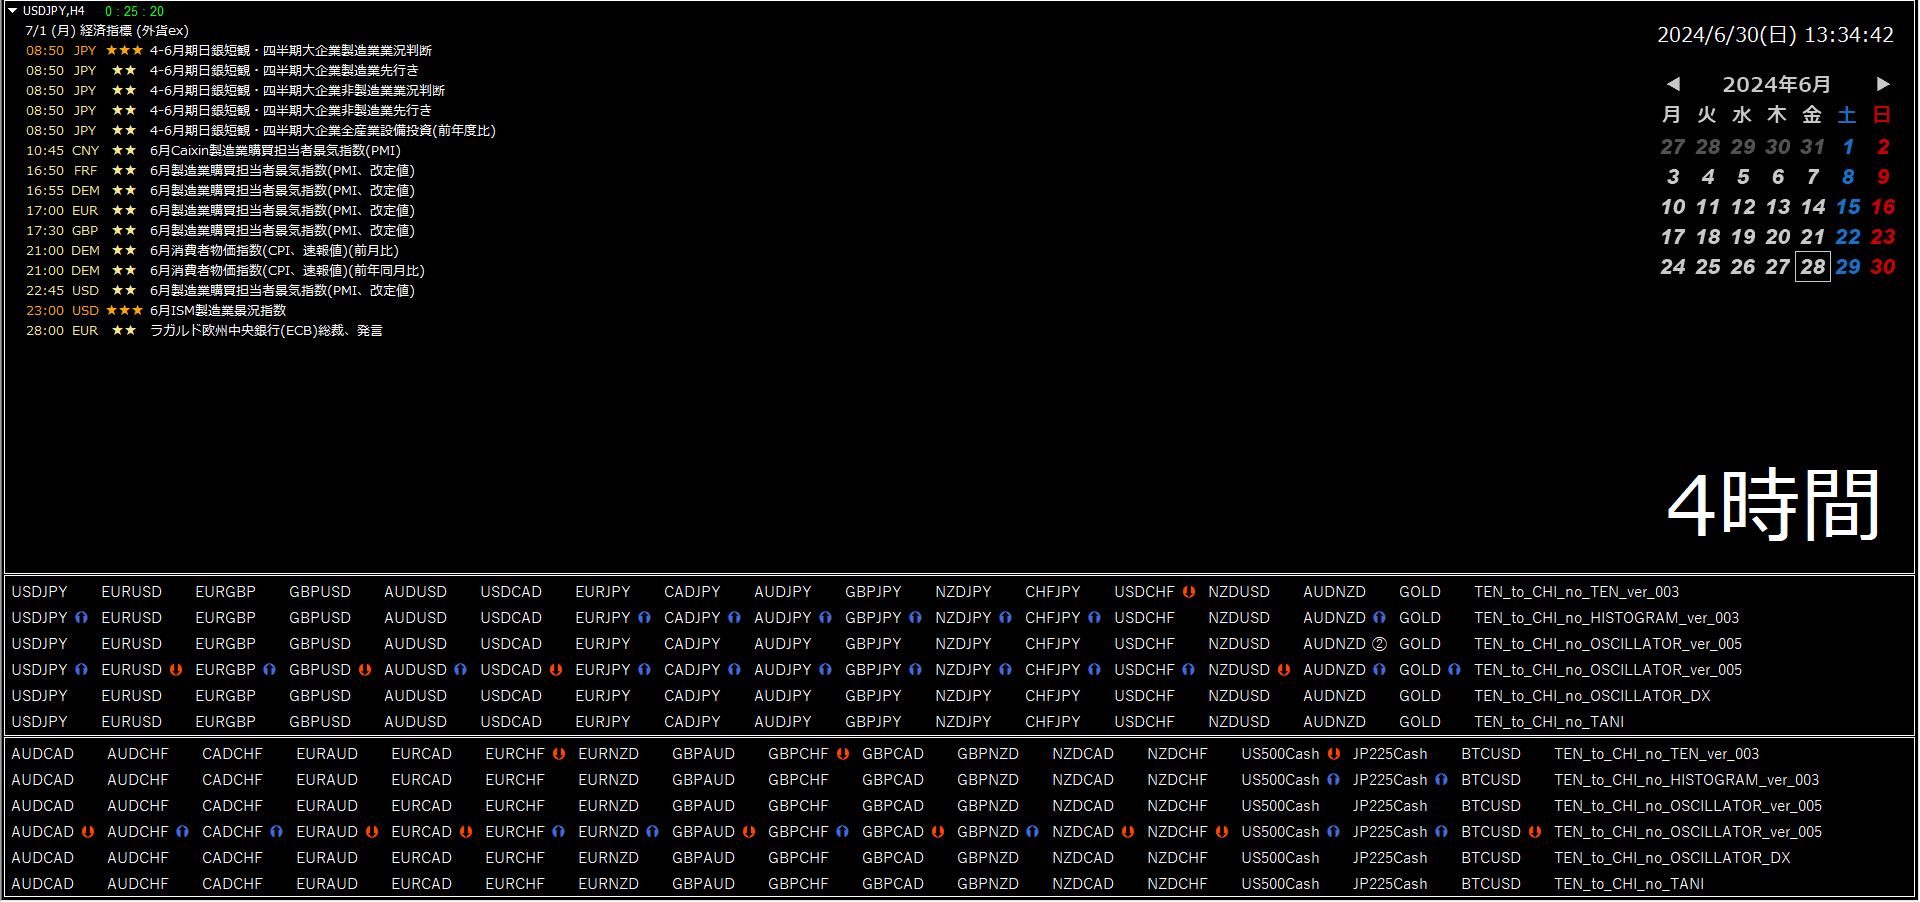
■ Current 4-hour chart Heaven and Earth Dashboard

That is all.
We hope this is of some help to everyone.
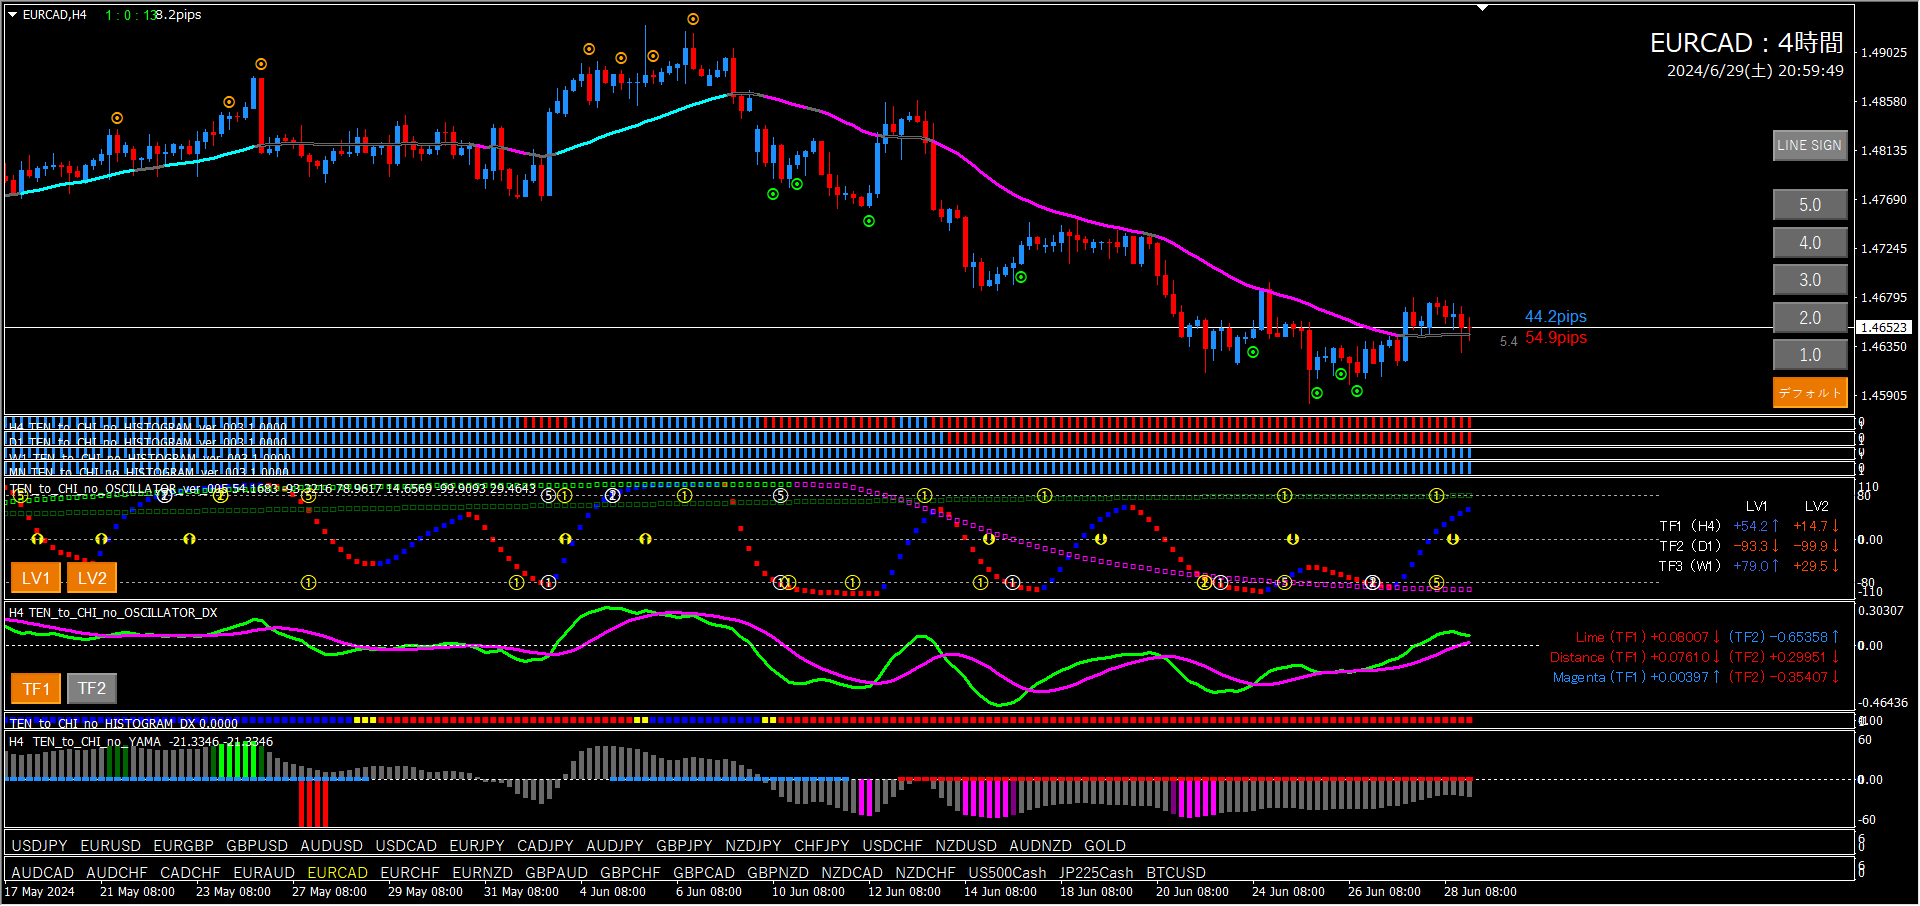
■ EURCAD 4-hour chart (environment recognition)■ GBPJPY 4-hour chart (environment recognition)Press the GOOD mark to boost our future energy. We would appreciate your cooperation for further motivation as well.
