

[Indicator] Koropokkuru Series Version Upgrade Report & Thorough Verification
Hello everyone! This is Yururi mo Yururi.
Thank you very much for visiting the article.
We have currently updated the released indicators『Koro Pocchuru ~ OsMA to Detect Early Signals』and『Koro Pocchuru ~ Do Not Miss Trend Emergence with MACD ~』Version Upgradehas been performed, so we are reporting this.
The upgrade includes minor bug fixes.
If you have downloaded, please download again from ‘My Page’.
We apologize for the inconvenience.

Thorough Verification
Together with the upgrade, we thoroughly verify whether the currently releasedtwo indicatorsarereally usable.
Before presenting the verification results, here is a brief summary of the two indicators’ features and usage.
<Features of the two indicators>
Using the two indicators allows you to grasp the signs and emergence of trend reversal.
<Usage of the two indicators>
If an upward arrow (↑) appears immediately after a top triangle (▲), it indicates the formation of an uptrend.
If a downward arrow (↓) appears immediately after a bottom triangle (▼), it indicates the formation of a downtrend.
【Environment】
Broker: OANDA JAPAN Tokyo server (oj1m)
Currency pair: [USD/JPY]
Time frame: 1 minute (M1)
Period: From ‘Monday, October 8, 2018 6:00 AM (chart shows 0:00)’ to ‘Wednesday, October 10, 2018 12:00 PM (chart shows 8:00)’
【EA Parameter Settings】
Judgment fine-tuning integer: 0 *Both indicators use the same setting.
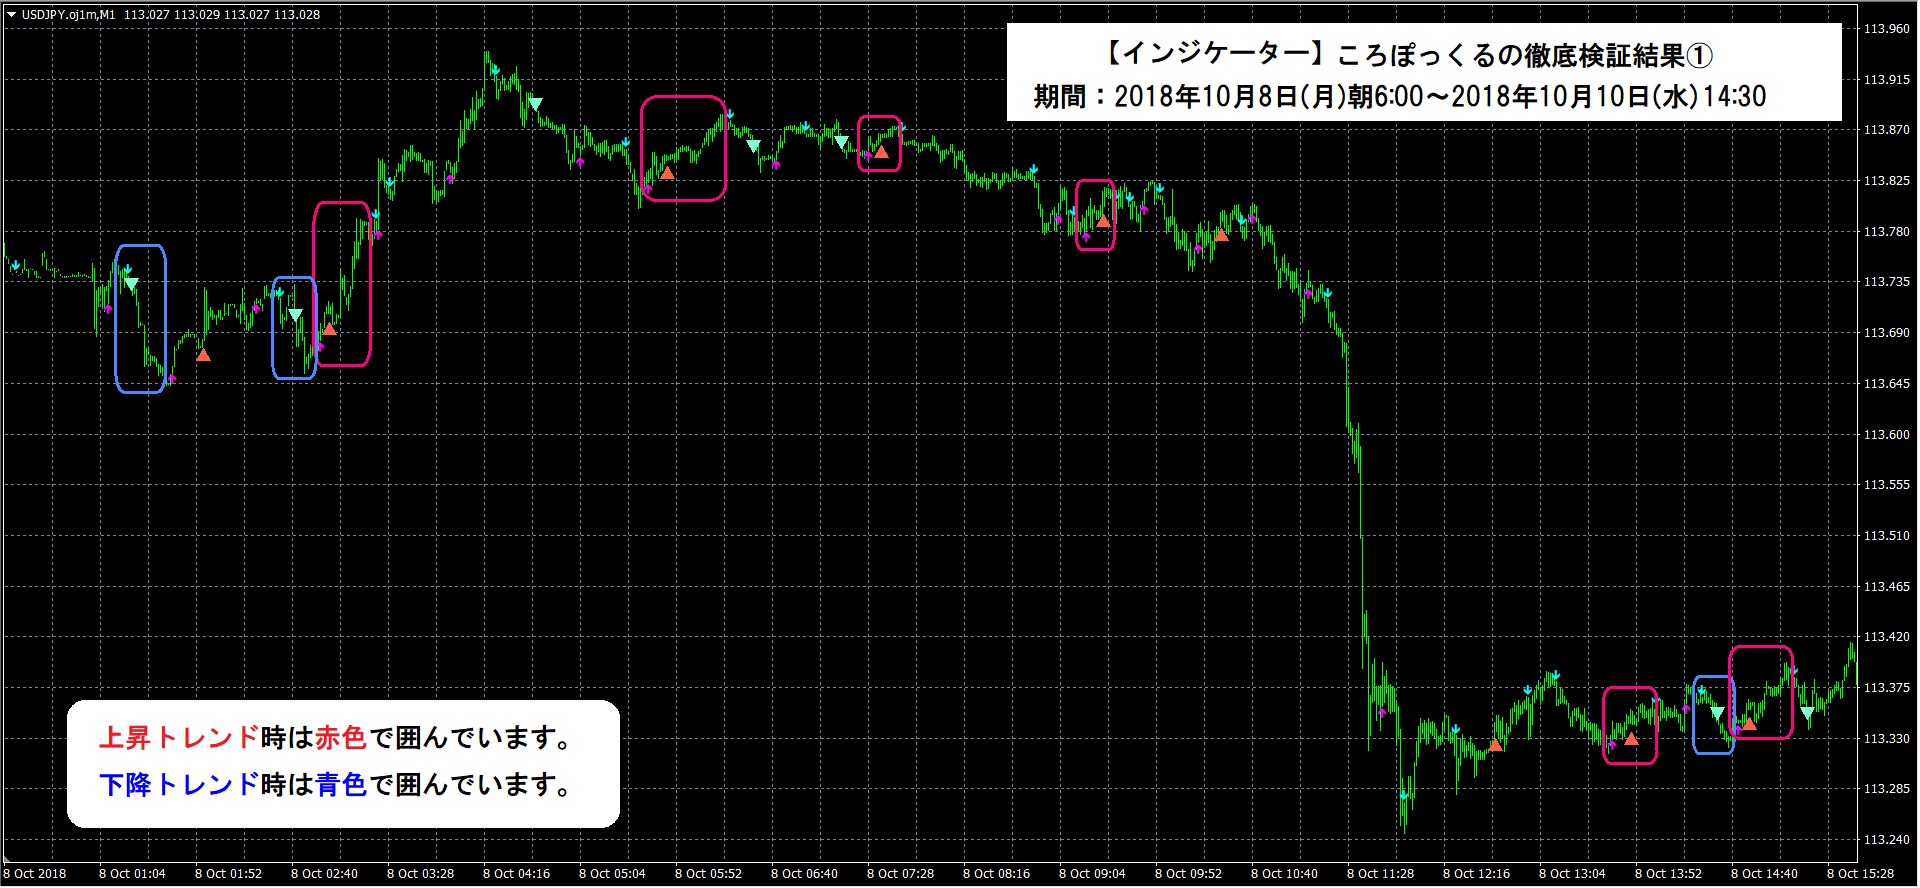
First, please take a look at the clearly visible results by the surrounded image.
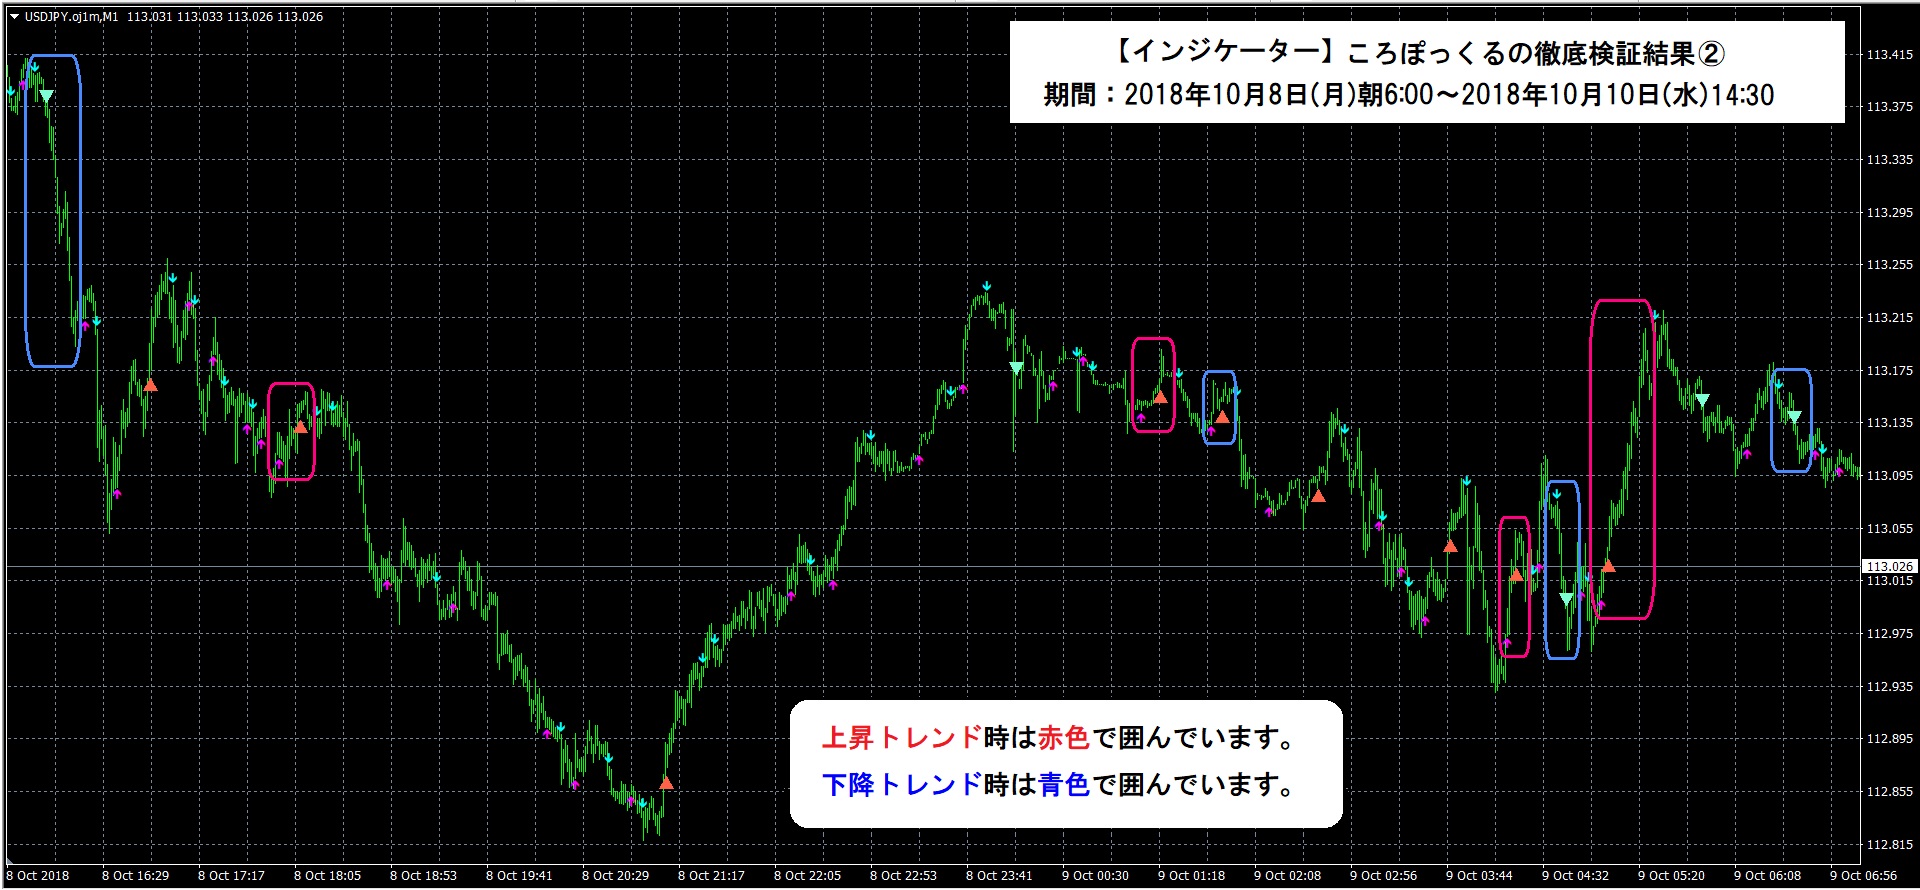
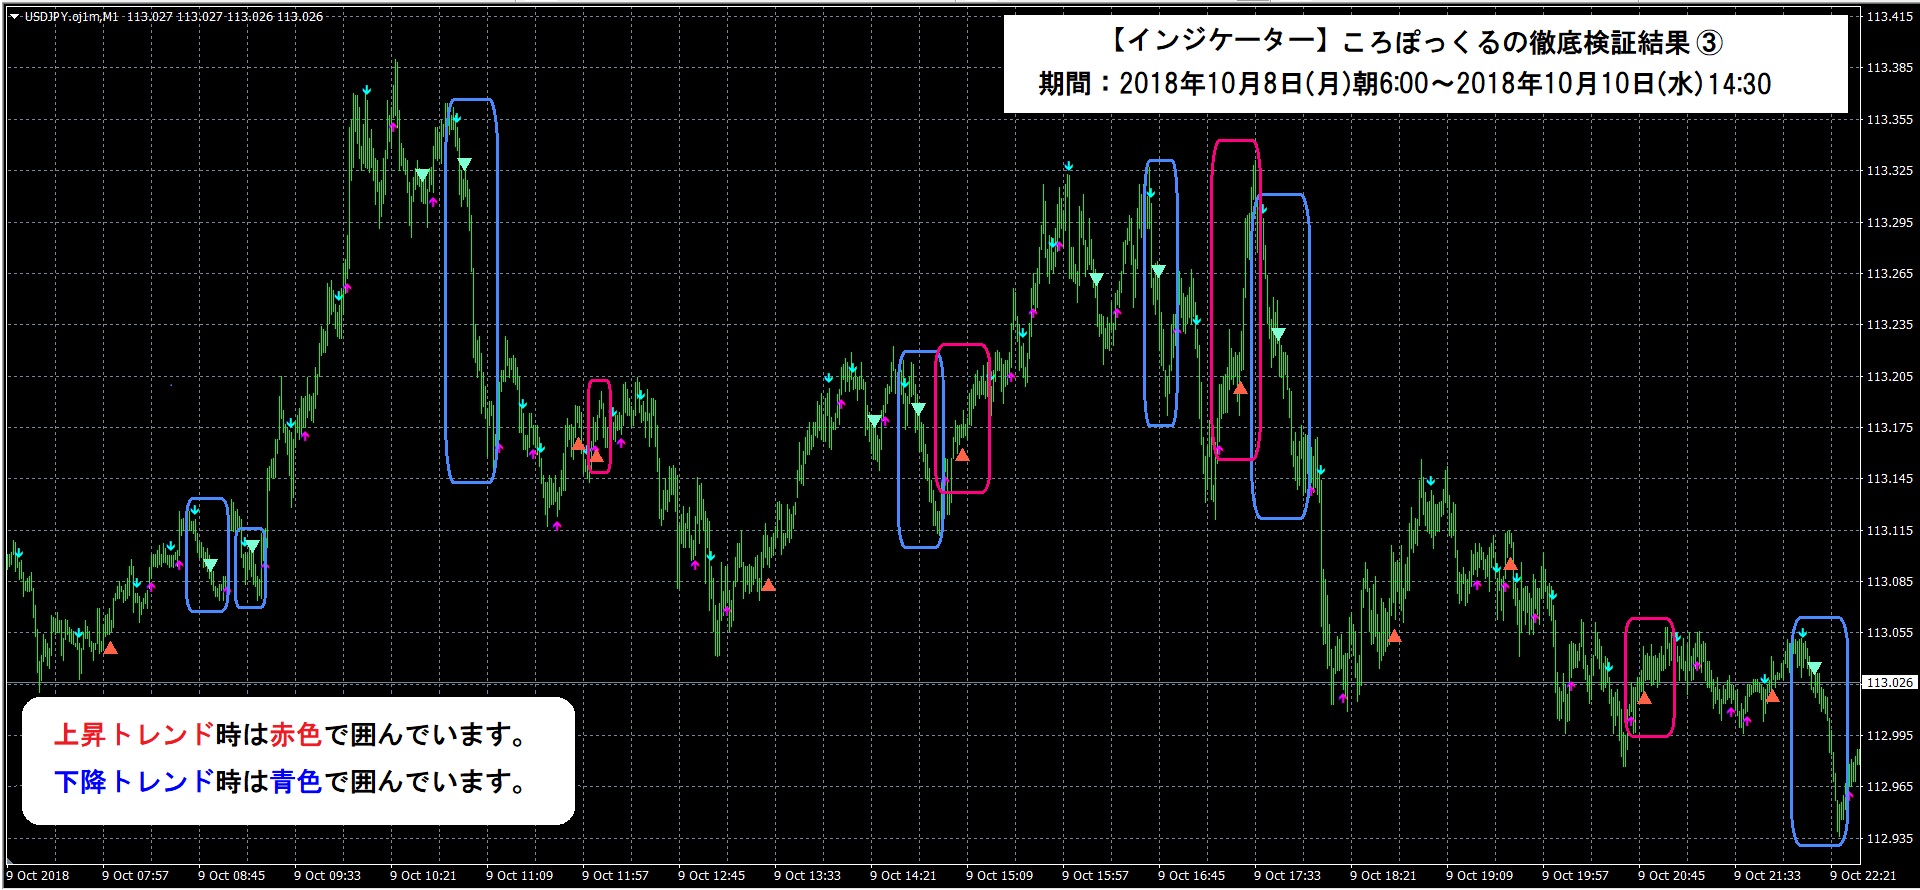
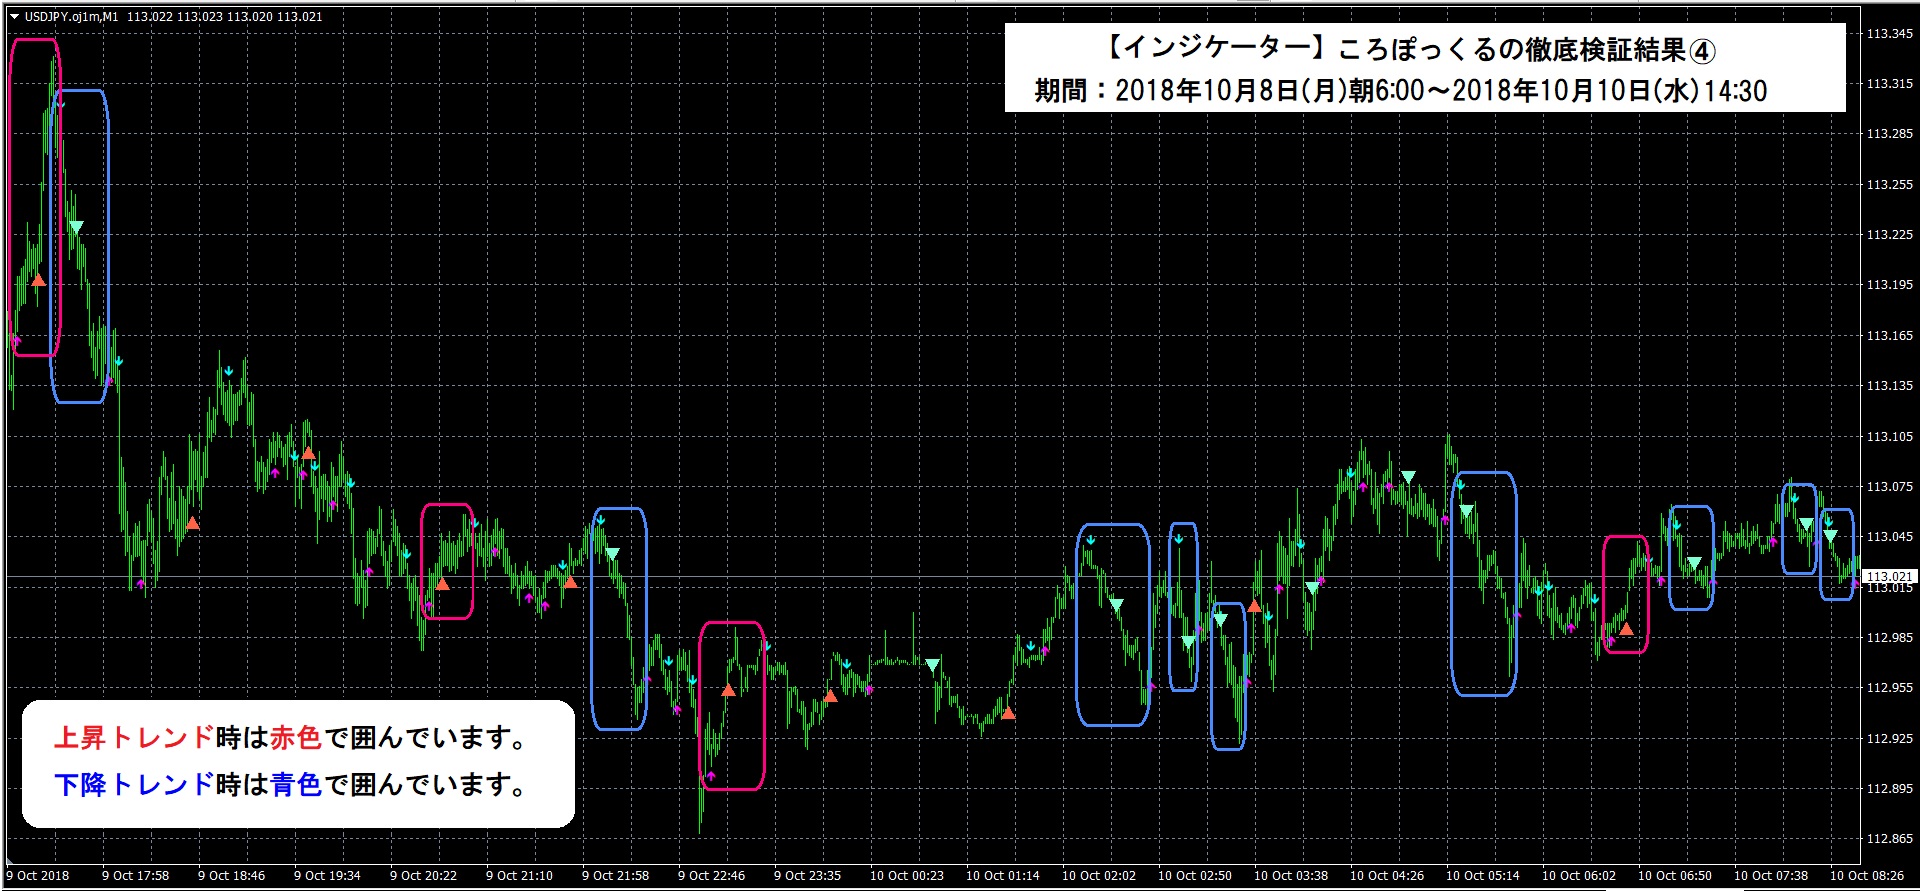
※In an uptrend, it is enclosed in red.In a downtrend, it is enclosed in blue.
<Verification Result ① 6:00 on Oct 8 to around 22:00 Oct 8>
<Verification Result ② around 22:00 Oct 8 to around 13:00 Oct 9>
<Verification Result ③ around 13:00 Oct 9 to around 5:00 Oct 10>
<Verification Result ④ around 5:00 Oct 10 to around 14:30 Oct 10>
<Verification Results>
Approximately 56 hours,upward trends appeared 17 times,downward trends appeared 23 times,a total of 40 timesthe indicators were able to detect signals and grasp the trend.
Average of 10 pipswas achieved, so ‘40 times × 10 pips = 400 pips, thusfor 0.1 lot (10,000 currency units),approximately 40,000 yenin profit.
In addition to profit analysis,we would like you to pay attention to the signals.
What this means is thatthe arrows (↑ or ↓) that indicate the anticipation of a trend reversal, followed by a triangle (▲ or ▼) showingTrend emergence,tend to indicate a high probability that a trend will occur.
Thistwo indicatorscan be used for ‘anticipation’ and ‘trend emergence’ as confirmed.
We hope you will use these verification results as reference.
We will continue to conduct verifications, and if there is another opportunity, we will report on Investor Navigation+.
...If future verification results are goodEAizationis also under consideration.
If you have any wishes such as EA化, please feel free to consult the community.
If you are at all interested, please download and try it.
Download from the links below!
・Koro Pocchuru ~ OsMA to Detect Early Signals ~
・Koro Pocchuru ~ Do Not Miss Trend Emergence with MACD ~
-------------------------------------------------
If you have any questions or concerns, not limited to improvements, feel free to contact us from the Community on the product purchase page.
We hope it will be of help to your asset management.