

【FX】I’ll teach you how to create winning trading rules
To win in trading, it is often said that “it's important to follow the rules,” but if you don’t know how to create those rules, there is no way to follow them.
Elements for winning in trading
・Capital management
【Capital Management】the concept of units
・Risk management
Manage risk with ATR!
・Trade rules with an edge
How to realize small losses and big gains in trading
In past articles, we have explained the correct way of looking at and thinking about technical analysis.
What hasn’t been mentioned yet is the assets you trade.
If you have the concept of the Turtle’s units, you can trade any asset in the same way.
So, the idea is that you can choose your favorite assets, but that would be unhelpful or, in other words, how should you choose? I will share ideas to reduce losses further.

Criteria for selecting winning assets
① Liquidity
② High volatility
③ Ability to short sell
① refers to active buying and selling. You can buy when you want to buy because there are people willing to sell. If there is no liquidity, prices slide unfavorably.
② refers to the magnitude of price movement. No matter how skilled you are at trading, if prices don’t move, you can’t realize profits.
Regarding ① and ②, besides the asset itself, time of day can be considered. During times or days when there are few market participants, liquidity and volatility tend to be lower, spreads widen, and trading costs increase, so avoid trading at those times.
③ to avoid missing profit opportunities. Shorting can target large price swings in a collapse market over a shorter period.
Another consideration is tax-loss harvesting (netting gains and losses).
Rules for stable yearly profits
・Trade multiple assets on a longer time frame
・Concentrate trades on a few assets on a shorter time frame to increase the number of trades
These two points are highlights. Should you increase the number of assets you trade or increase the number of trades by using leverage?
If you narrow down to a single asset, you don’t need to worry about tax-loss harvesting.
For example, if you trade on daily charts and the chosen asset doesn’t move for about six months, that’s possible.
As a diversification strategy, you trade multiple assets, but you must be careful not to have tax disadvantages.
For example, if you earn 1,000,000 yen in stocks and lose 1,000,000 yen in FX, since they are not in the same group, you cannot offset gains and losses, and you’ll pay taxes on the profits.
Therefore, it’s better to trade within the same group.
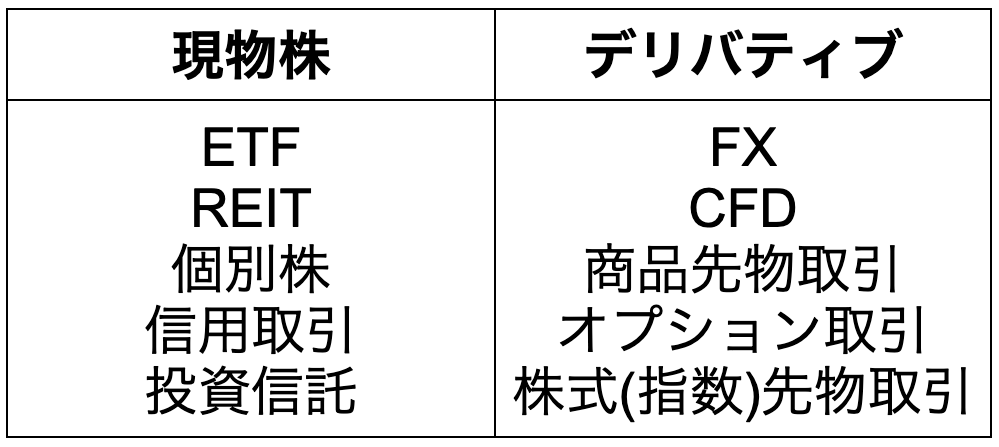
【In-Stock Group】
【Derivatives Group】
By the way, derivatives are financial derivatives.
CFD stands for Contract for Difference. FX is part of CFDs.
Once you decide the asset to trade, you finally create the trading rules.
Trend-following styles tend to lead to larger profits.
Some people think any method that wins is fine, but methods with reproducibility and measurable expected value allow you to trade with confidence.
The basic stance is to,
・Trade both long and short
・Cut losses normally, take profits when prices move significantly
・Avoid bankruptcy after temporary losing streaks
Analyze the current situation using technical indicators
・Buy when there is an edge to buy, and hold until the uptrend ends
・Sell when there is an edge to sell, and hold until the downtrend ends

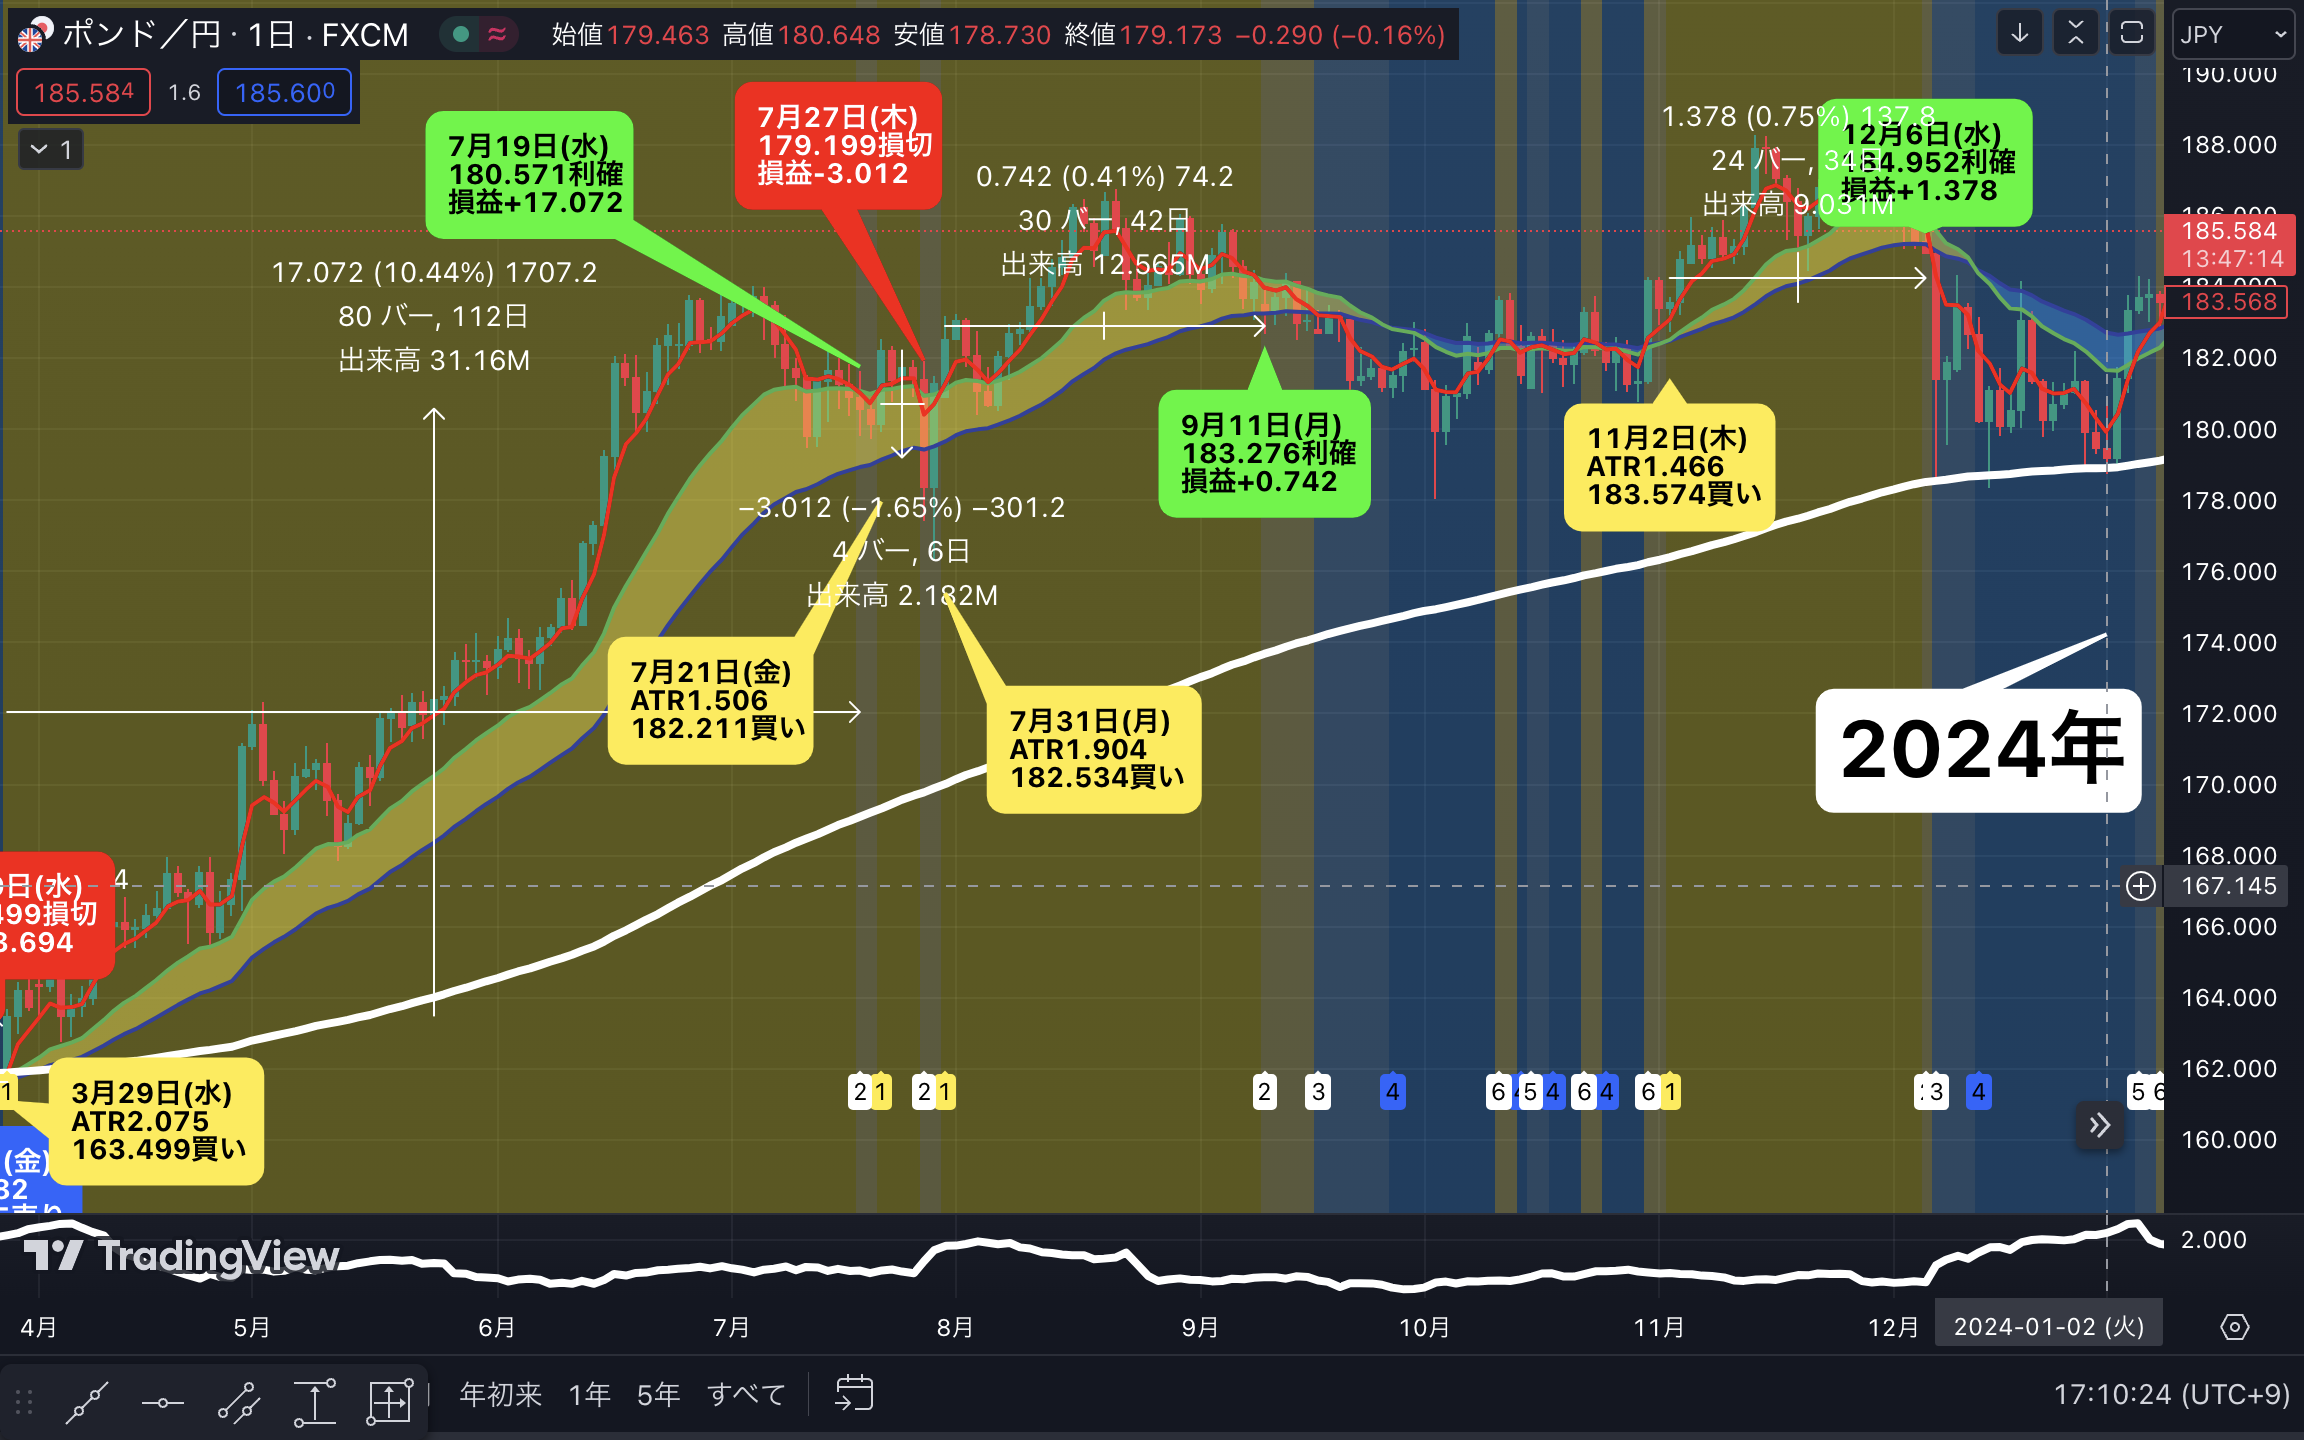
【Market】Where should you place the stop-loss line?
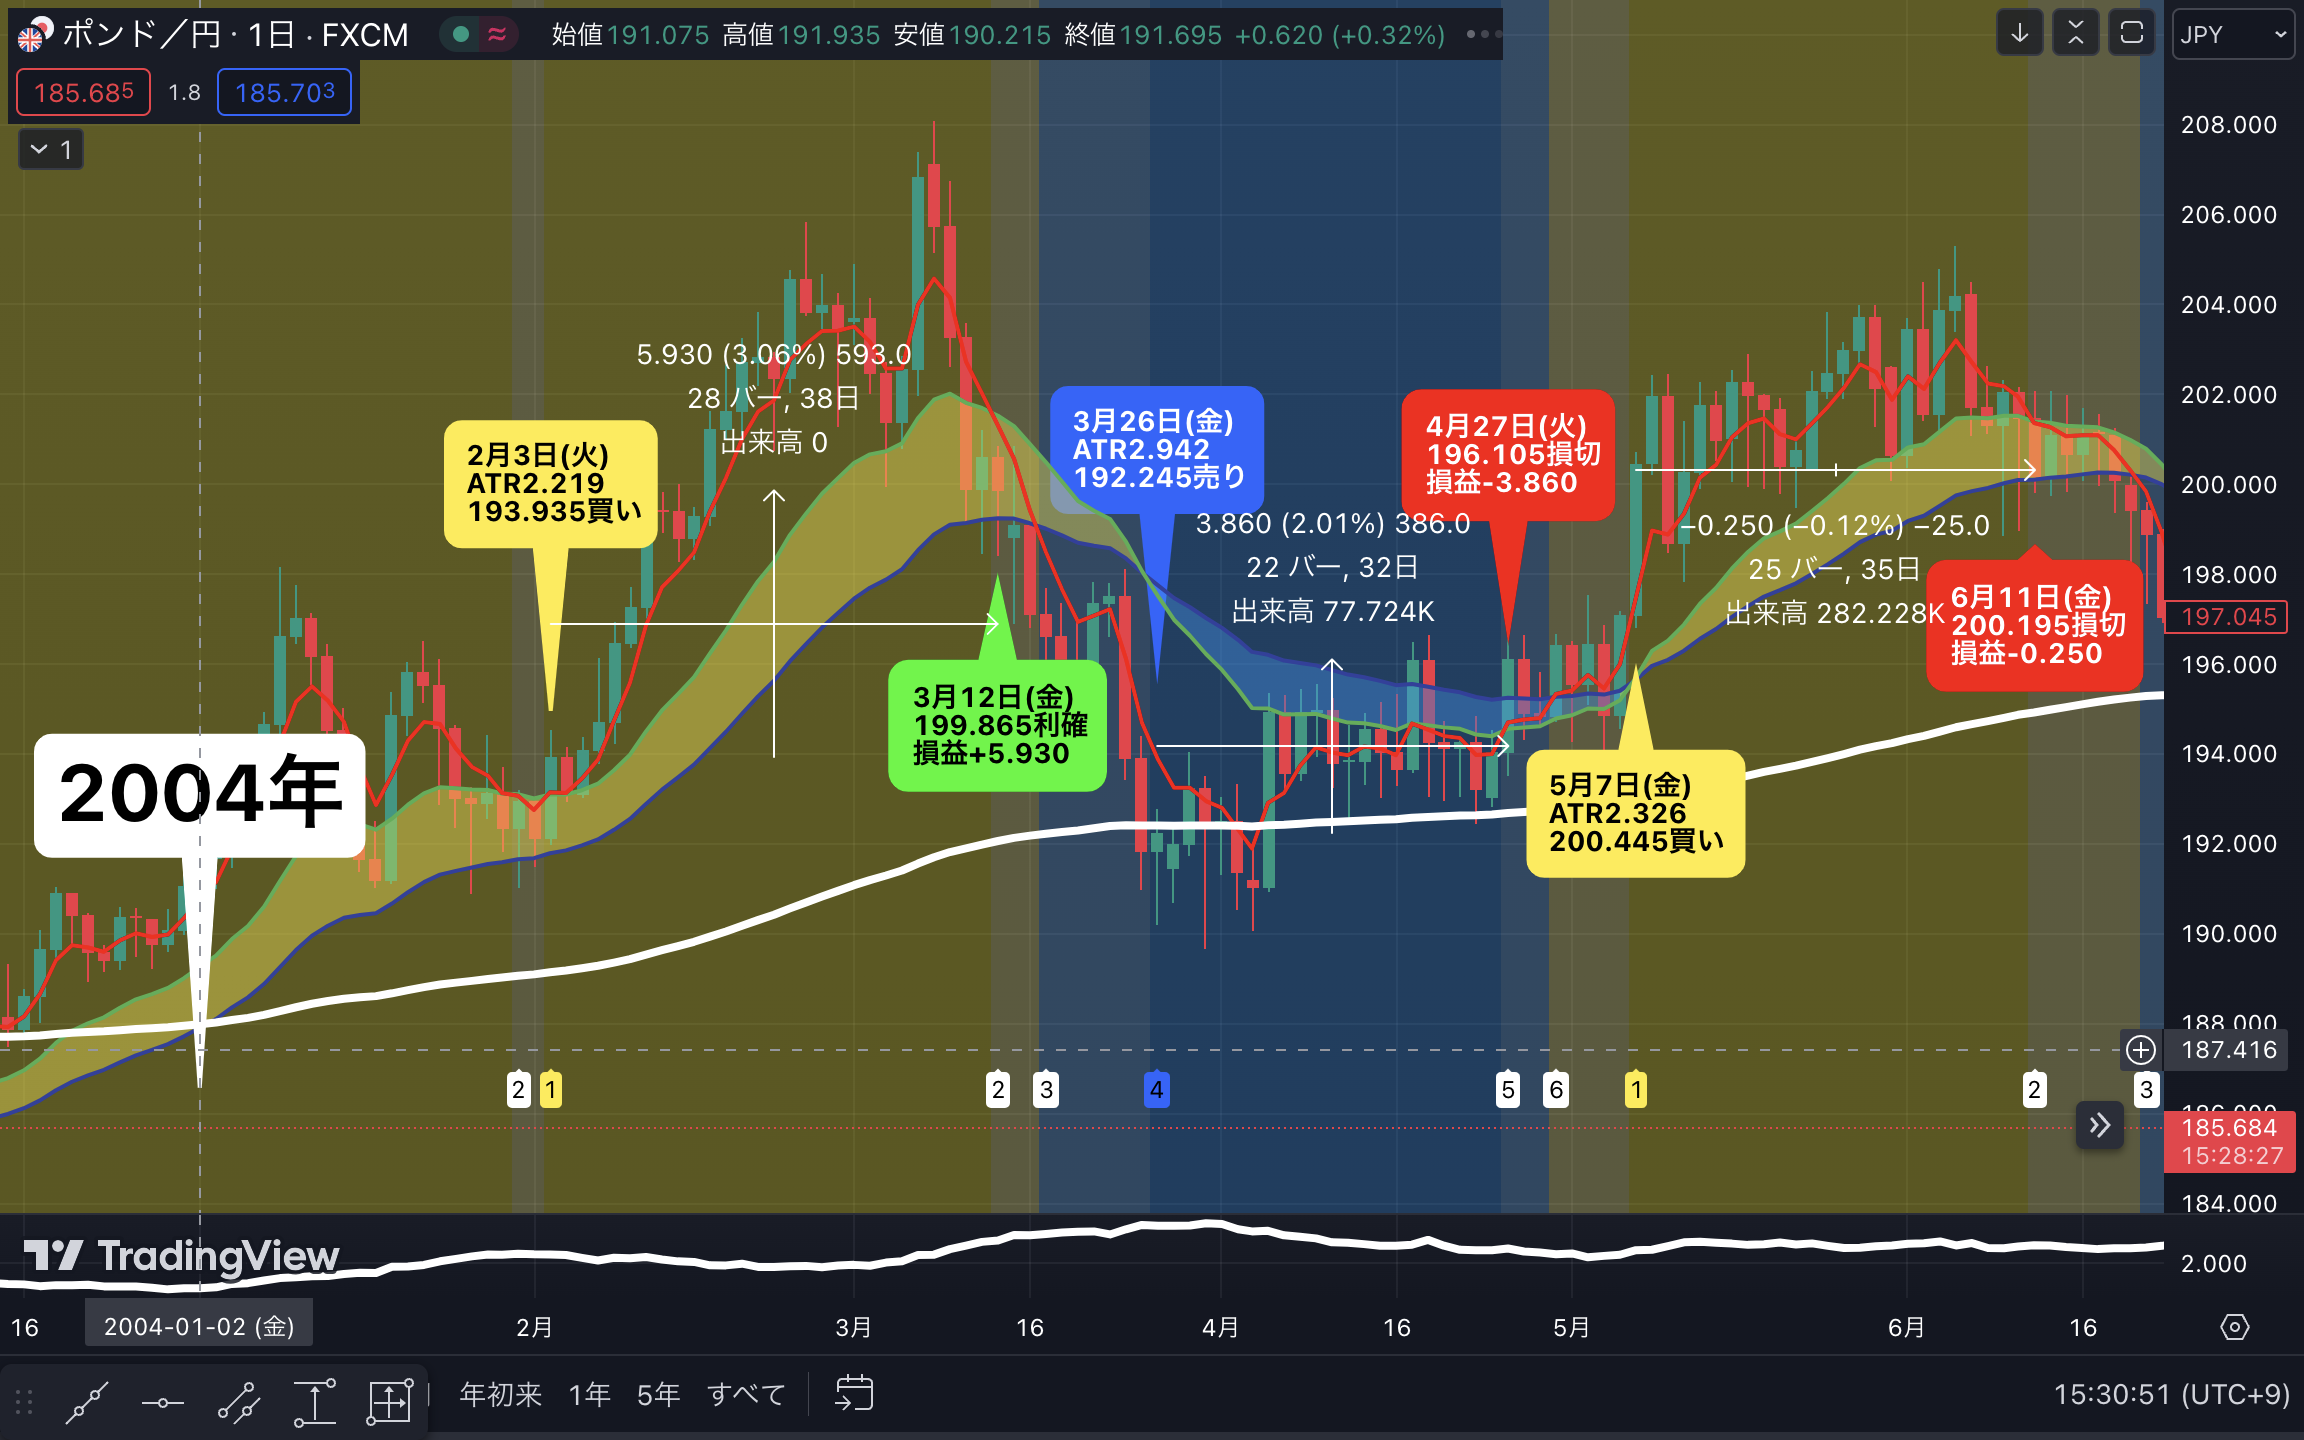
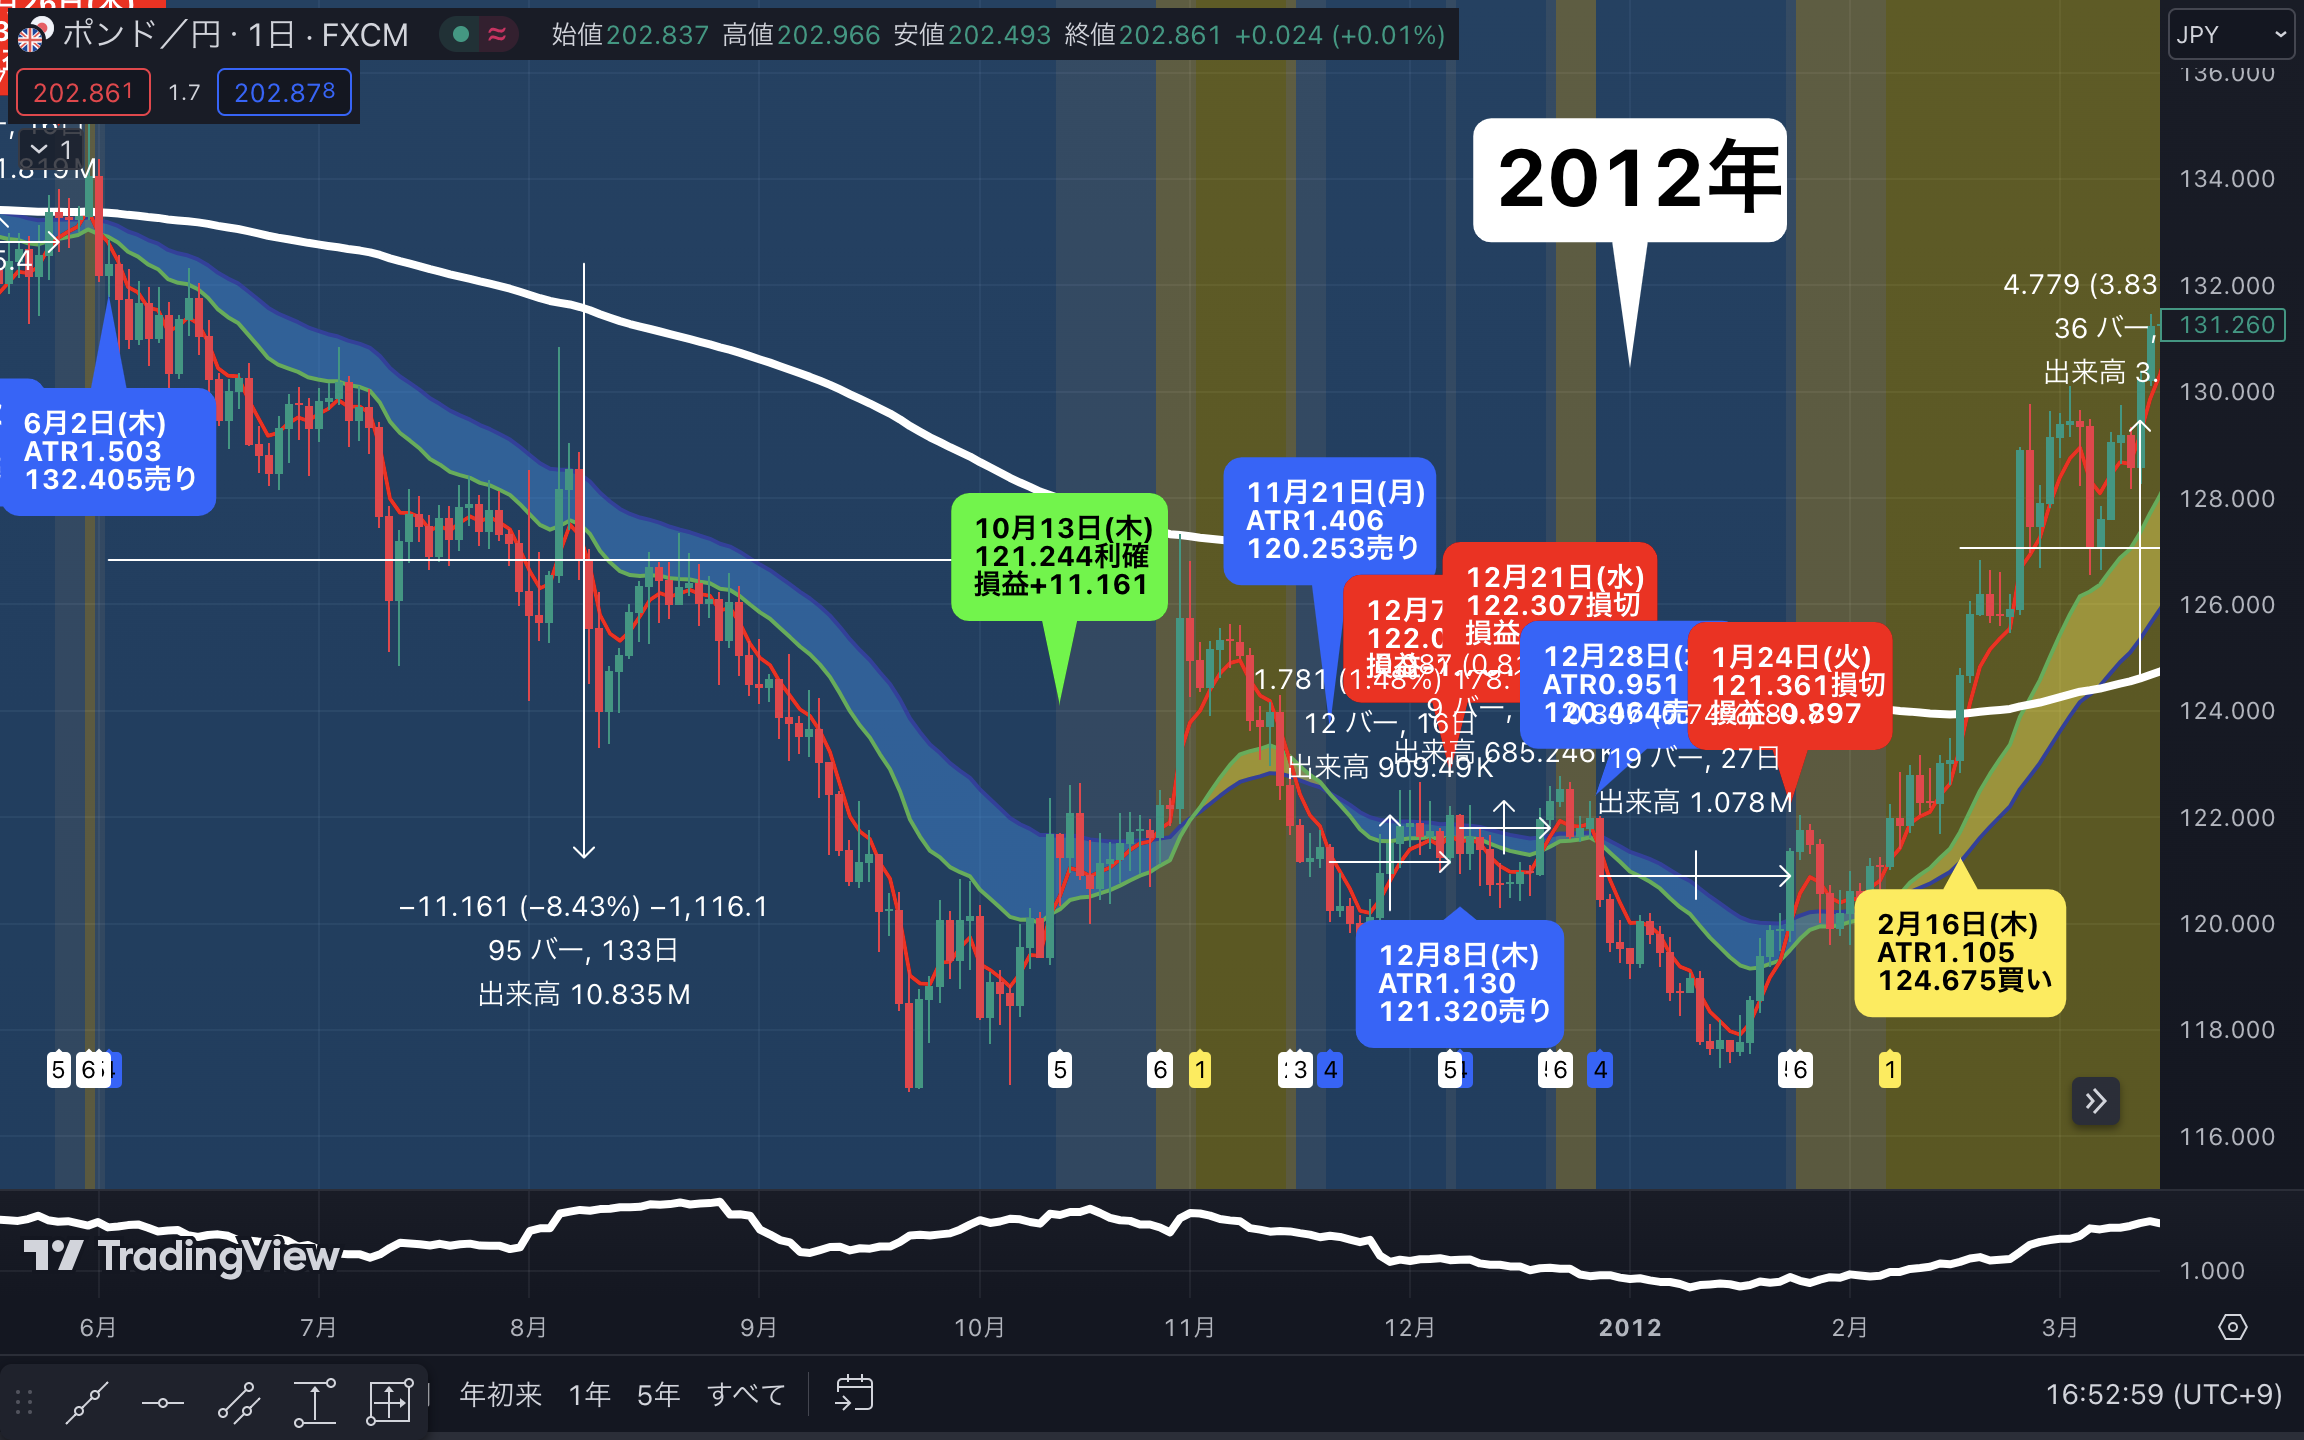
Based on the Turtle approach, stop-loss is 2 ATR
We have published historical validation data for these ideas, so please refer to that.
I will validate the past for you “Past 20 years of trading rule validation”
In plain terms, the above rules mean
When the daily candle’s close is above the 200 EMA
・Buy when 5EMA > 20EMA > 40EMA
・Close the position when 20EMA > 5EMA > 40EMA
・Stop-loss at buy price − 2 ATR
When the daily candle’s close is below the 200 EMA
・Sell when 5EMA < 20EMA < 40EMA
・Close the position when 20EMA < 5EMA < 40EMA
・Stop-loss at sell price + 2 ATR
About using three moving averages
The mindset behind this trading rule is
・First roughly separate whether it is an uptrend or downtrend with 200 EMA
・When moving averages align from top to bottom in short, medium, long terms, there is a strong possibility of a large uptrend. The same goes for the opposite
・Use ATR for capital management and risk management, and design rules that can be applied to other financial instruments
The publicly available past validation data are daily charts, but since ATR is used to set lot sizes and stop-loss ranges, it can also be applied to higher timeframes such as hourly charts.
For 20 years of daily data, about 5,000 candles (5 days × 52 weeks × 20 years)
1 year of hourly data is about 6,000 candles (24 hours × 5 days × 52 weeks)
I trade normally assuming that daily data can be converted to hourly and still work well.
Cautions for shorter time frames include
・The spread percentage relative to volatility tends to be higher
・Orders are filled at close prices, so entries may occur during times when you are asleep
While the application is effective, in actual trading it may not follow the data exactly.
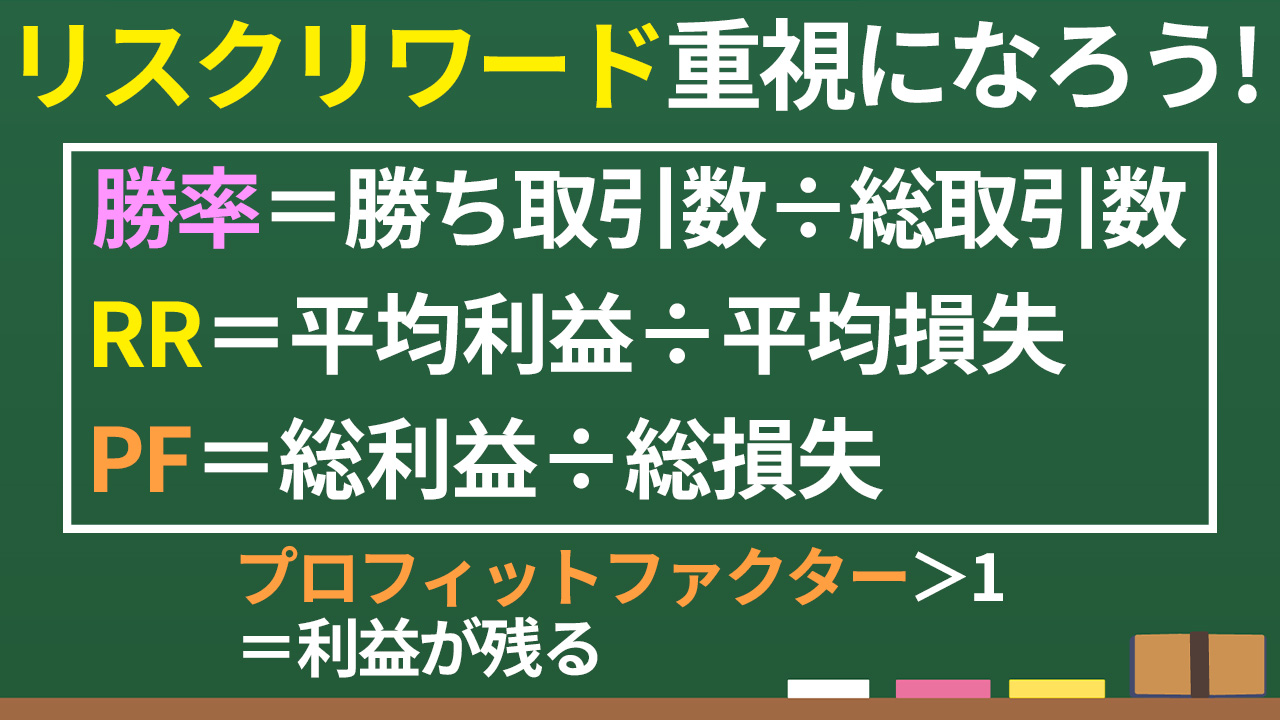
After you’ve accumulated a certain number of trades with the created rules, check win rate, RR, and PF, look for room for improvement, and brush up the rules.
People trading multiple assets should examine correlations and ensure proper diversification.
I don’t think there are other articles that explain how to create trading rules this thoroughly.
Using this article as a reference, clarify your investment capital and create trading rules that fit your personality and lifestyle!

【Number Display】 Idō Sign Tool “Display Stage Changes of Moving Average Analysis by Numbers”