

Single-position high-frequency trading yields an annual return of at least 50%! "YURAGI AUDNZD"
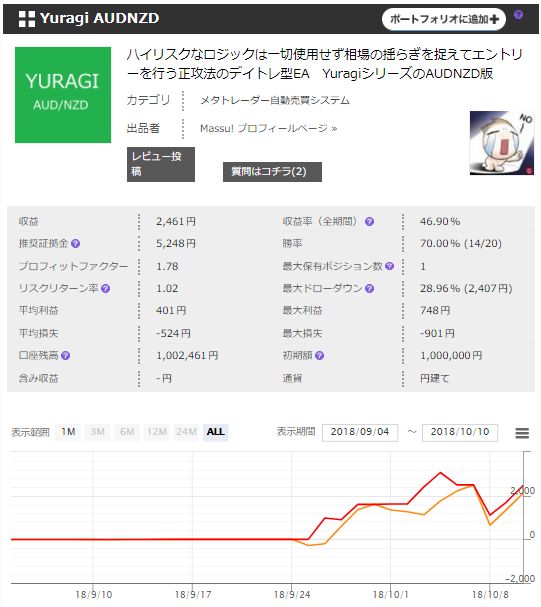
【YURAGI AUDNZD Overview】
Currency pair:[AUD/NZD]
Trading style:[Scalping][Day Trading]
Maximum number of positions:1
Timeframe used:M15
Maximum Stop Loss:100
Take Profit:Taken by internal logic
■Overview
This is the AUDNZD version of the Yuragi series.
A day-trading EA that enters by capturing market fluctuations.
It operates with a single position, but the entry frequency is high, and it steadily builds profits over the long term by repeatedly taking profits and stopping losses.
The robust core logic that works reliably for other currency pairs has been optimized for AUDNZD to achieve its maximum performance.
■Entry time
Entries occur from 22:00 to 08:00 Japan time (during daylight saving time, 21:00–07:00).
■Recommended brokers
To maximize performance, we recommend ECN brokers with an average spread of 2 pips or less.
The maximum spread at which this EA can be profitable is 4 pips (exceeding 4 pips makes it tough)
■Backtest Analysis
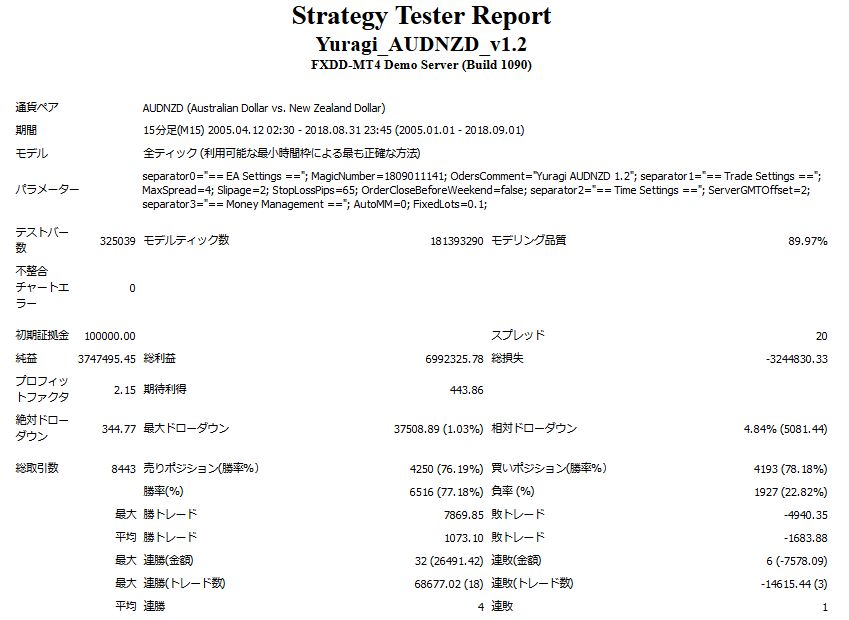
2005.04.12-2018.08.31
0.1 lot fixed
Spread 2.0
Net profit +3,740,000 JPY
Maximum Drawdown -37,500 JPY
Total trades 8,443 (annual average ~600)
Win rate 77%
Average profit 1,073 JPY (10 pips)
Average loss -1,683 JPY (-16 pips)
This is how it turned out.
With a single 0.1 lot position and a maximum drawdown under 40,000 yen,
the annual average profit is 280,000 yen, indicating a high profitability!
Since you can start from around 100,000 yen per 0.1 lot, the average return rate is over 280%?!
That is the conclusion.
(The margin for 0.1 lot AUDUSD is about 33,000 yen)
Now let's perform a detailed year-by-year analysis
【Annual P/L】
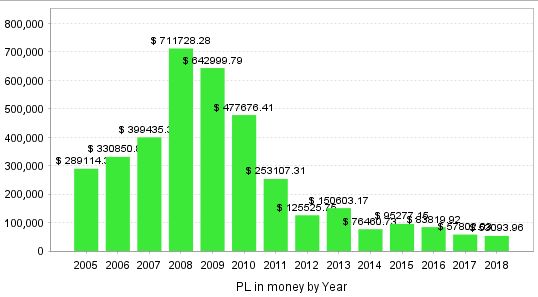
Profits before 2010 were enormous...
In the last five years, about 50,000–150,000 yen per year, but the profitability remains good!
Considering the max drawdown is 40,000 yen and the low drawdown, you can increase the lot size; annual returns of 50%–100% seem possible.
【Monthly P/L】
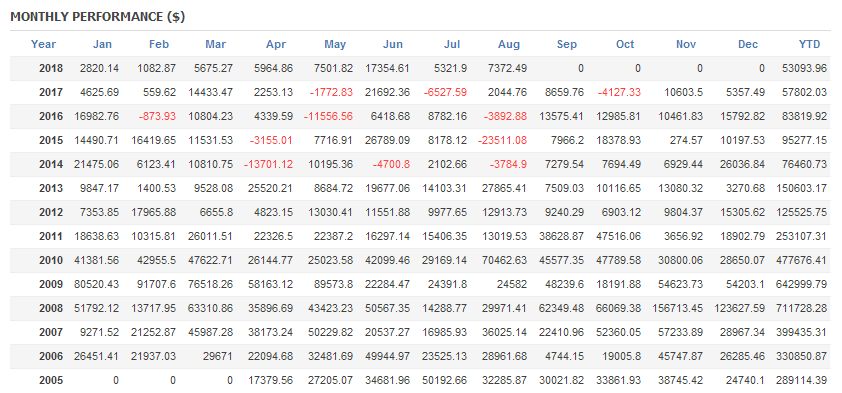
Month-to-month losses are very few!
August has been negative for three consecutive years in some periods, but looking at the year as a whole, negative months are only up to about three.
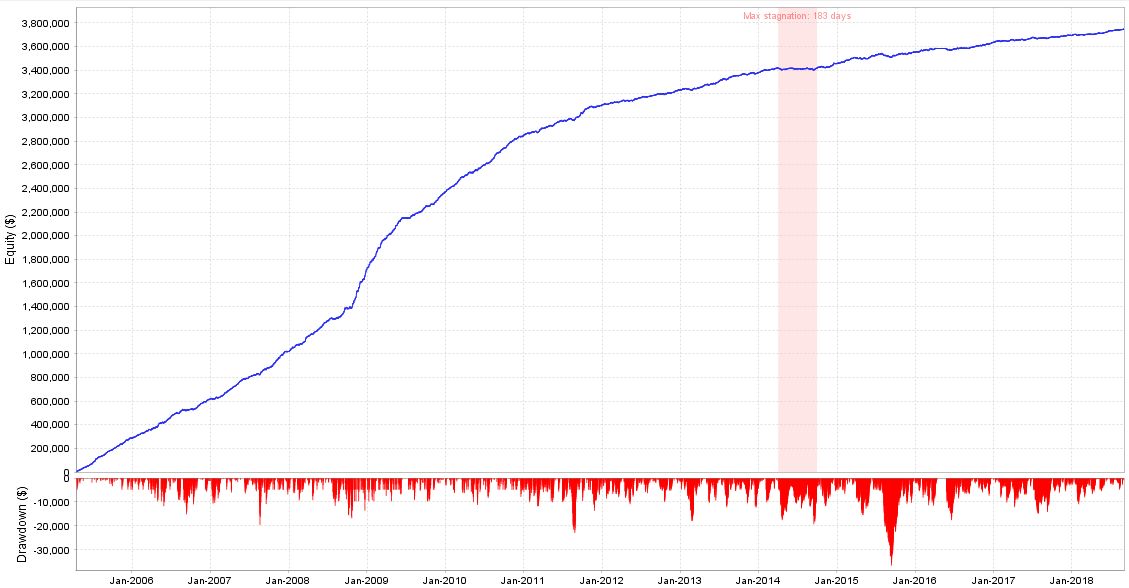
Looking at the profit curve, 2014-2015 were stagnant years. In 2015 the maximum drawdown hit the 30k yen range, butin other periods drawdowns stayed under 20k.【Trade Example】What kind of trades does such a steadily profitable automated trader perform?Blue: buyRed: sellIn trending market phases, it may incur larger losses. The basic strategy is small contrarian trades that tend to win.Overall win rate is in the 70% range, but because there are many trades and the average win vs loss ratio is about 1:1.5, you don't need to worry too closely about the win rate when operating.With compounding features also standard, and given the high number of trades and ~70% win rate, explosive profitability might be possible!?Yuragi AUDNZD
in other periods drawdowns stayed under 20k.
【Trade Example】
What kind of trades does such a steadily profitable automated trader perform?
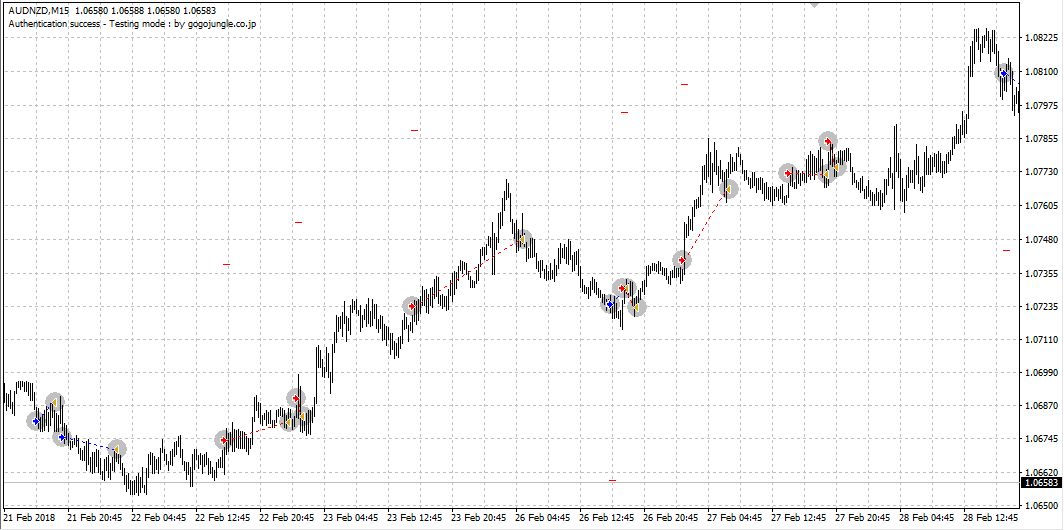
Blue: buy
Red: sell
In trending market phases, it may incur larger losses. The basic strategy is small contrarian trades that tend to win.
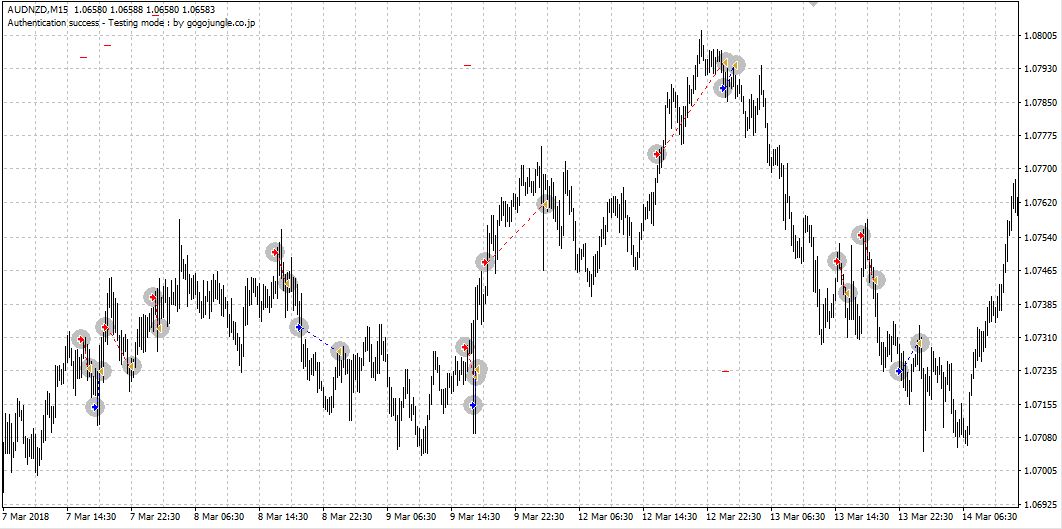
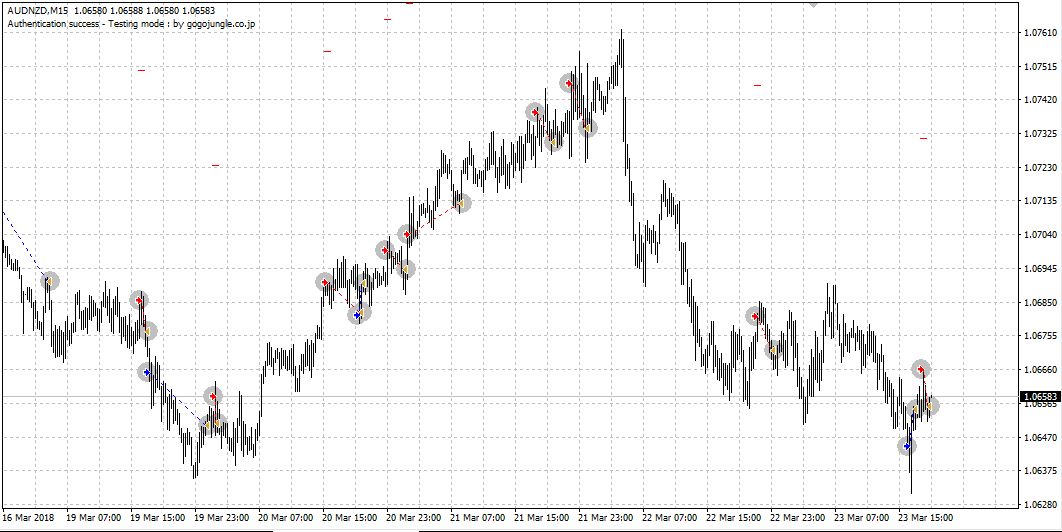
Overall win rate is in the 70% range, but because there are many trades and the average win vs loss ratio is about 1:1.5, you don't need to worry too closely about the win rate when operating.
With compounding features also standard, and given the high number of trades and ~70% win rate, explosive profitability might be possible!?


