

Bitcoin (BTC) shows price movement that crosses the downward trend line; what will happen to the price going forward? — October 9 Chart Analysis
Bitcoin (BTC), which has been in a prolonged ranging market, formed a symmetric pennant pattern on the chart, but in today's price movement on October 9, it has shown movement that crosses the descending trendline forming the upper side of the pennant pattern. As Bitcoin approaches the negation of the pennant pattern, what kind of price action will it display going forward? We will check the chart.
Bitcoin (BTC) in a ranging market remains a factor in judging a potential bullish market
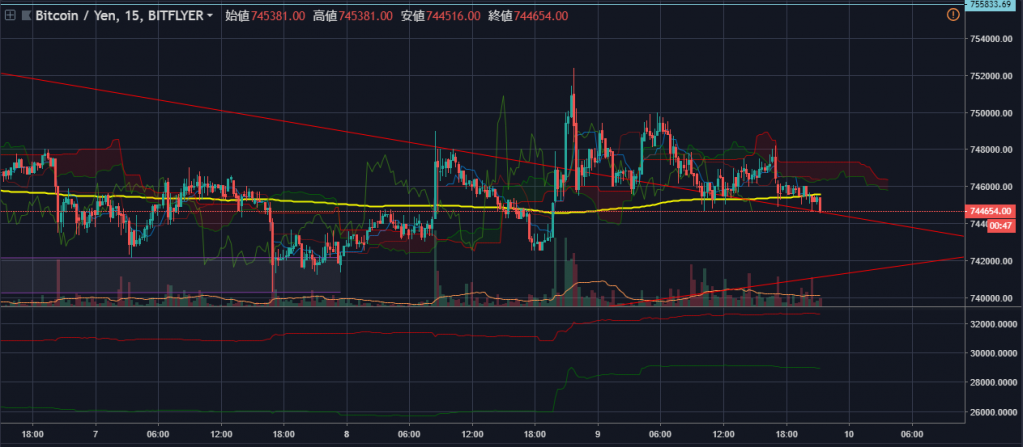
We will look at the BTC/JPY 15-minute chart. Since October 4, Bitcoin has been in a ranging market, with indecisive price action. Within the chart, from the descending trendline starting on September 5 and the rising trendline after September 9, a symmetric pennant pattern was taking shape. If the price followed the trendlines, BTC was expected to converge the pennant by October 10, but today, October 9, a move that crosses the descending trendline has been confirmed.
BTC briefly rose to the mid-700,000 yen range, but then experienced a sharp drop. However, it has been supported by the descending trendline, which had previously acted as a resistance line. Looking at Bitcoin's buy orders, it is clear that large buy orders have been accumulating since the breakout of the trendline today.
Turning the breakout trendline into a support line after a breakout is a key criterion for judging a potential bullish market for BTC. Going forward, it is important to see whether BTC can sustain support at the broken trendline and extend the price further.