

Utilization of the "Visualization Indicator" (Part 152)
Utilization of the “Visualization Indicator” (Part152)
1. Further evolve the “28 Currency Pairs List Indicator” into an indicator
“8CPVisualization Indicatorto drawCHFJPY.
The “8CPVisualization Indicator” includesOceania版LondonNewYorkAnyCP版があります。今回は、NewYork版を使いました。
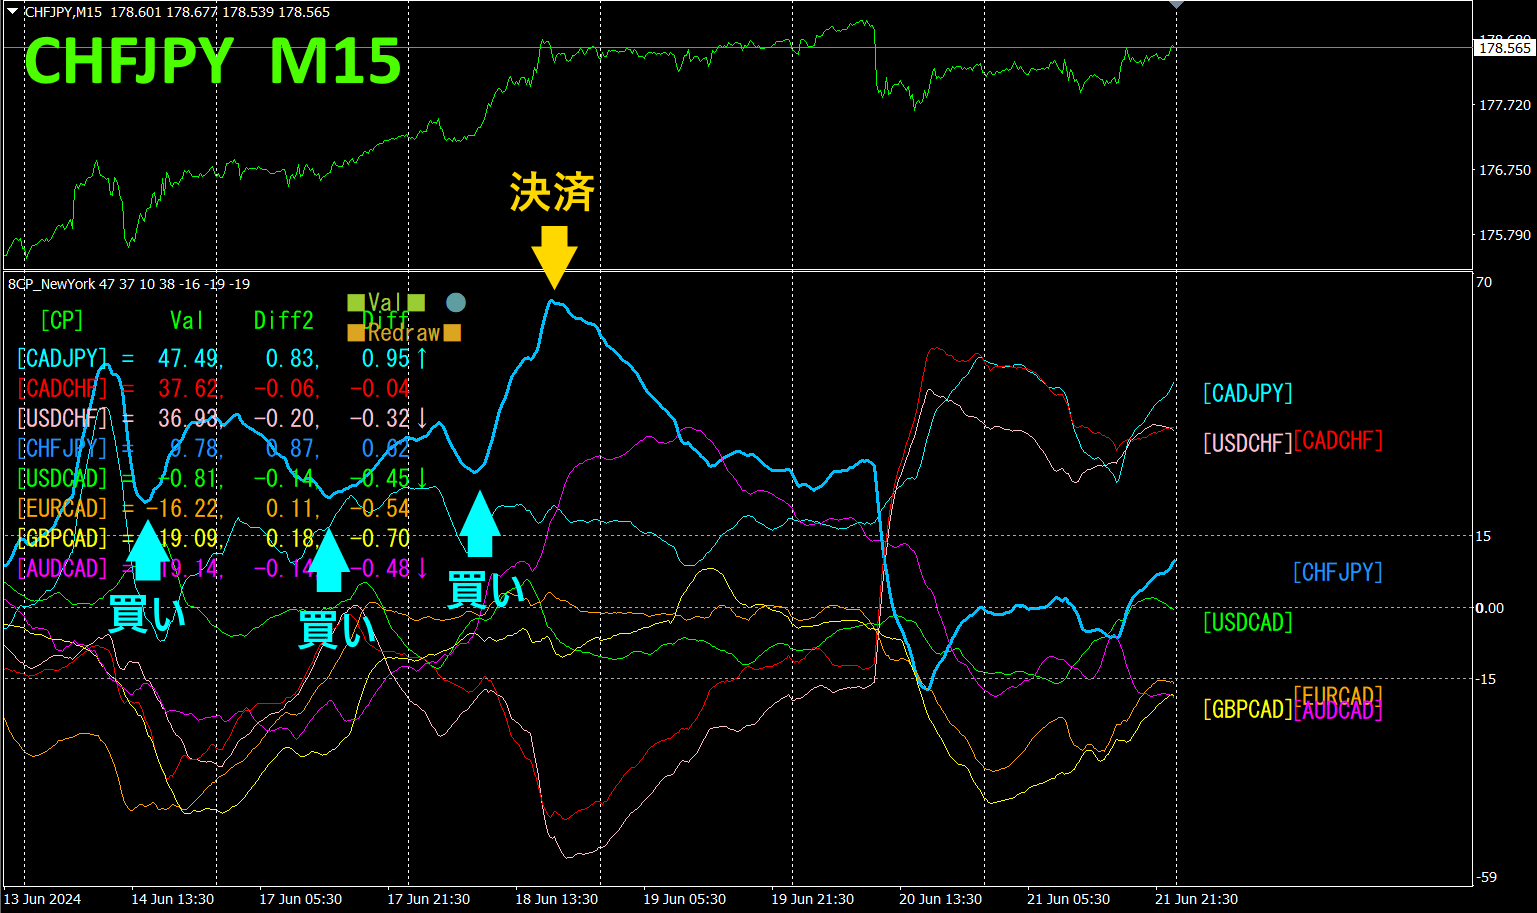
The upper half is a 15-minute chart ofCHFJPY. The lower half shows the visuals from the “8CPVisualization Indicator”; the light blue thick line graph corresponds toCHFJPY.
The graph ofCHFJPY is located the highest among the graphs. When the CHFJPY graph forms a valley, we enter a buy. When the graph peaks, we close the position. If you had bought at the first buy point, you could have earned approximately320pips of profit.
If you used “TrendLine-EX, you can automate entry and exit by breaking the diagonal trend line. You can leave it as is for easy trading. “TrendLine-EX
2. Best SelectIndicator to try
The figure below is a screenshot dated2024year6month18day15:37
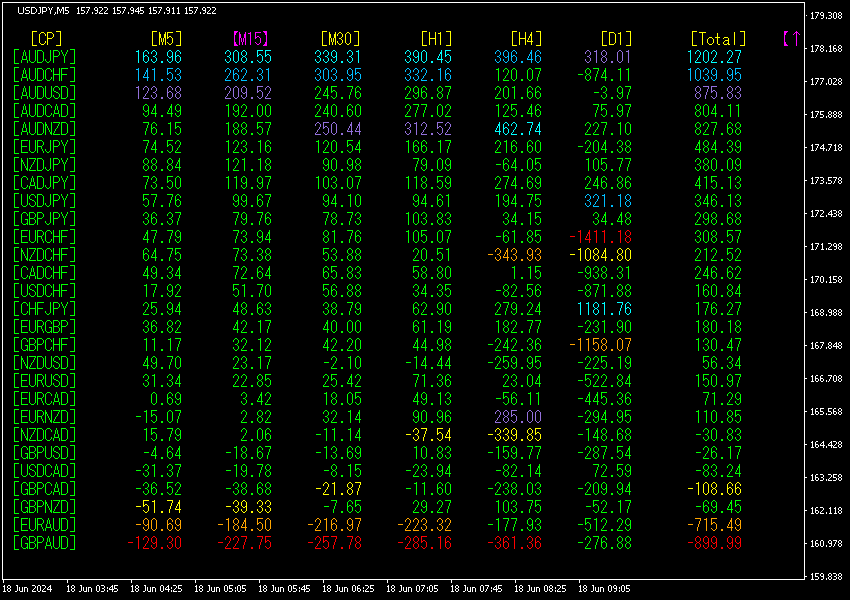
[M5]Numbers are listed in descending order. The top row withAUDJPY shows blue hues across all timeframes. Moreover, the total value is and positive, indicating an uptrend forAUDJPY.
Now, let’s look at the AUDJPY chart.
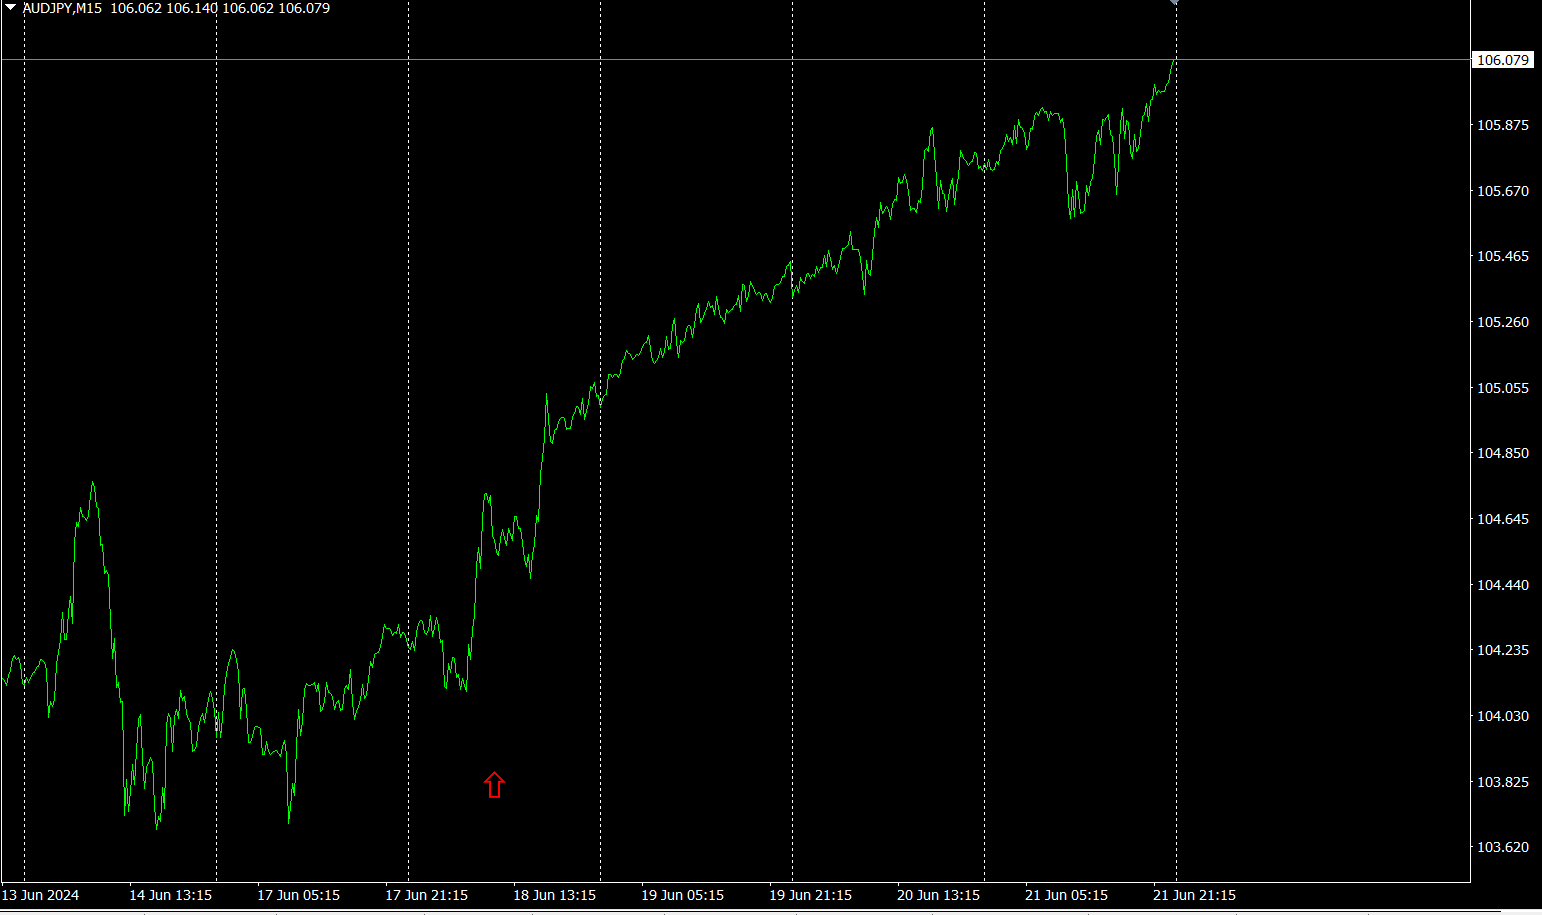
The red arrows mark the points at which the screenshot was taken, capturing a sharp rise.
The “28 Currency Pairs Best Select Indicator lets you easily identify which currency among the 28 pairs has the strongest trend. It also tells you, with numbers and colors, whether you should trade now. It is a superb indicator for judging the overall movement of all currency pairs at a glance.
The “28 Currency Pairs Best Select Indicator”
https://www.gogojungle.co.jp/tools/indicators/35128

3. 2021年月から追っているEURJPYの動きはどうなった?
From May 2021 to date, what happened with EURJPY?年月から
To view the overall trend, a 30-minute chart covering roughly the last weeks is drawn.
Last time I wrote the following.
JPYisaboveEURand the direction is down. Meanwhile,is upward. In the future,will rise.
As expected, it rose.
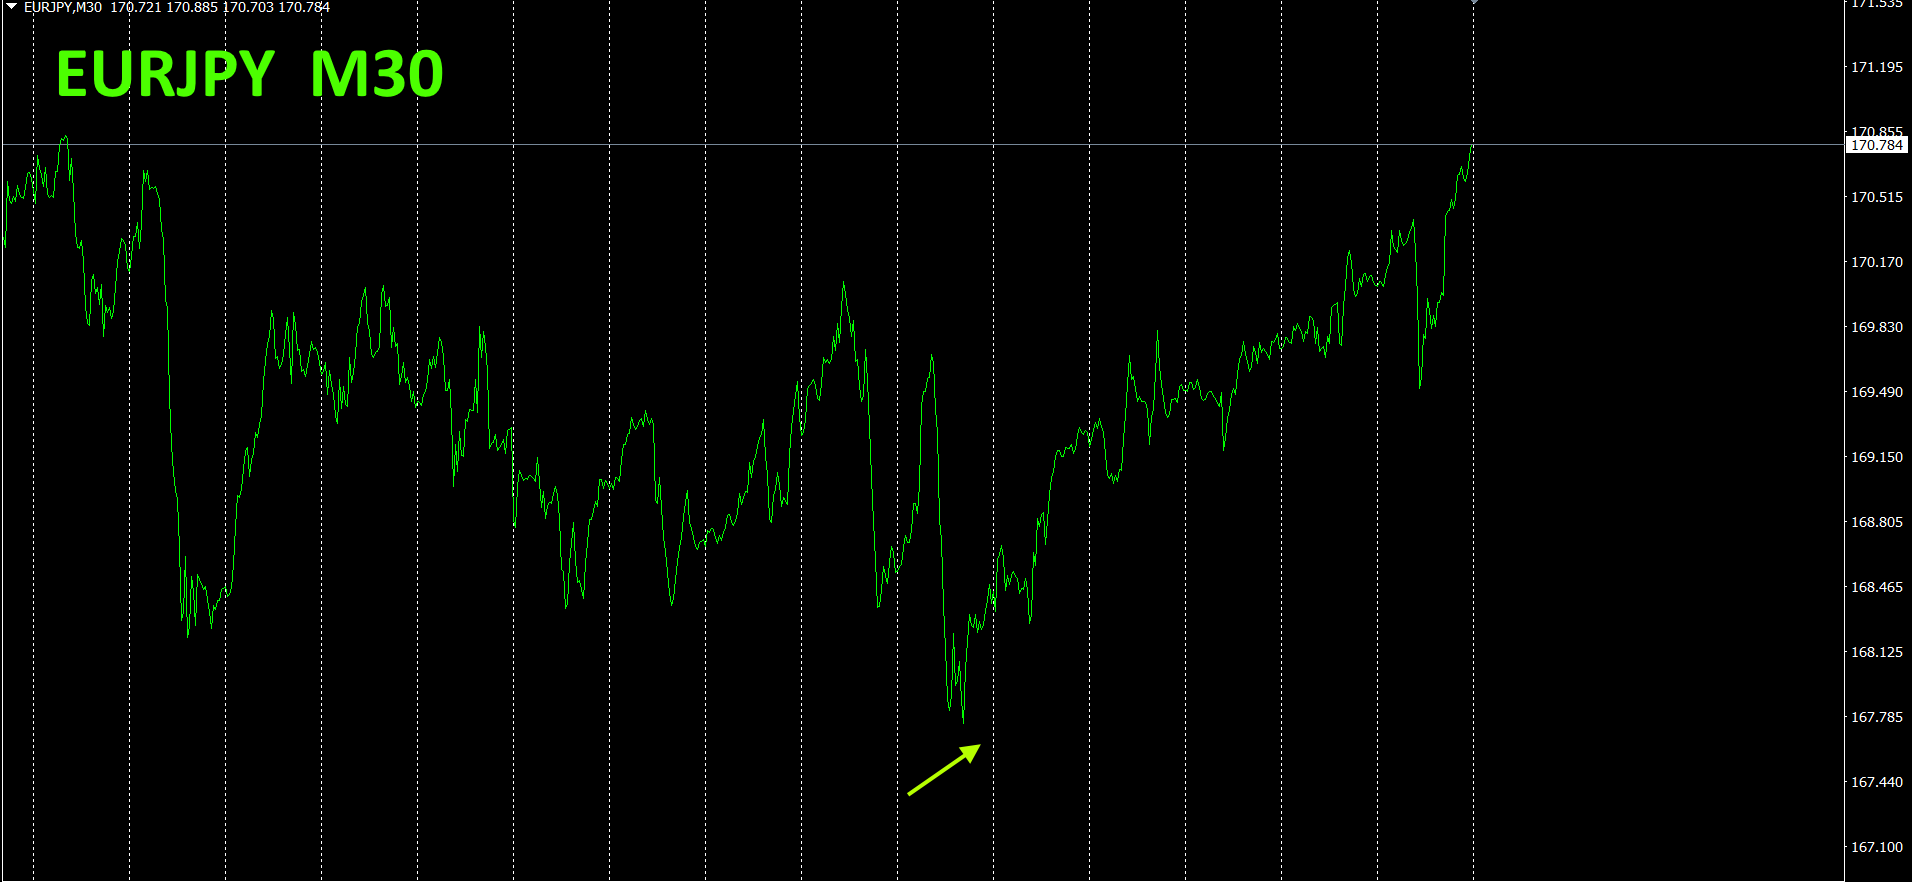
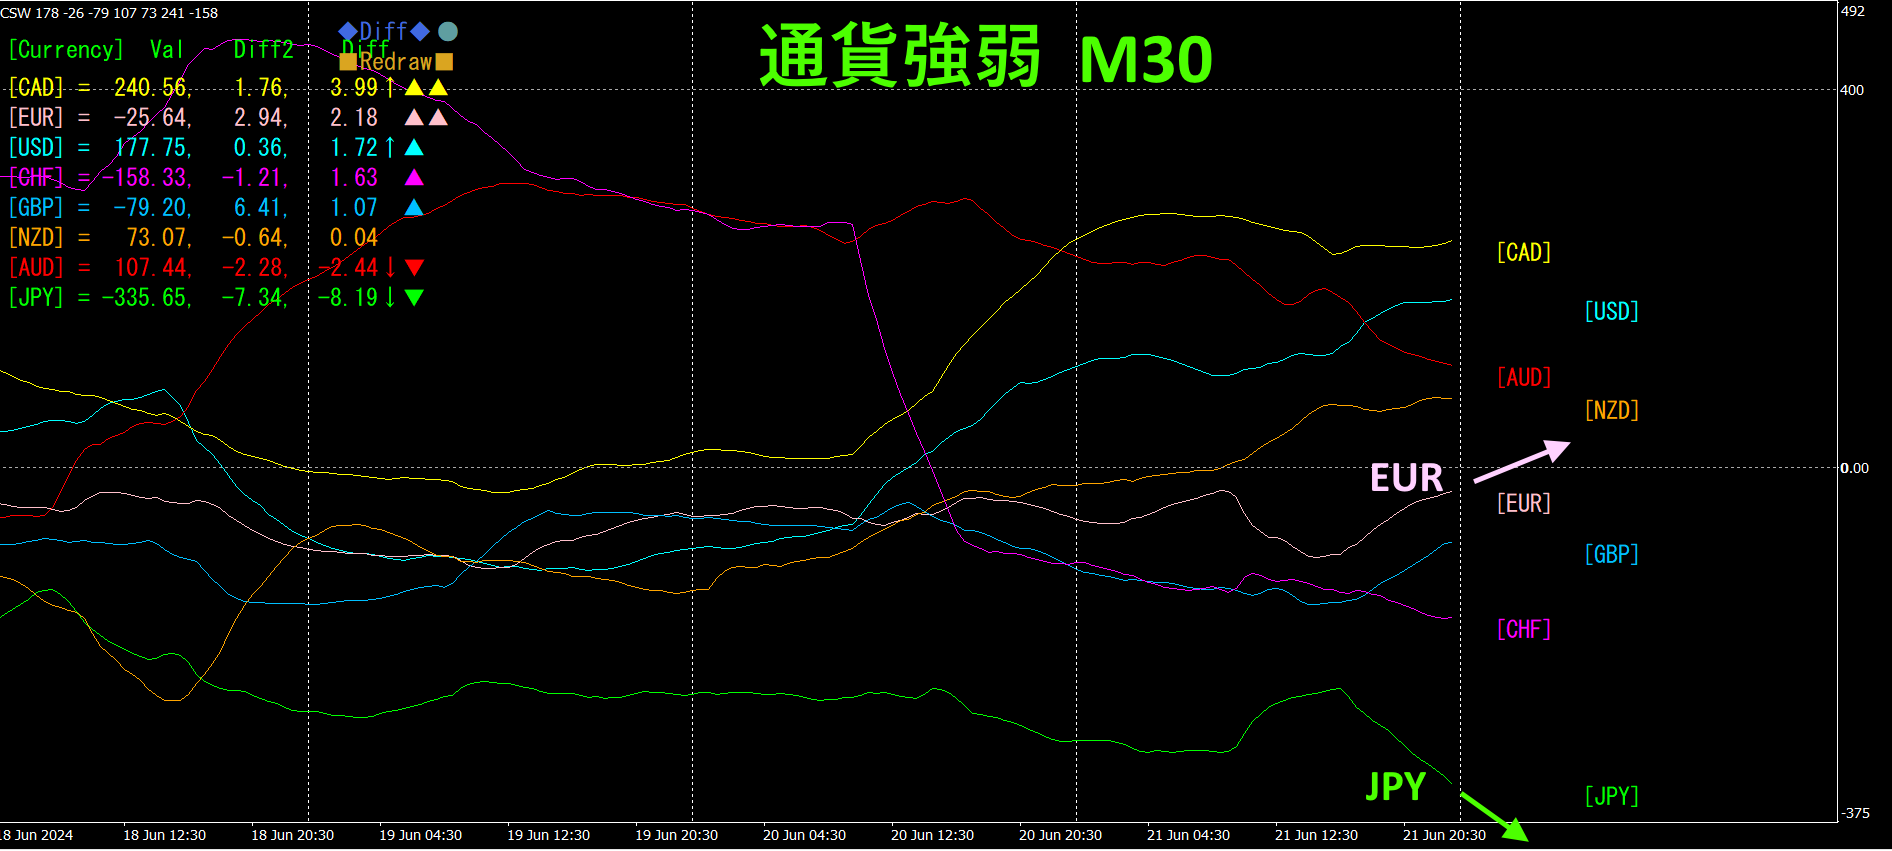
A 30-minute currency strength chart shows.
Pink indicates, green indicates. is at the lowest position and is downward; in contrast, is rising. Going forward,will continue to ascend.
4. New EAAI一本釣り” (MT4/MT5) is now on sale.
“AI一本釣り” usesAI to analyze the market, and 90% of it was developed with AI, making it a “multi-million EA.” It targets only high-volatility moments, like a “one-line fishing” to harvest profits from the huge market.
In the latest forward testing, it is still in the drawdown valley, but long-term projections look positive. Patience is needed now.

https://www.gogojungle.co.jp/systemtrade/fx/51292
https://www.gogojungle.co.jp/systemtrade/fx/51393

5.
Recommended Indicators
“TrendLine-EX”
https://www.gogojungle.co.jp/tools/indicators/42257

The “8CCurrency Strength Visualization Indicator” can be found on the following pages.
MT4版 https://www.gogojungle.co.jp/tools/indicators/39150
MT5版 https://www.gogojungle.co.jp/tools/indicators/39159
【My Items for Sale】


