

Utilization of "Visualization Indicators" (Part 151)
“Visualization Indicator” Utilization (part151)”
1. Further evolve the “28 Currency Pair List Indicator” into an indicator
“8CPVisualization Indicator”to drawAUDUSD.
The “8CPVisualization Indicator” includes” (MT4/MT5) has gone on sale.Oceania version,LondonNewYork version,AnyCP version. This time, we used theOceania version.
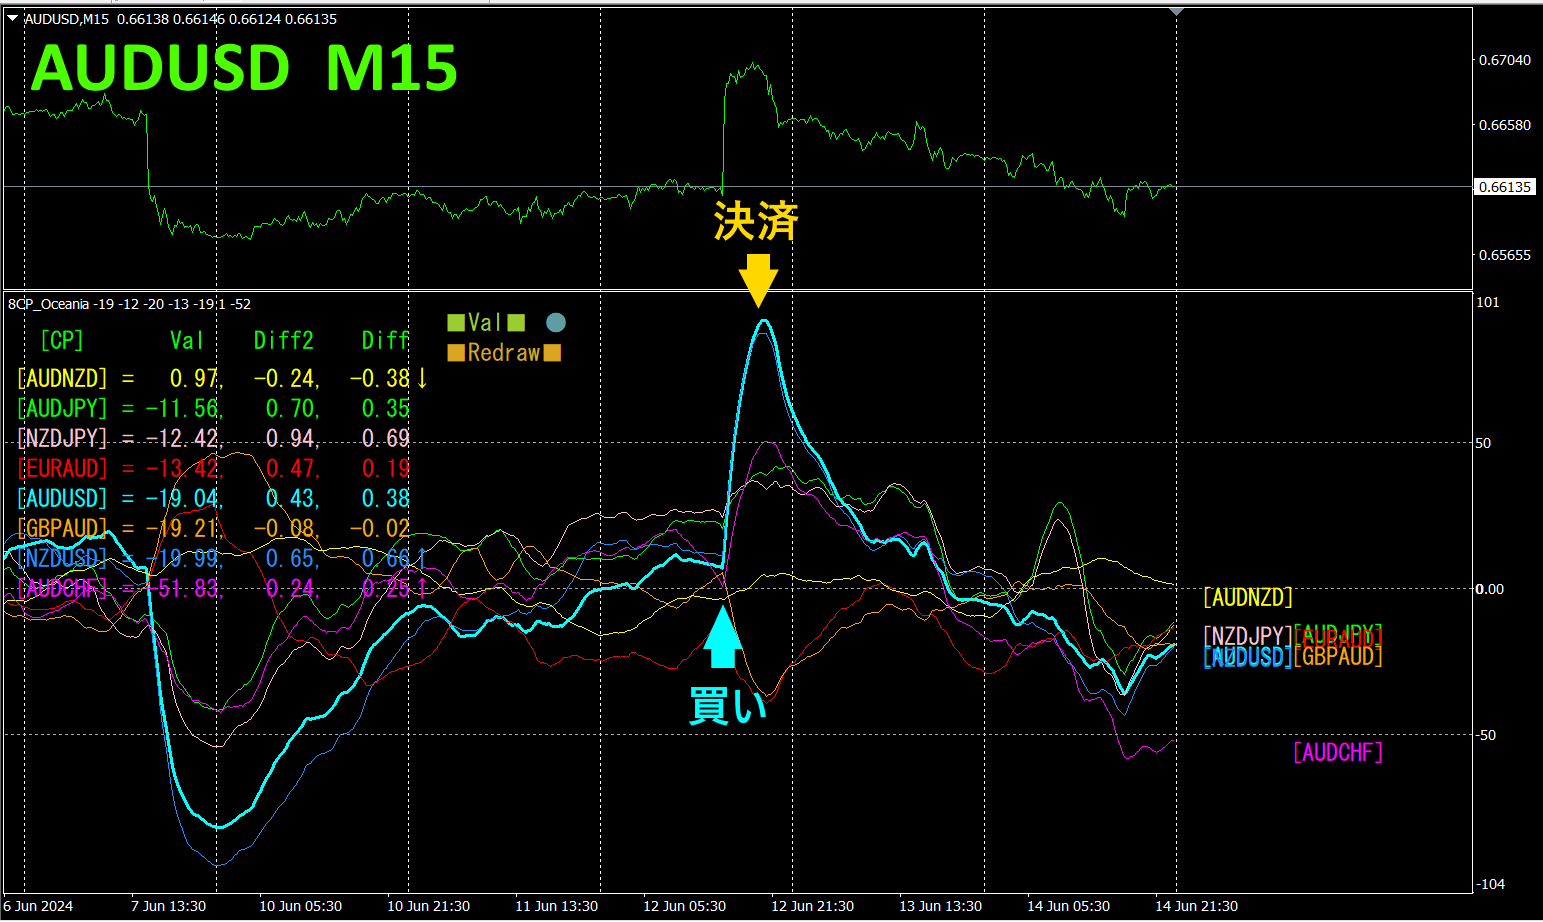
The upper half is theAUDUSD 15-minute chart. The lower half shows the result using the “8CPVisualization Indicator”; the light blue thick line graph corresponds toAUDUSD.
AUDUSD surged through other graph groups at a great buying point. When the “Visualization Indicator”’sAUDUSD reverses, we exit. About90pips profit was earned.
If you were using theTrendLine-EX, entering and exiting could be automated by breaking the diagonal trend line. You can just leave it as is for easy trading. “TrendLine-EX is a semi-automatic EA that can auto-sell on a break below the trend line and auto-settle on a break above it.
2. Best SelectIndicator to Try
The diagram below is a screenshot from2024 year6 month14 day12:42 (JST) .
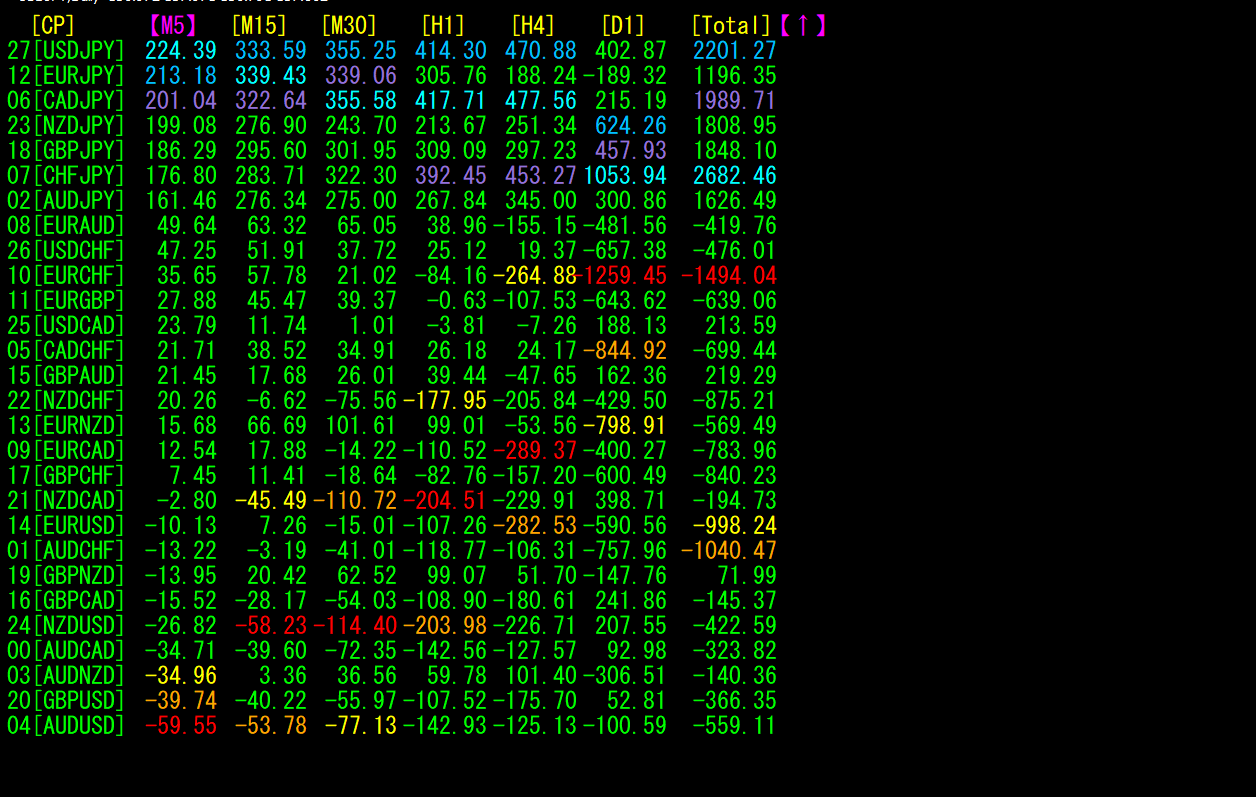
[M5] ranked in descending order of numbers. At the top row,USDJPY is displayed in blue across all timeframes. Moreover, the value is 2201.27, a large positive figure, indicating an uptrend in.
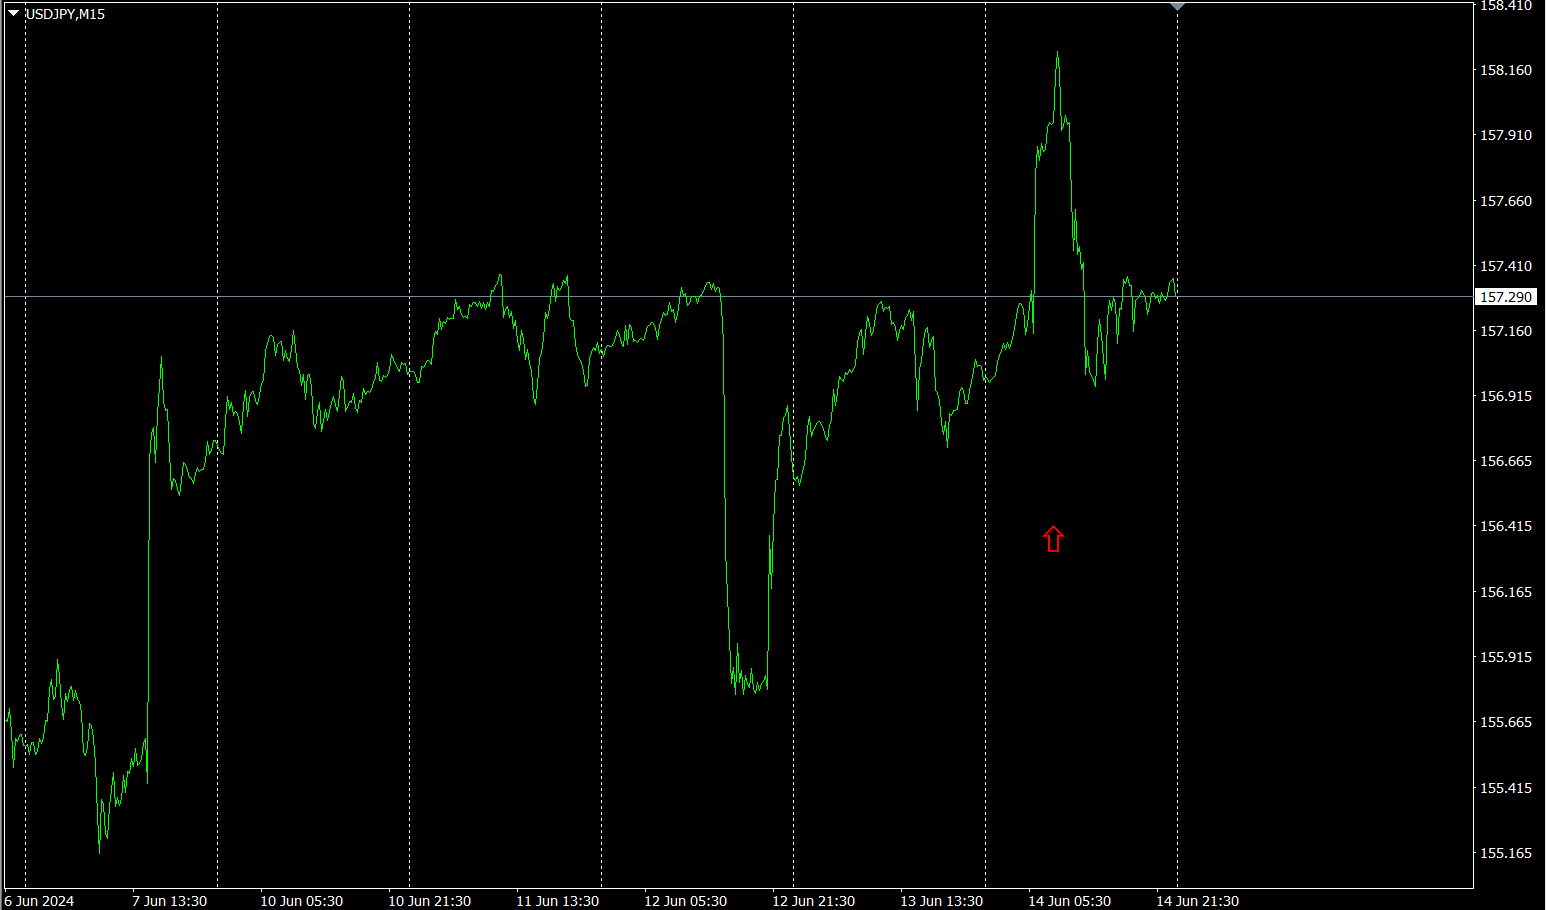
Now, let’s look at the USDJPY chart.
The red arrow marks the screenshot location, capturing the surge.
“28 currency pairsBest Select Indicator” enables you to easily identify which currency among 28 pairs has the strongest trend. It also tells you whether you should trade now with color and numeric cues. It provides a quick, at-a-glance view of all currency pairs’ movements.
“28 currency pairsBest Select Indicator”
https://www.gogojungle.co.jp/tools/indicators/35128

3. 2021 year5 month onward, what happened with EURJPY?
2021 year5 month onward, EURJPY movement tracked.
To view the overall trend, a30 minute chart depicting roughly the last3 weeks was drawn.
Last time, we wrote the following.
JPY is slightly above EUR EUR is expected to decline a bit, will trend downward slightly.
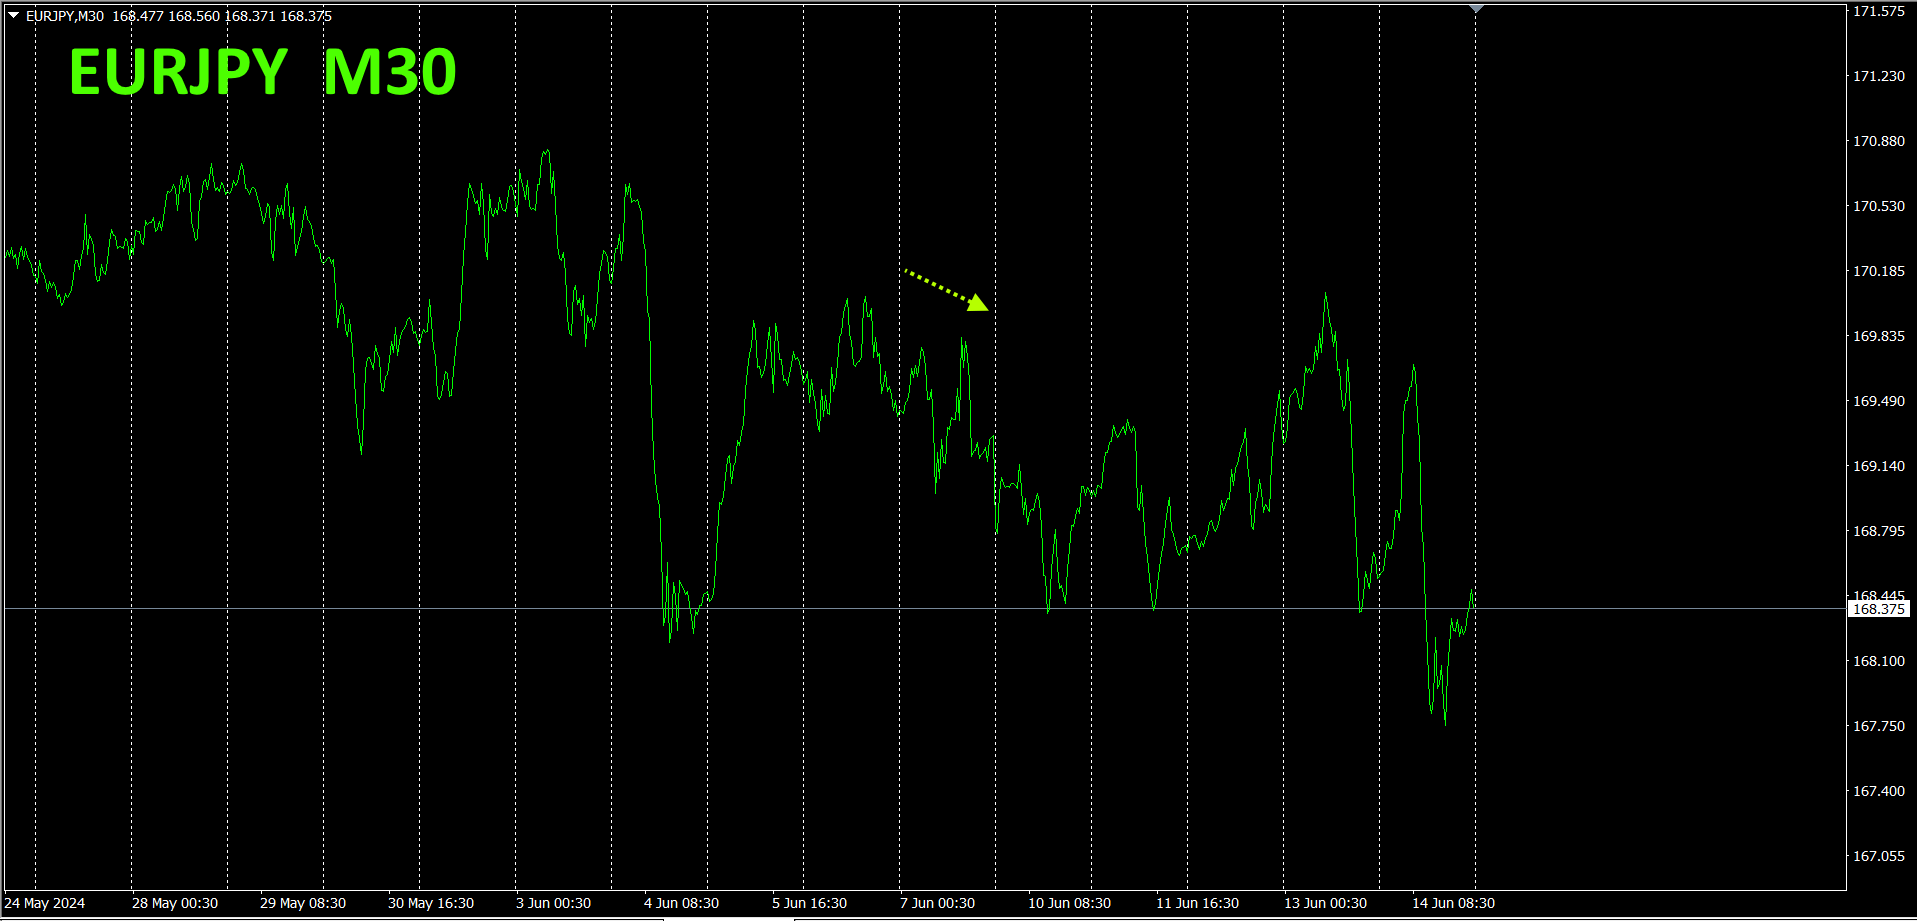
As expected, it trended downward.
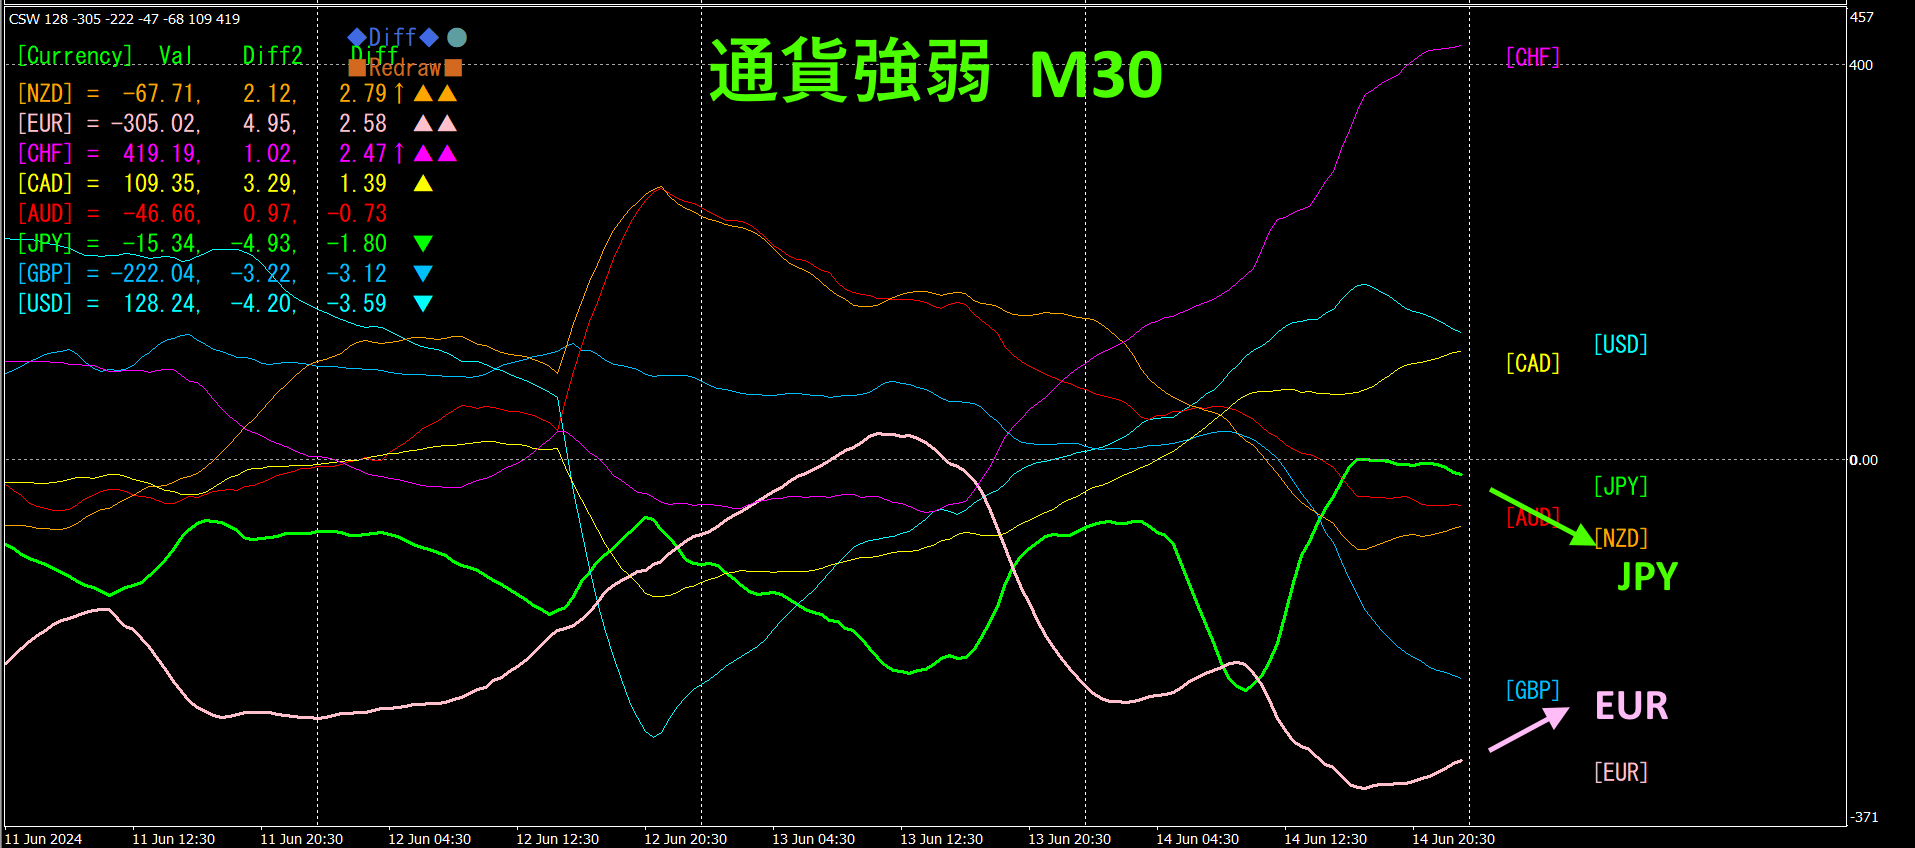
30-minute currency strength chart.
Pink showsEUR, green shows. JPY is positioned above, but its direction is downward. Meanwhile, is upward. Going forward, will rise.
4. New EA “AI一本釣り EURJPY
“AI一本釣り EURJPY” usesAI for market analysis, has developed 90% of it into a “billion-yen EA.” It trades without averaging down or martingale, targeting only volatile moments, catching profits from the vast market as if fishing with a single line.
In the most recent forward test, drawdown increased and losses continued, but viewed long-term it should be profitable. Patience is needed now.

https://www.gogojungle.co.jp/systemtrade/fx/51292
https://www.gogojungle.co.jp/systemtrade/fx/51393

5.
Recommended Indicator
“TrendLine-EX”
https://www.gogojungle.co.jp/tools/indicators/42257

“8CCurrency Strength Visualization Indicator” please refer to the following page.

MT4 version https://www.gogojungle.co.jp/tools/indicators/39150
MT5 version https://www.gogojungle.co.jp/tools/indicators/39159
【My items for sale】


