

Ethereum (ETH) breaks through the channel line into a bear market; what will happen to prices next? - October 5 Chart Analysis
Ethereum (ETH), which had been gradually turning upward since the end of September, continued to struggle to rise after testing the upper level on September 29. On October 3, it even dipped below the previous channel line, giving the impression that a bear market had begun. We will check Ethereum's chart.
Ethereum (ETH), which has shown many trend-reversal signals, shifts into a bear market
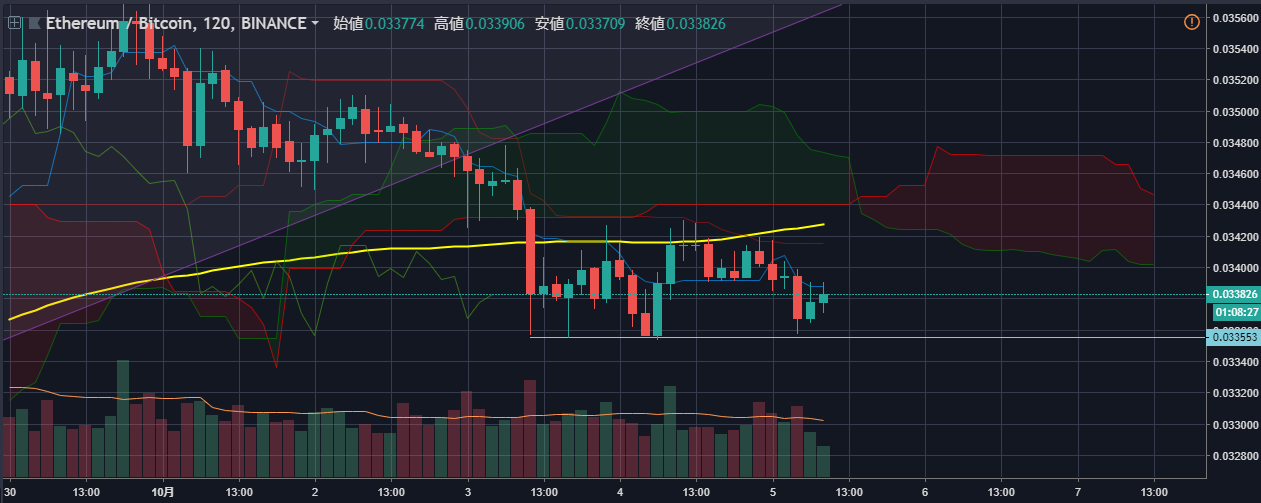
We will look at the ETH/BTC 4-hour chart. In the early hours of October 3, ETH broke below the previous channel line; immediately after breaking below, there were signs of it attempting to re-enter the channel, but the lower bound of the channel held resistance and pushed it back. As a result, the rising candles largely formed with little real body, producing candles with long upper wicks.
After forming candles with long upper wicks, ETH began to fall sharply. Since October, ETH has traded below many technical indicators, including the channel line, the Ichimoku cloud, and the 200-day moving average. The current perception is a bear market for ETH, and the lows up to today, October 5, are around 0.033 BTC, which can be considered a current support level.