

Utilization of "Visualization Indicators" (Part 150)
Utilization of the “Visualization Indicator” (part150)
1. Progressing and evolving the “28 Currency Pair List Indicator” into an indicator
“8CPVisualization Indicator”to drawAUDCHF.
The “8CPVisualization Indicator” includesOceania版,London版,NewYork版,AnyCP版. This time, we used theOceania版.
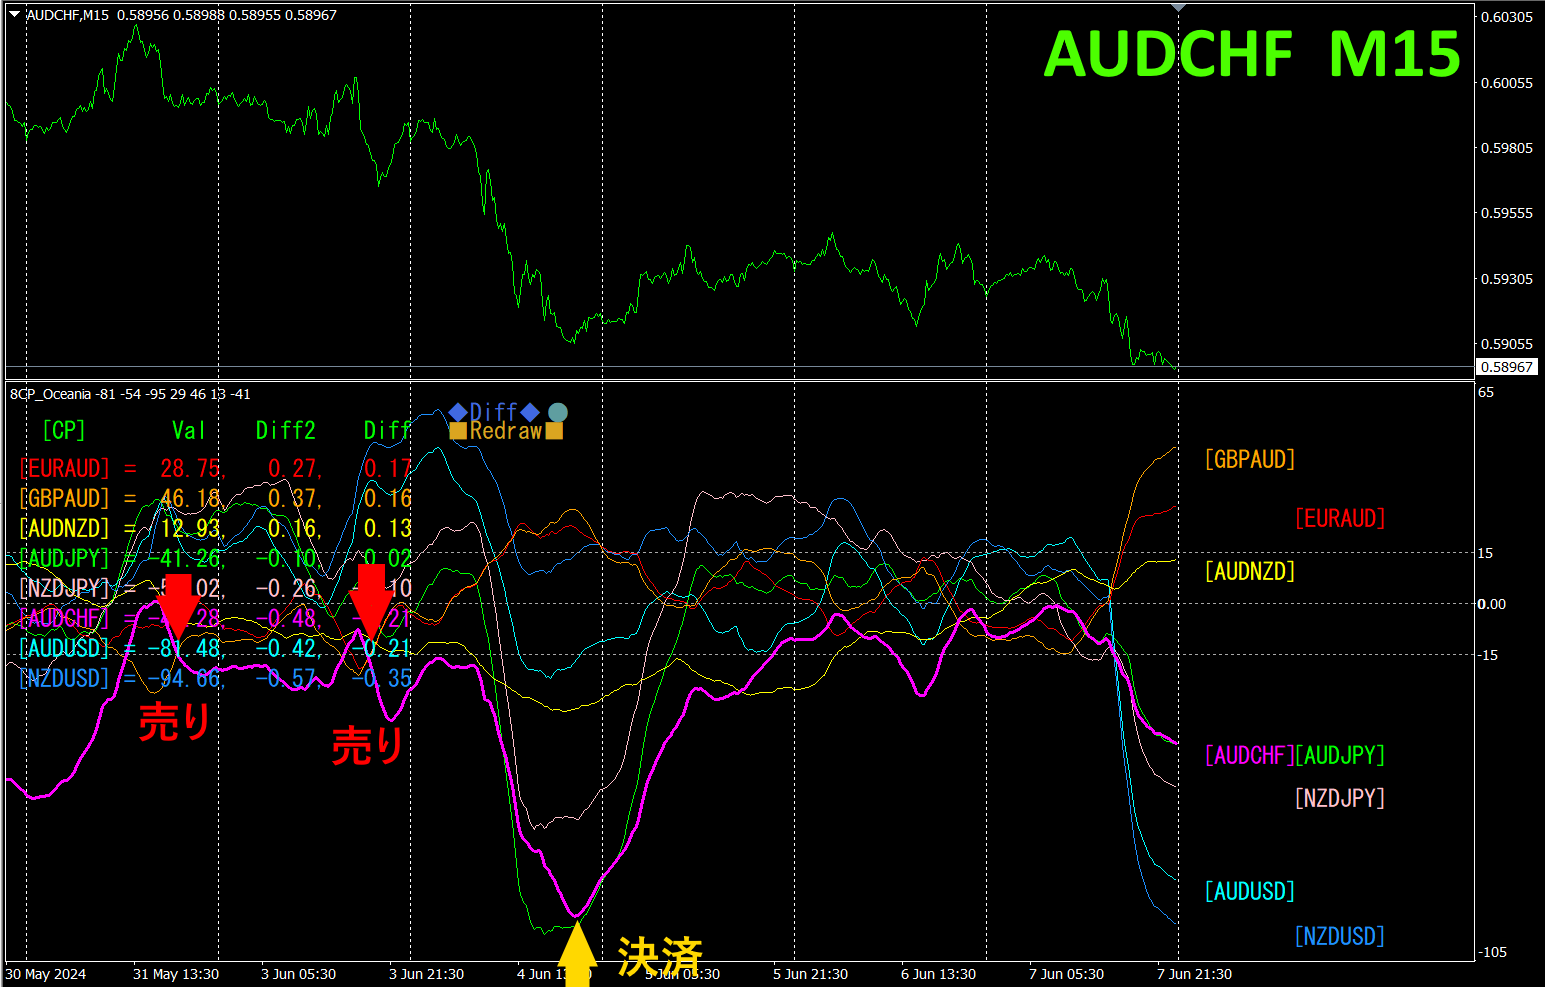
The upper half is theAUDCHF 15-minute chart. The lower half is from the “8CPVisualization Indicator”; the red-violet thick line graph corresponds toAUDCHF.
AUDCHF dropping below other graph groups is an ideal selling point. When the “Visualization Indicator”AUDCHF reverses, we close the position. About90pips of profit was earned.
If you use “TrendLine-EX, you can automate entry and exit with a diagonal trend line breakout. It can be left as is, enabling easy trading. “TrendLine-EX is a semi-automatic EA that can sell automatically on a trend line breakout below, and automatically settle on a breakout above.
2. Best SelectIndicator to try
The image below is a screenshot taken on2024 year6月3日23:46(JST)
[Total]Numbers are listed in descending order. The top row’sNZDUSD shows blue-valued across all time frames. Moreover, theTotal value is 3356.46, a large positive figure, indicating a strong uptrend for.
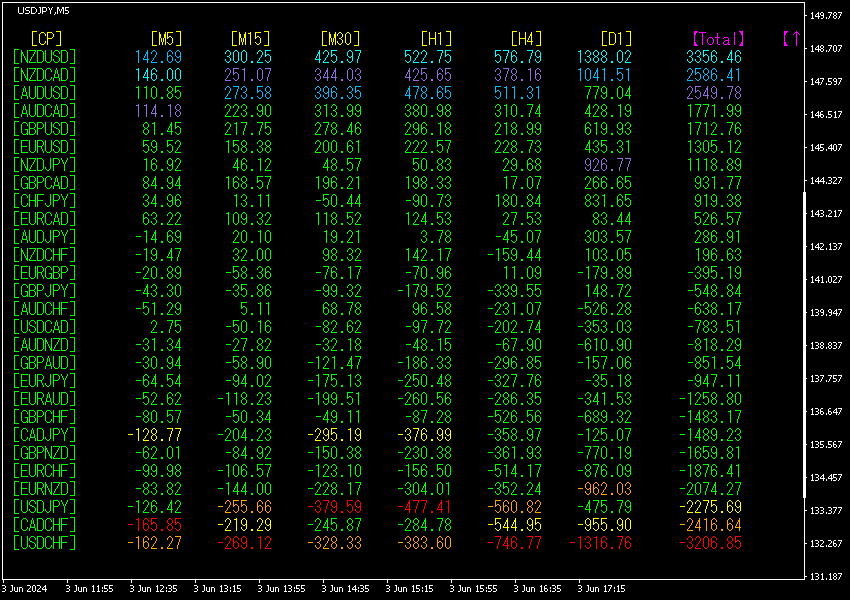
Now, let’s look at theNZDUSD chart.

The red arrows mark the point when the screenshot was taken. It captures a surge within an uptrend.
“28 Currency Pairs Best Select Indicator” enables easy identification of which currency among 28 pairs is showing the strongest trend. It also indicates, with numbers and colors, whether you should trade now. It provides a quick overall sense of all currency pairs’ movements.
“28 Currency Pairs Best Select Indicator”
https://www.gogojungle.co.jp/tools/indicators/35128

3. 2021Year5 monthSince May, how did EURJPY move?
2021 year5 monthSince May
To view the overall trend, a30-minute chart shows roughly3 weeks of data.
Previously, I wrote the following.
JPYis lower than EUR, and its direction is also downward relative to EUR. Going forward,EUR is expected to rise slightly.

On Monday it rose a little, then plunged.
30-minute currency strength chart.

Pink representsEUR, green representsJPYJPY is positioned slightly above, and its direction is upward relative to EUR. In the future, is expected to move slightly downward.
4. NewEA“AIOne-Casting EURJPY
“AIOne-Casting EURJPY” usesAI to analyze the market, to develop 90%, a “multi-billion-yen”EA that targets only high-volatility moments, fishing profits from the vast sea of the market as if “one casting”.EA.
In the most recent forward test, the drawdown has slightly increased, but viewed long-term, this EA should be profitable, so I believe it is a time to endure.

https://www.gogojungle.co.jp/systemtrade/fx/51292
5.
Recommended Indicator
“”
https://www.gogojungle.co.jp/tools/indicators/42257

“8C Currency Strength Visualization Indicator” please refer to the following page.

MT4 version https://www.gogojungle.co.jp/tools/indicators/39150
MT5 version https://www.gogojungle.co.jp/tools/indicators/39159
【My listed products】


