

Bitcoin (BTC) breaks above the downward trendline and surges, will the 상승 momentum continue in the future? – October 4 Chart Analysis
Bitcoin (BTC), which broke support on October 3, began to show renewed upward movement after noon Japan time on October 3. On October 4, it broke the downward trend line that had resisted breaking so far and formed a large bullish candle. Will Bitcoin continue its bullish mood from October onward? We will check the chart.
Bitcoin (BTC) Unwinds Sell Orders Rapidly at the Break of the Trend Line
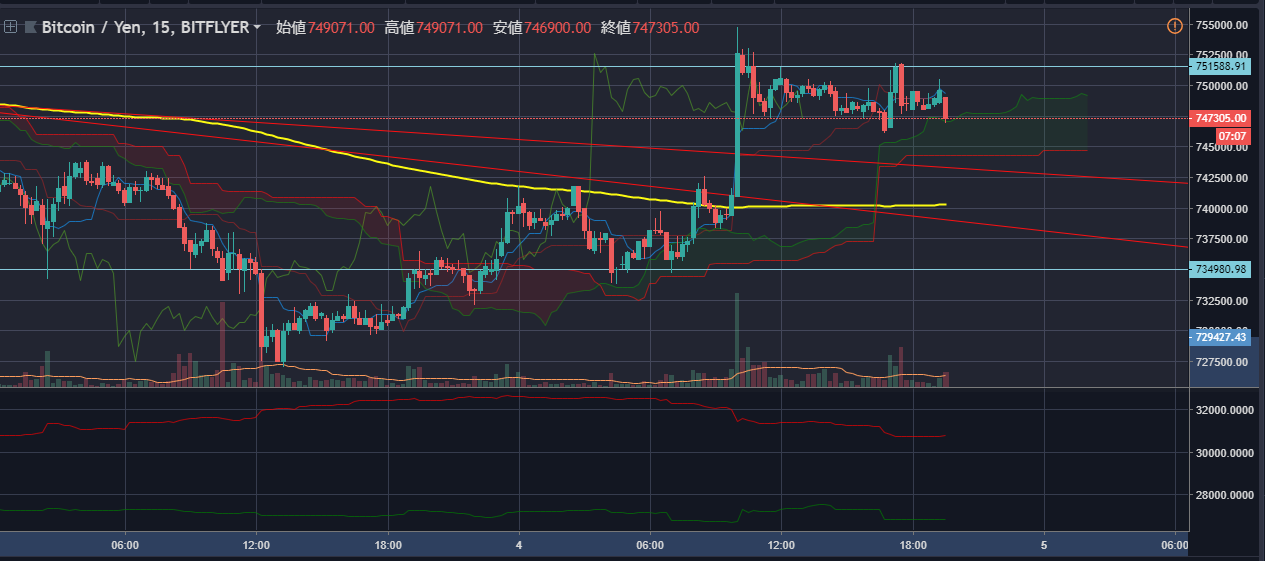
We will look at the BTC/JPY 15-minute chart. On October 3, BTC broke the 7.3 million yen support area that had been the support line, and after the break formed a large bearish candle and fell to the 7.2 million yen range. However, after touching the 7.2 million yen area, BTC began to rise again.
On October 4, it was rejected twice by the downward trend line since September 28, but on the third contact it finally broke the trend line, forming a large bullish candle and succeeding in pushing the price up to the mid 7.5 million yen range.
When we check BTC sell orders, since the support line broke on October 3, the sell order volume has surged. It is believed that the short-term sell orders increased as a result of the negative factor of the support line break, contributing to BTC’s decline to some extent.
Therefore, the sell order volume for BTC after the downward trend line break has been unwound rapidly. There is a possibility that the unwinding occurred by short-term traders who were taking sell orders against the support line break.