

The use of "Visualizing Indicators" (Part 149)
“Visualization Indicator” usage (part149)”
1. Advance and develop the “28 Currency Pairs List Indicator” into an indicator
“8 CP Visualization Indicator” for GBPCHF to be drawn
There are versions of the “8 CP Visualization Indicator”: Oceania, London, New York, and AnyCP. This time, I used the London version.
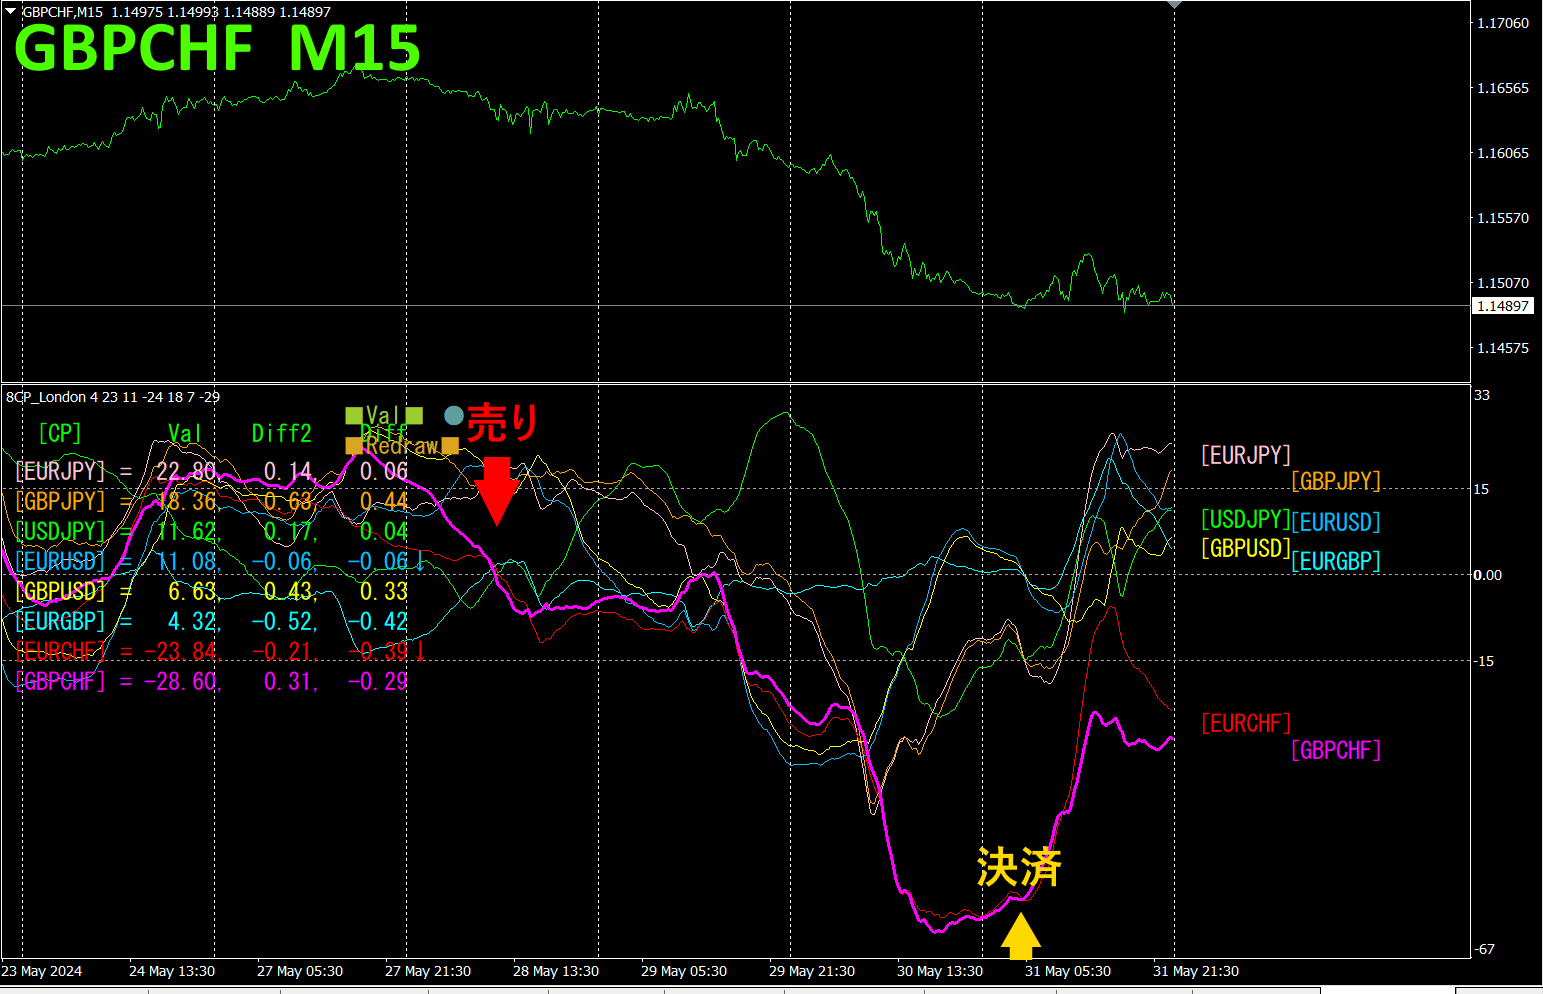
The top half is the 15-minute chart of GBPCHF. The bottom half is from the “8 CP Visualization Indicator”; the red-purple thick line graph corresponds to GBPCHF.
On Tuesday, GBPCHF fell below the other chart groups, so I entered a sell. If the “Visualization Indicator” reverses from the bottom, I will exit. About 150 pips of profit was earned.
If you use “TrendLine-EX,” you can automate entries and exits with diagonal trendline breaks. You can simply leave it alone for easy trading. “TrendLine-EX” is a semi-automatic EA that sells automatically when the price breaks below a trendline and exits automatically when it breaks above a trendline.
※ Recommended Indicator
With a semi-automatic EA like “Trend Line EX,” you can draw a diagonal downward line and automatically buy when it breaks above, automatically exit when it breaks above the rising line, enabling a hands-off trading approach.
“Trend Line EX”
https://www.gogojungle.co.jp/tools/indicators/42257

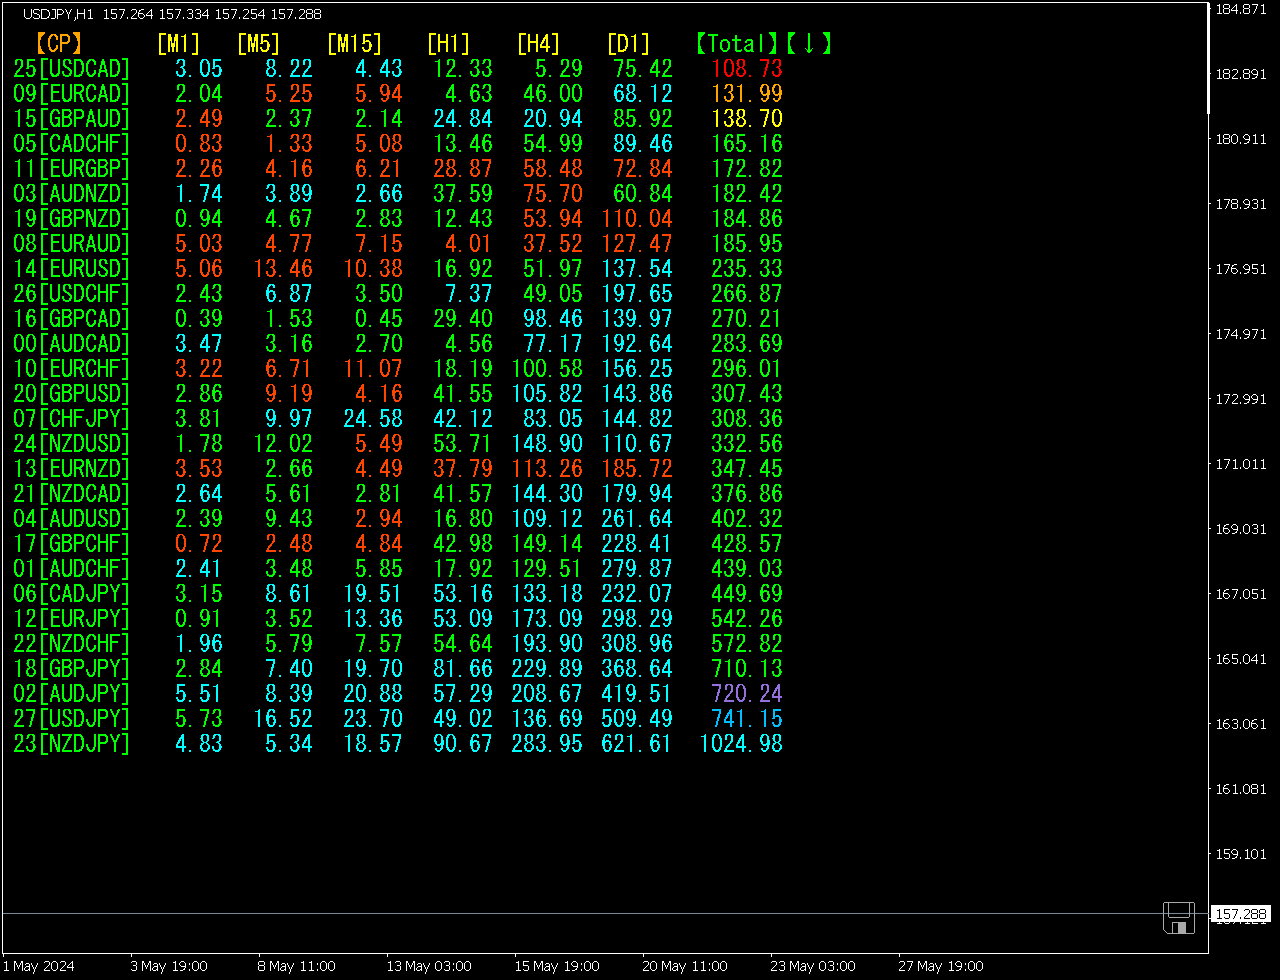
2. Best SelectTry the indicator
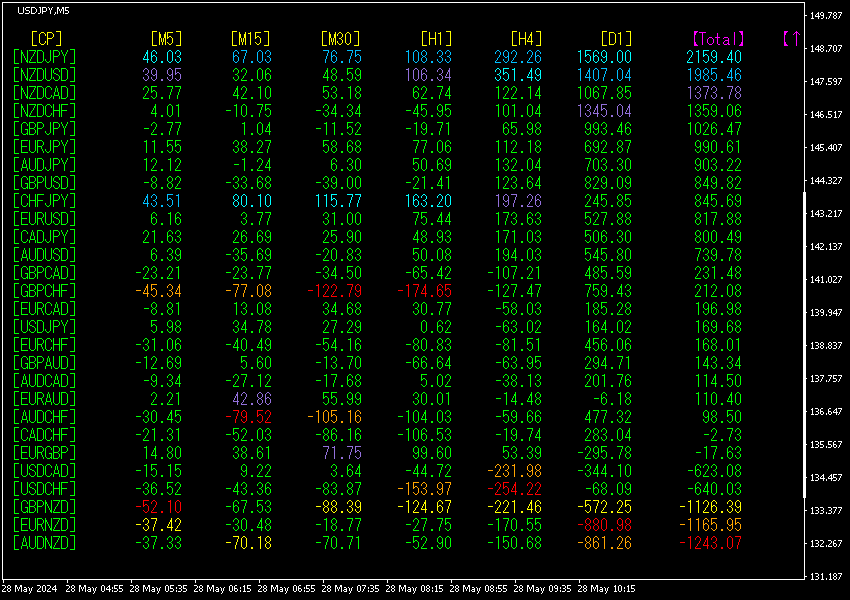
The figure below is a screenshot taken onMay 28, 16:45(JST
[Total]Values are in descending order. The top row, NZDJPY, shows blue color across all timeframes. Also, the Total value is a large positive 2159.40, indicating an uptrend for NZDJPY.Total value is
Now, let’s view the NZDJPY chart.
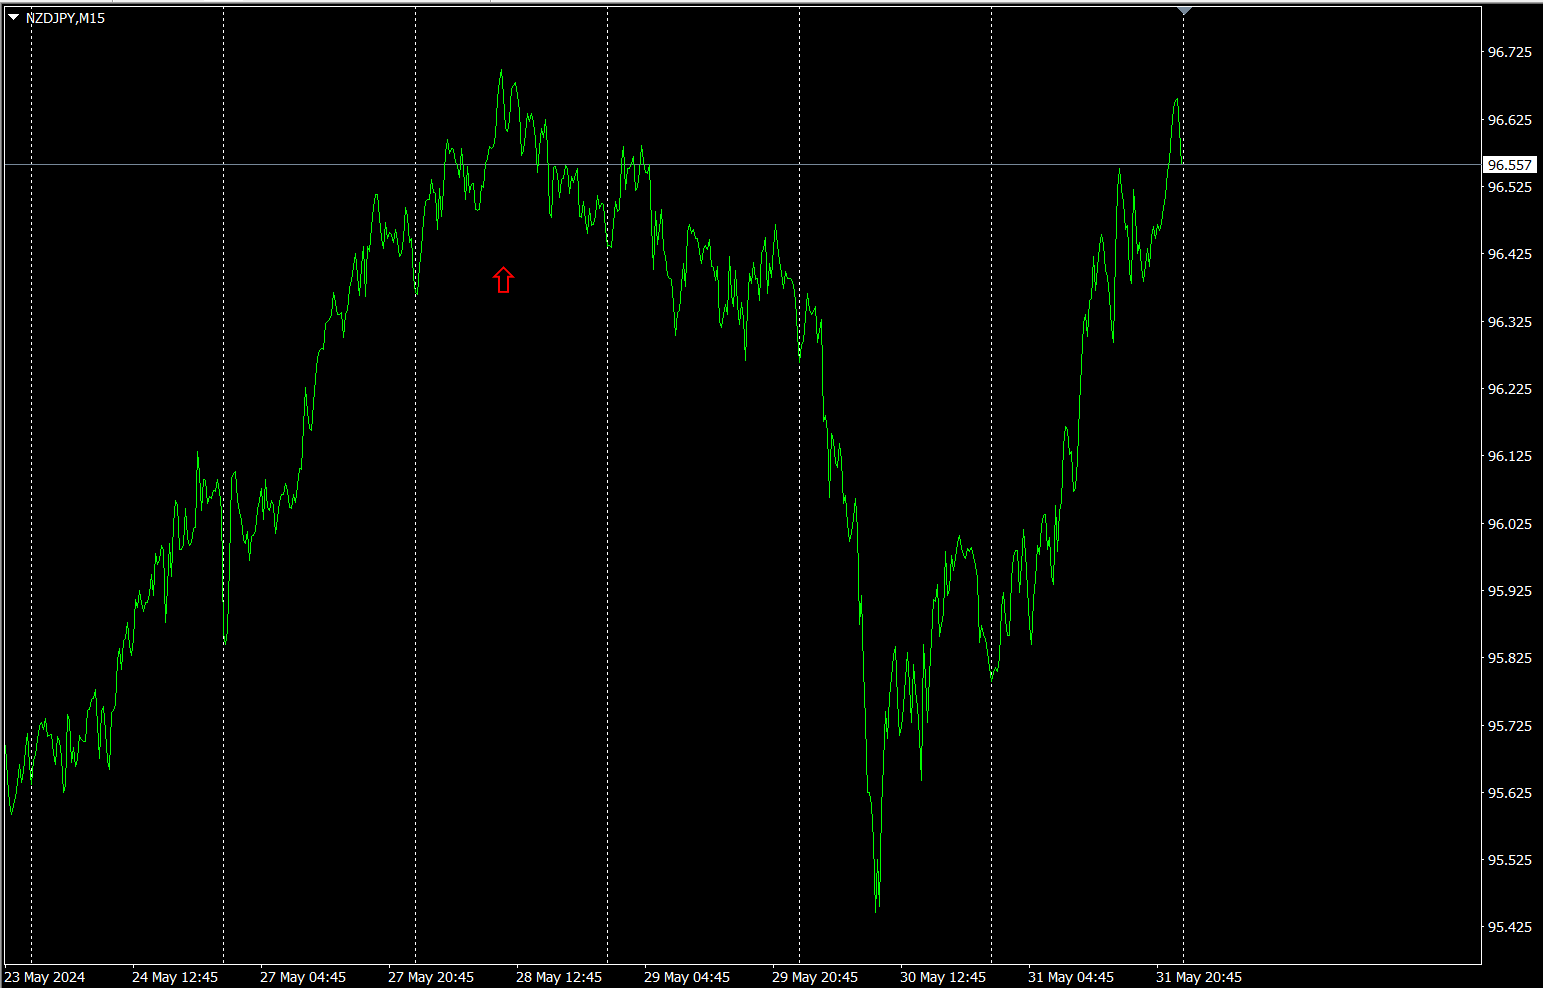
The red arrow marks the spot where the screenshot was taken. It corresponds to the final surge of the uptrend.
The “28 Currency Pairs Best Select Indicator” allows you to easily identify which currency among 28 pairs is currently showing the strongest trend. It also tells you, with numbers and colors, whether you should trade now. It is a superb indicator that lets you assess all currency pairs at a glance.
“28 Currency Pairs Best Select Indicator”
https://www.gogojungle.co.jp/tools/indicators/35128

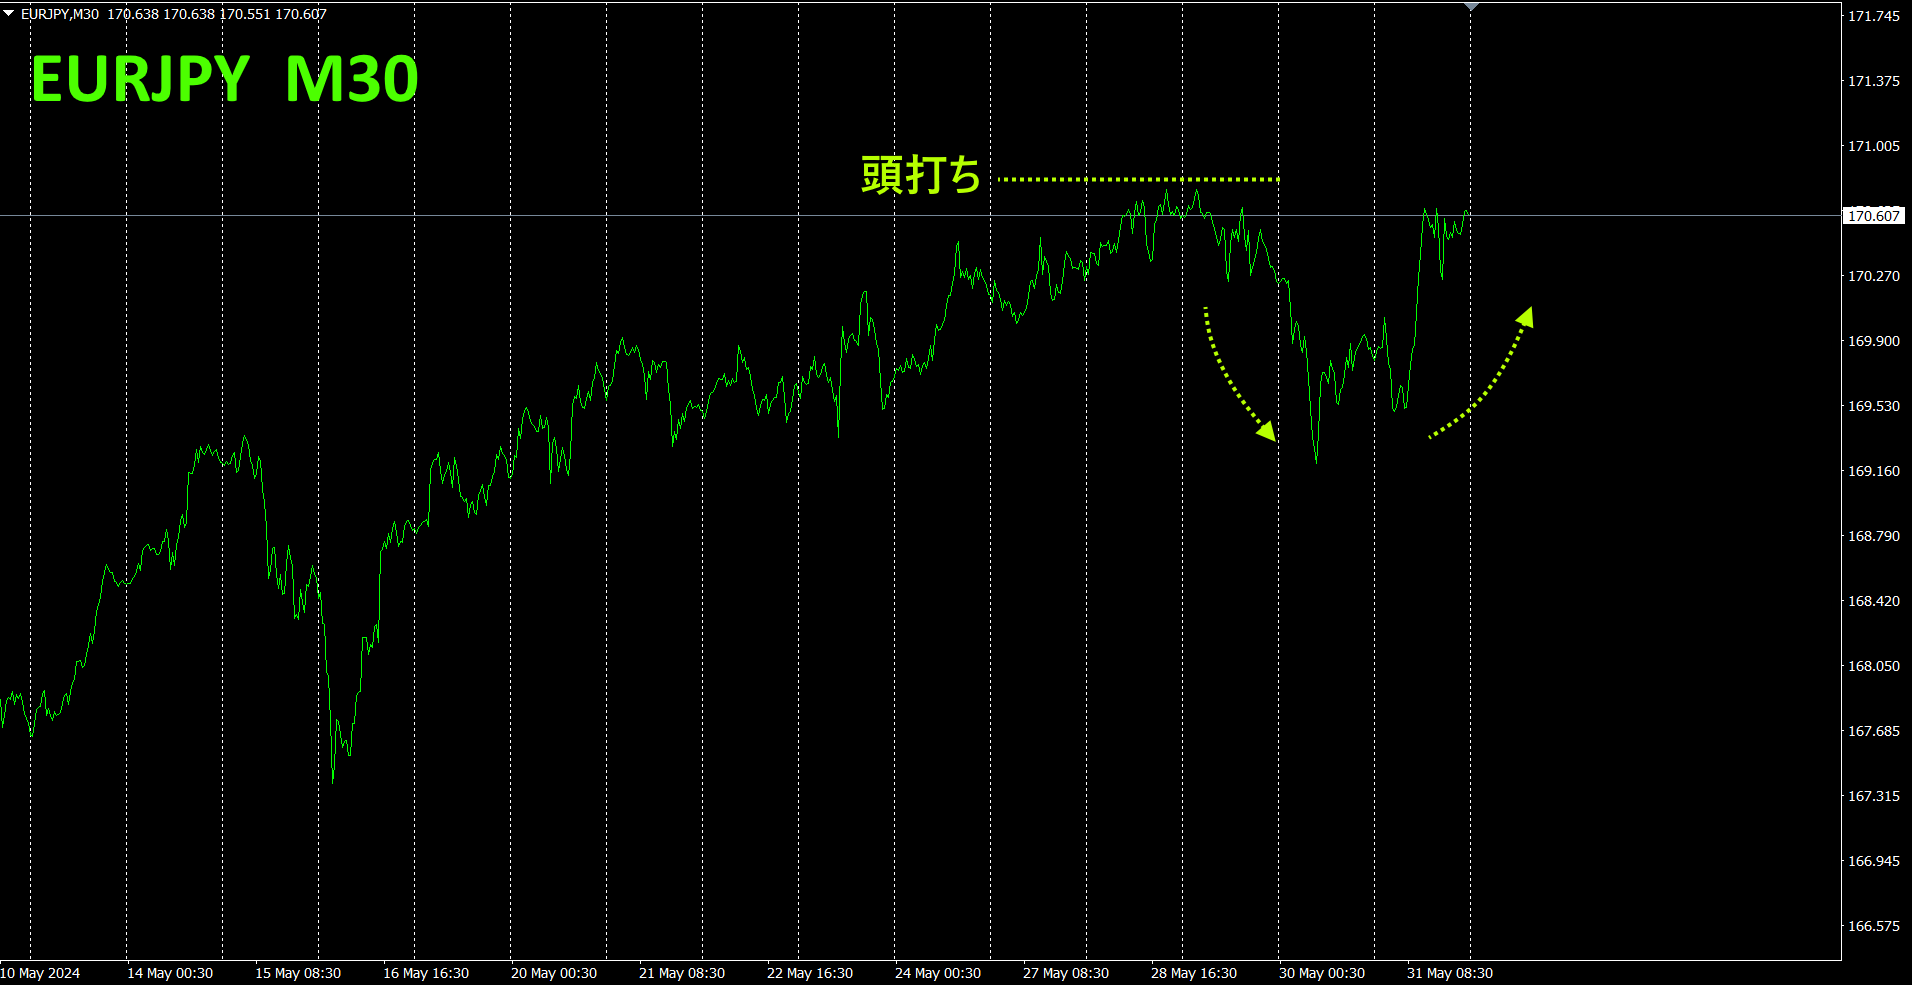
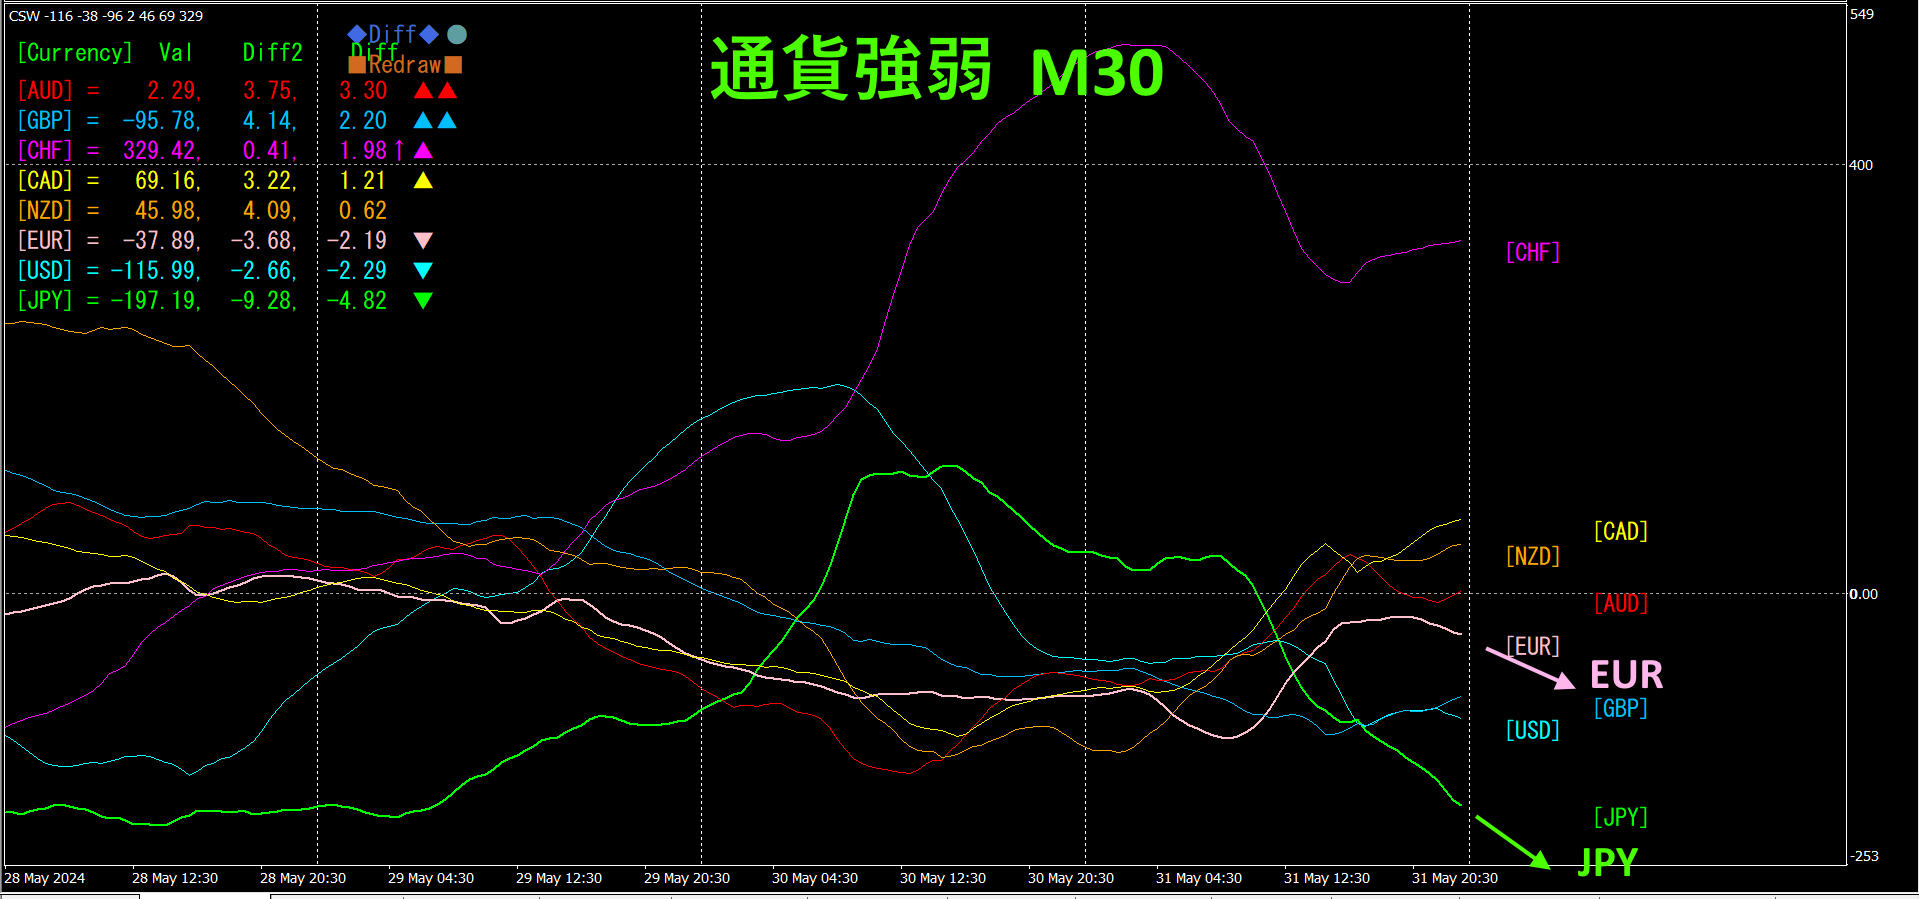
3. Since May 2021 What happened with EURJPY since May 2021 We have tracked EURJPY since May 2021.
To view the overall trend, we have drawn roughly the last three weeks on a 30-minute chart.
Last time, I wrote the following.
is weaker than EUR, EUR would rise,As expected, the move followed.
30-minute currency strength chart.
Pink isEUR, green isJPY
4. Two new indicators have been released.
They are the “Tore-tore Indicator” and the “Tore-tore 28CP_Select Indicator.”
These were developed on the premise that markets move in waves of contraction and expansion, and trading only in the direction from contraction to expansion (not trading at other times).
Please view the intro video created with AI added to the Tore-tore Indicator.

For product pages, please see below.
“Tore-tore Indicator”
https://www.gogojungle.co.jp/tools/indicators/50115
“Tore-tore 28CP_Select Indicator””
https://www.gogojungle.co.jp/tools/indicators/50203
5.
Actual trades using the Tore-tore Indicator
The following figure was taken on 29 at 09:20, showing the Tore-tore Indicator screenshot.
Now, let’s look at the chart.
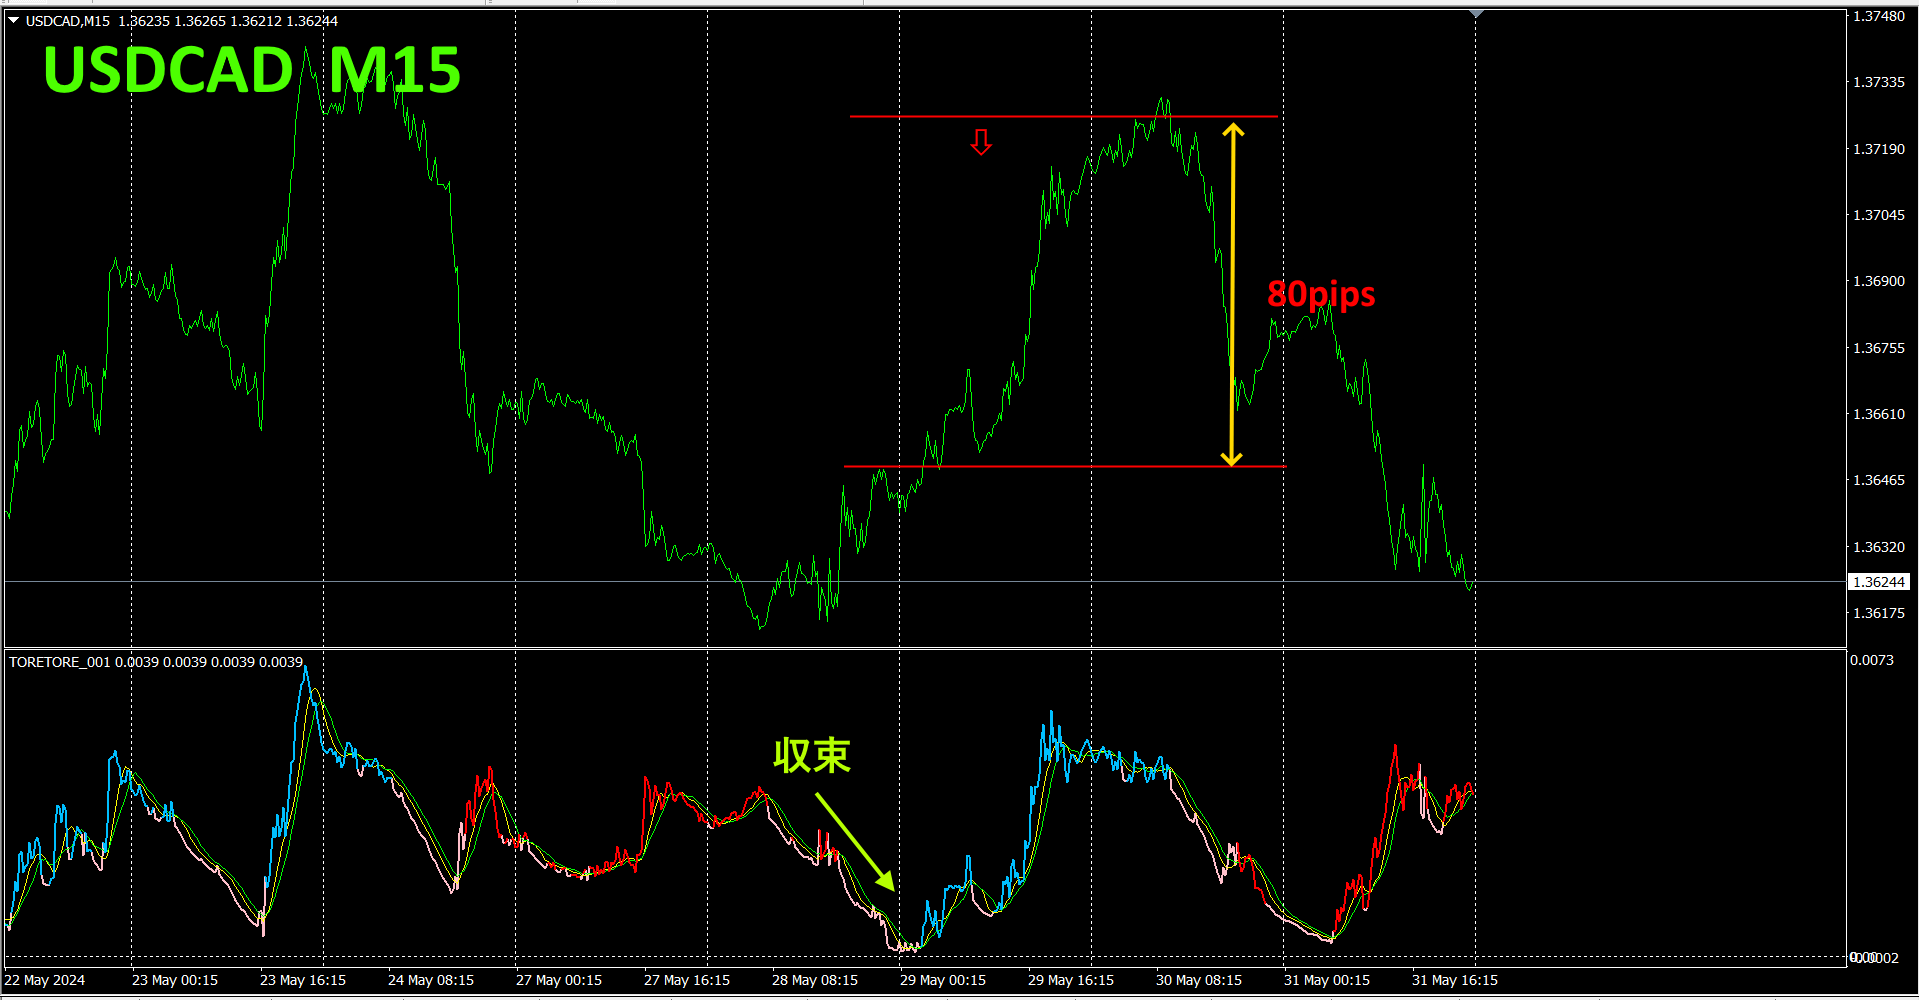
The red downward pointing arrow marks the screenshot point. The lower half is the Tore-tore Indicator; the most converged point on the Tore-tore Indicator is the perfect buying point.
Among currency pairs, is the most converged, and the point where contraction turns to expansion is the best buying point.
About of profit can be grabbed quickly.
Also, if you use the “TrendLine-EX,” you can place trades and wait for profit without intervention.
6.
Recommended Indicator
“”
https://www.gogojungle.co.jp/tools/indicators/42257
“8C Currency Strength Visualization Indicator

MT4 version https://www.gogojungle.co.jp/tools/indicators/39150
MT5 version https://www.gogojungle.co.jp/tools/indicators/39159
【My listed products】


