

Bitcoin (BTC) shows a temporary decline in price movement; what will happen to the price in the future? - October 3 Chart Analysis
In October, Bitcoin (BTC) attempted multiple contacts with the resistance line to push for price increases, but the resistance line functions powerfully. On October 2, it finally rebounded from the resistance line and began to move downward. Will Bitcoin continue to fall sharply in the future? Let's check the chart.
Bitcoin (BTC) that broke the support line shows strong downward momentum, making new lows
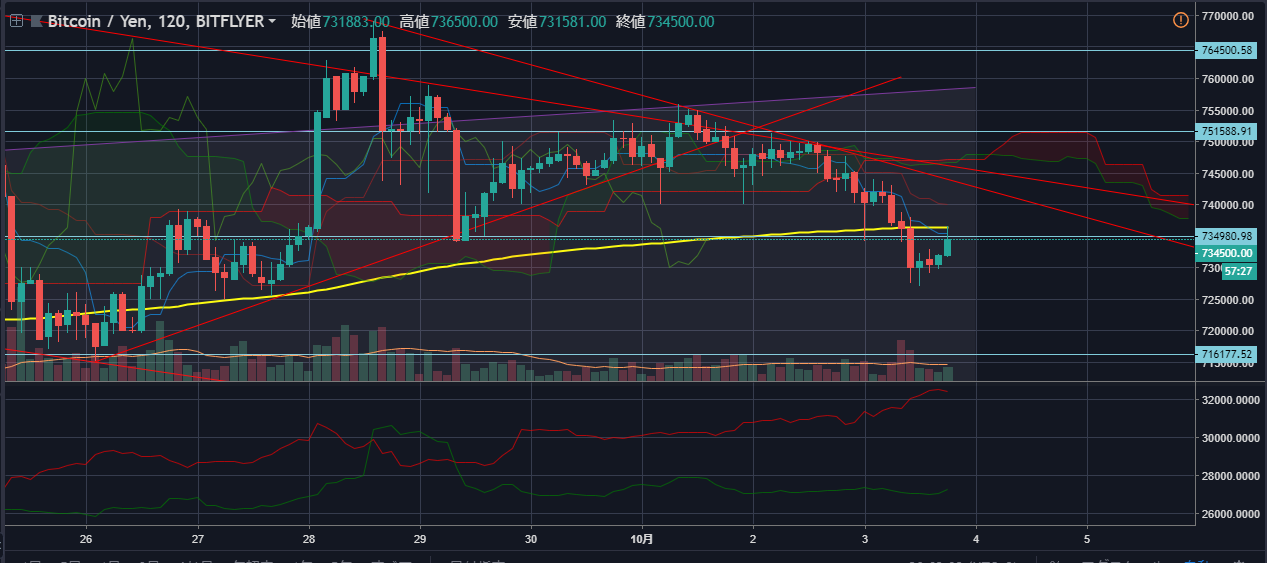
We will look at the BTC/JPY 2-hour chart. Up to October 1, BTC formed a pennant pattern, but on the chart of October 1 it did not push the lower price higher and stayed with a lower bound in the 740,000-yen range. By breaking the lower line, BTC negated the pennant pattern.
Furthermore, after that, BTC began to rebound repeatedly along the downward trend line since September 28. Although BTC attempted to break through the trend lines multiple times, on October 2 it finally fell back.
On October 3, BTC showed movement to break the support level in the 740,000-yen range for October and beyond. After the break, buy pressure joined BTC, temporarily recovering the price, but the downward momentum remained strong, resulting in a drop to the 720,000-yen range. As of today, October 3, BTC is again showing a recovery from the 720,000-yen range, returning the price to the 730,000-yen range.
We will check the BTC order ratios. In the early hours of October 3, with the support line broken, BTC selling orders rose significantly. It seems many short-term traders judged that BTC’s rise had run its course once the support line was broken. Many short-term traders tend not to hold orders for a long time. Therefore, going forward, attention will continue to be on the downward trend line that has existed since September 28. If BTC breaks the downward trend line, the selling orders, which may include a lot of short-term trades, could be significantly unwound.