
Misleading Ichimoku Chart
There is an error in the default settings of MT4’s Ichimoku Cloud. Where is it?
When I first learned of this fact, I was shocked.
I never expected the chart system to be wrong.
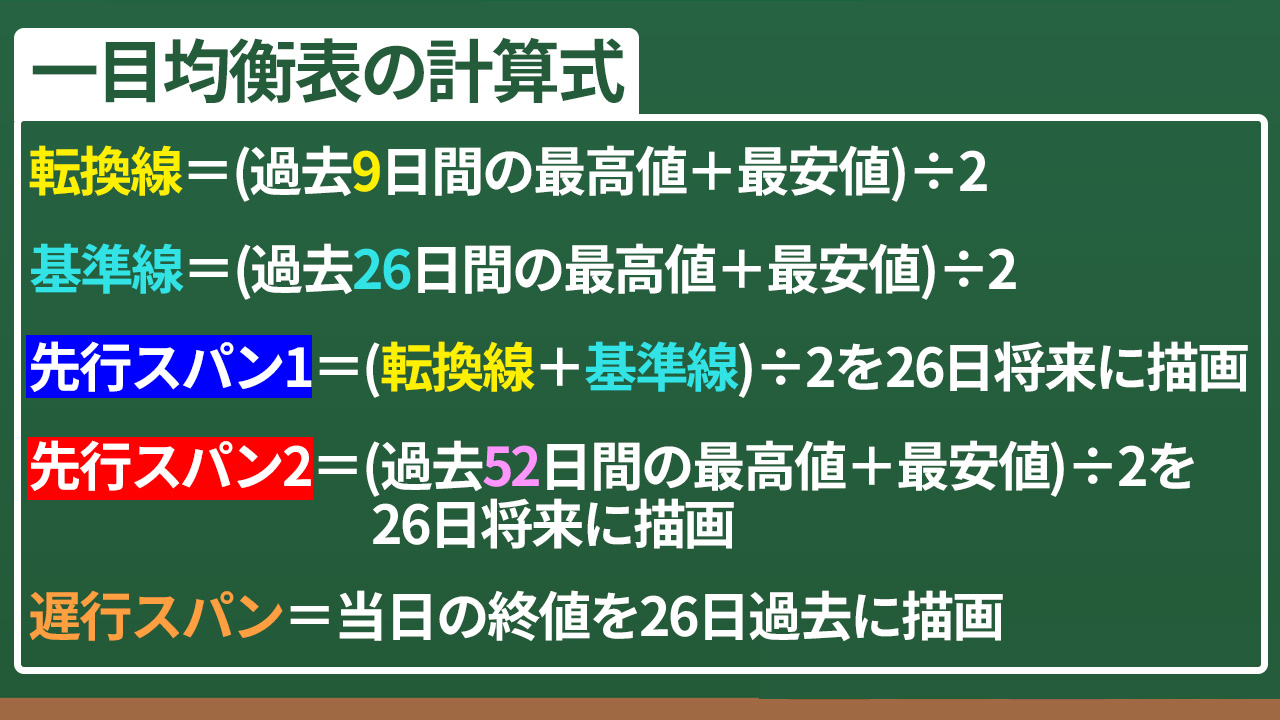
Ichimoku Cloud calculation formulas
・Conversion line = (highest high and lowest low over the past 9 days) ÷ 2
・Base line = (highest high and lowest low over the past 26 days) ÷ 2
・Leading Span 1 = (Conversion line + Base line) ÷ 2 plotted 26 days ahead
・Leading Span 2 = (highest high and lowest low over the past 52 days) ÷ 2 plotted 26 days ahead
・Lagging Span = closing price plotted 26 days in the past
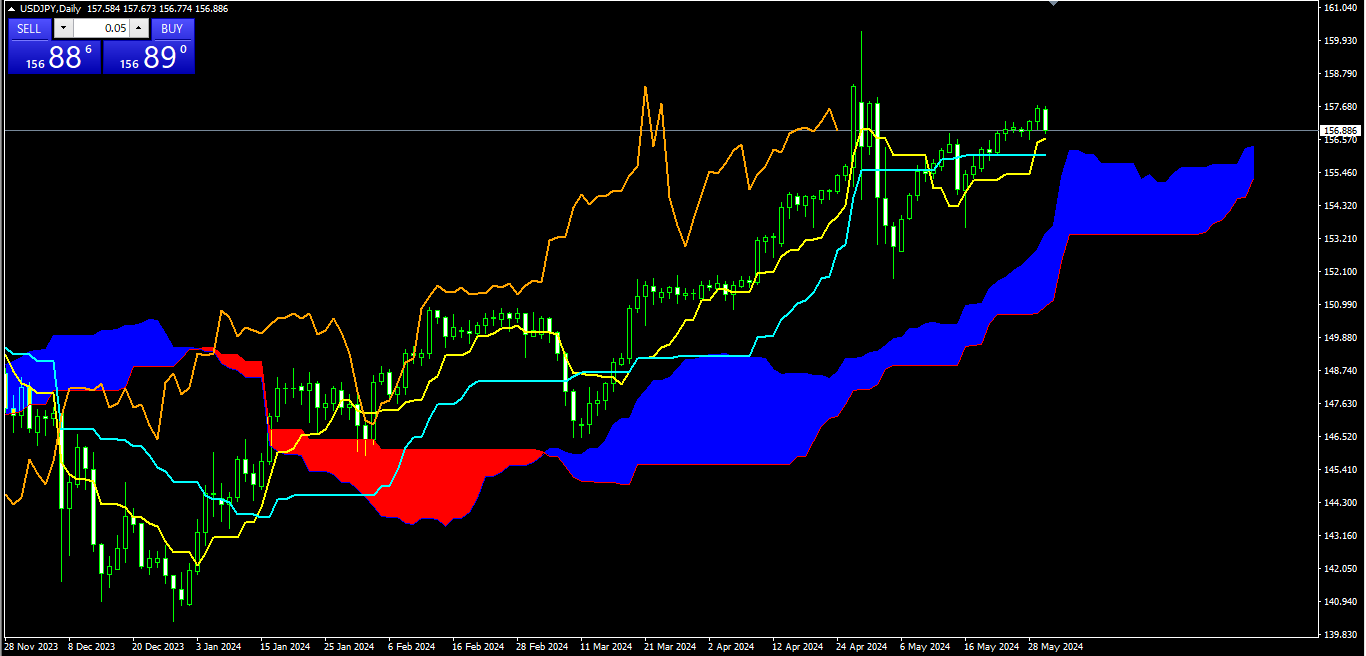
The MT4 standard setting makes the Leading Span and Lagging Span one day offset.
All five lines of the Ichimoku Cloud include the current day in their count.
However, in MT4’s default settings, the Leading Span is plotted 26 days ahead and the Lagging Span 26 days in the past, without including the current day.
Are the spans special? Not really—the Conversion Line and Base Line also include the current day and are calculated over the past 9 days and 26 days.
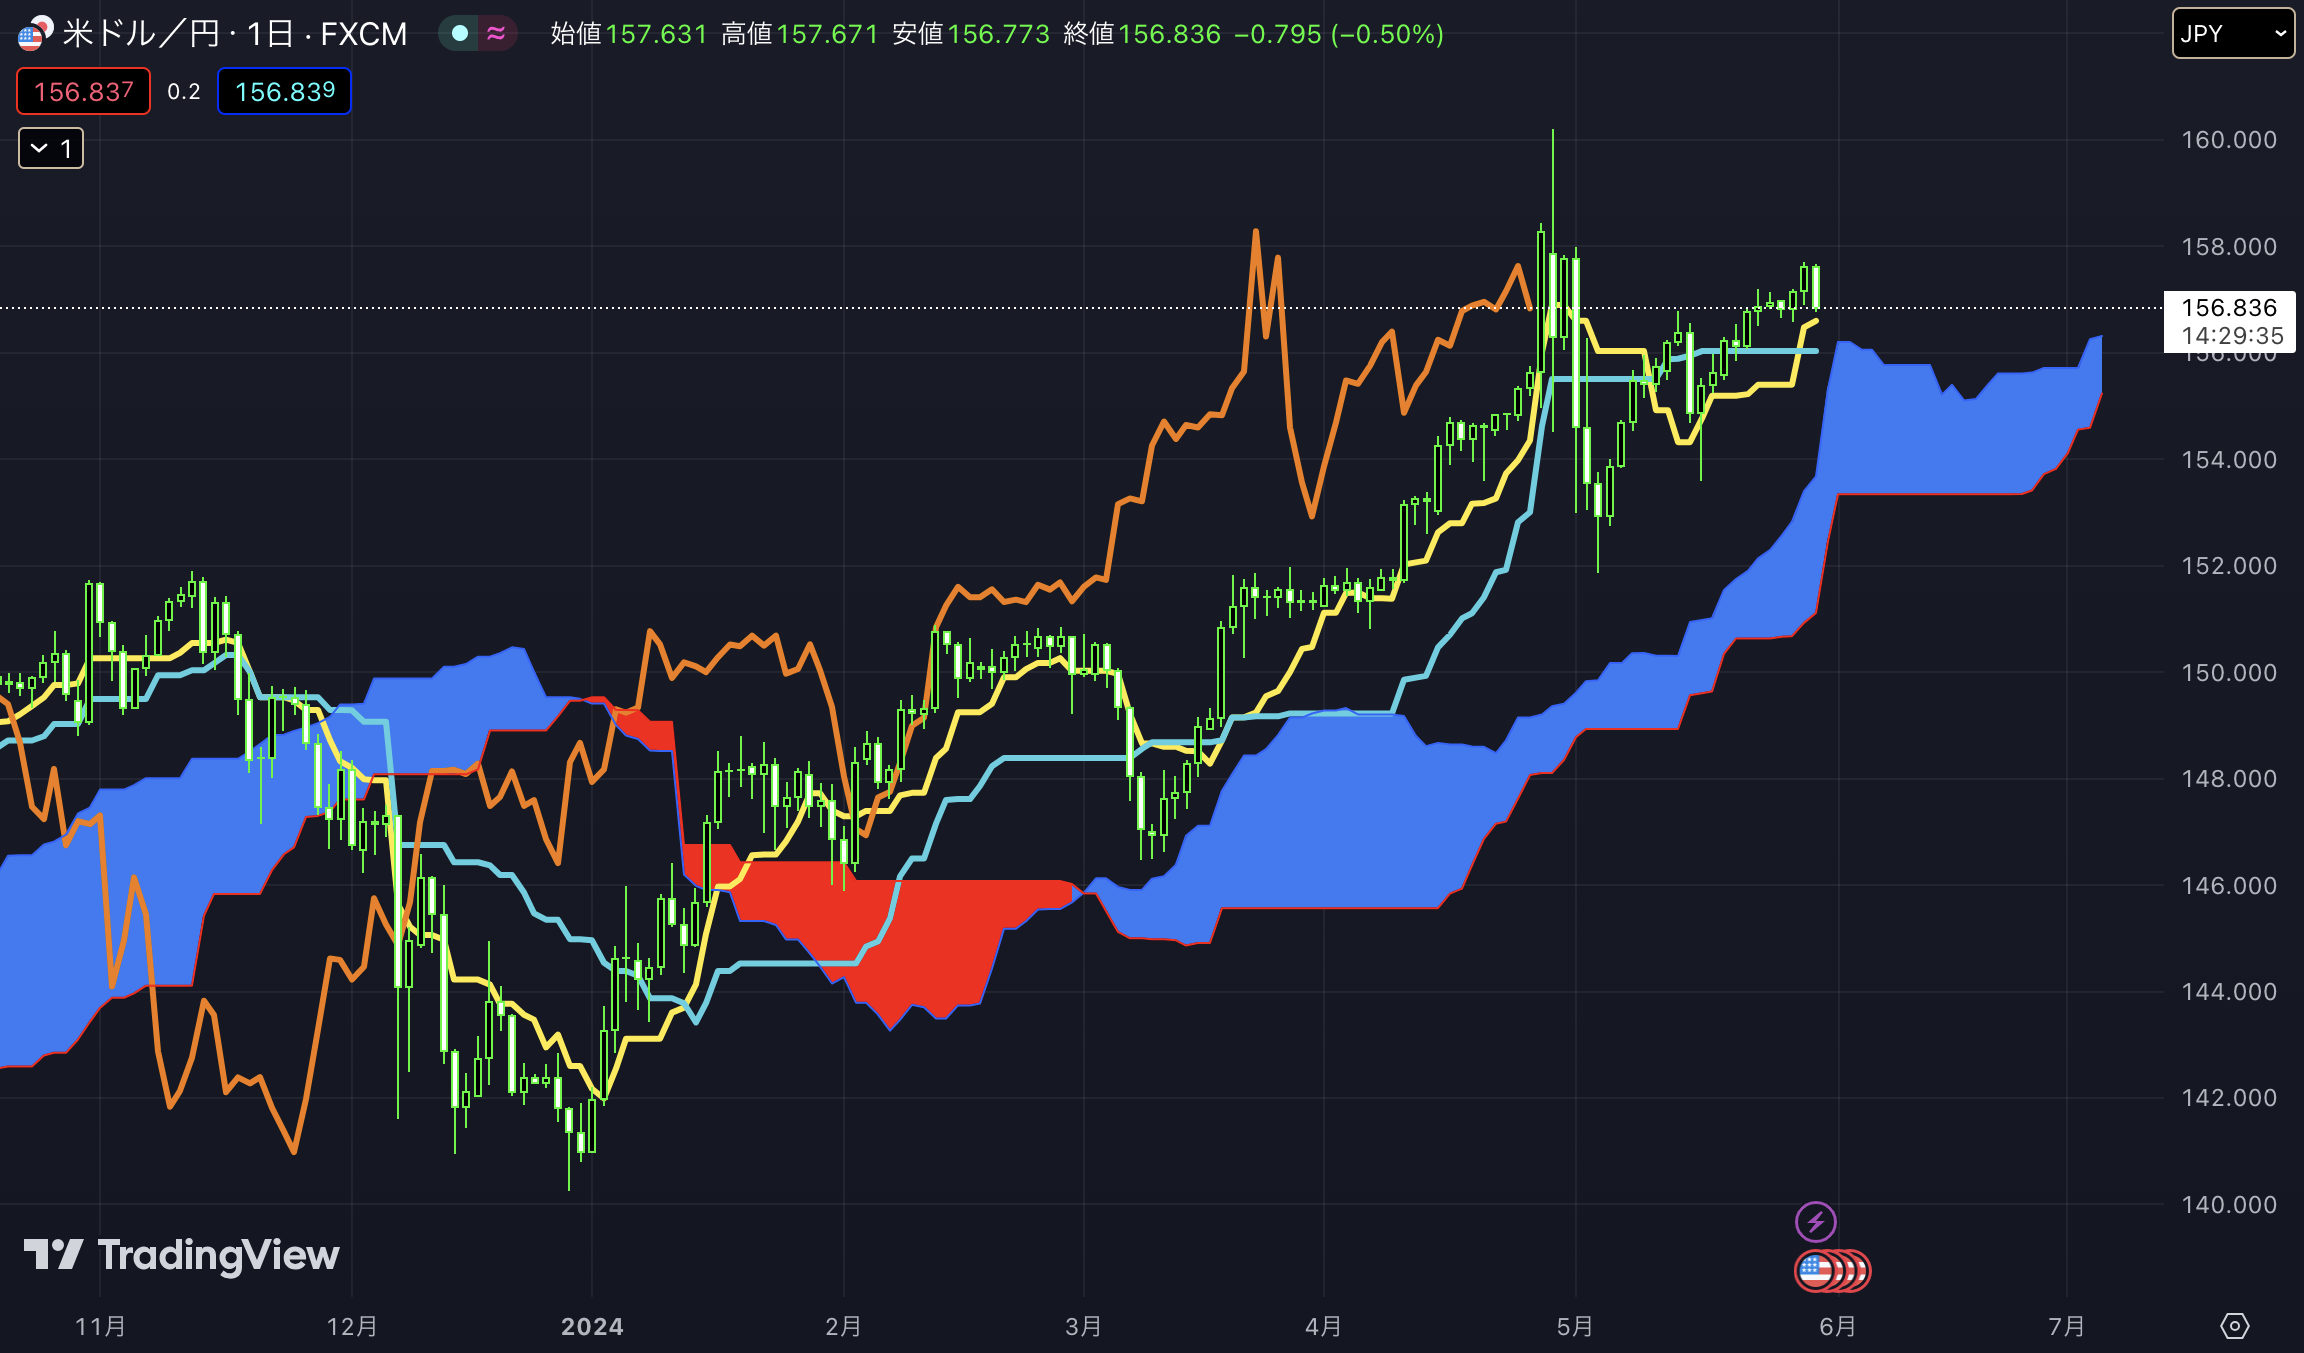
TradingView displays them correctly.
If you see explanations of Ichimoku Cloud on the internet or in books mentioning “the cloud.”
However, in the original Ichimoku Cloud, there is no expression of a cloud at all.
Many buy/sell signal explanations for technical indicators circulating in the world are incorrect, but in particular, misconceptions about the Ichimoku Cloud are especially pronounced.
For those who are planning to study Ichimoku Cloud from now on, I recommend the column and videos by Instructor Kojirou.
Chart analysis pioneer Instructor Kojirou’s “FX Market Interpreted with Ichimoku Cloud”