Correct usage of RSI
In the previous article, I explained the problems of RSI.
This time, I will explain the correct way to use RSI.
Abbreviation for Relative Strength Index, it is called “Relative Strength Index” in Japanese.
It is an indicator that shows which force—buying or selling—is stronger.
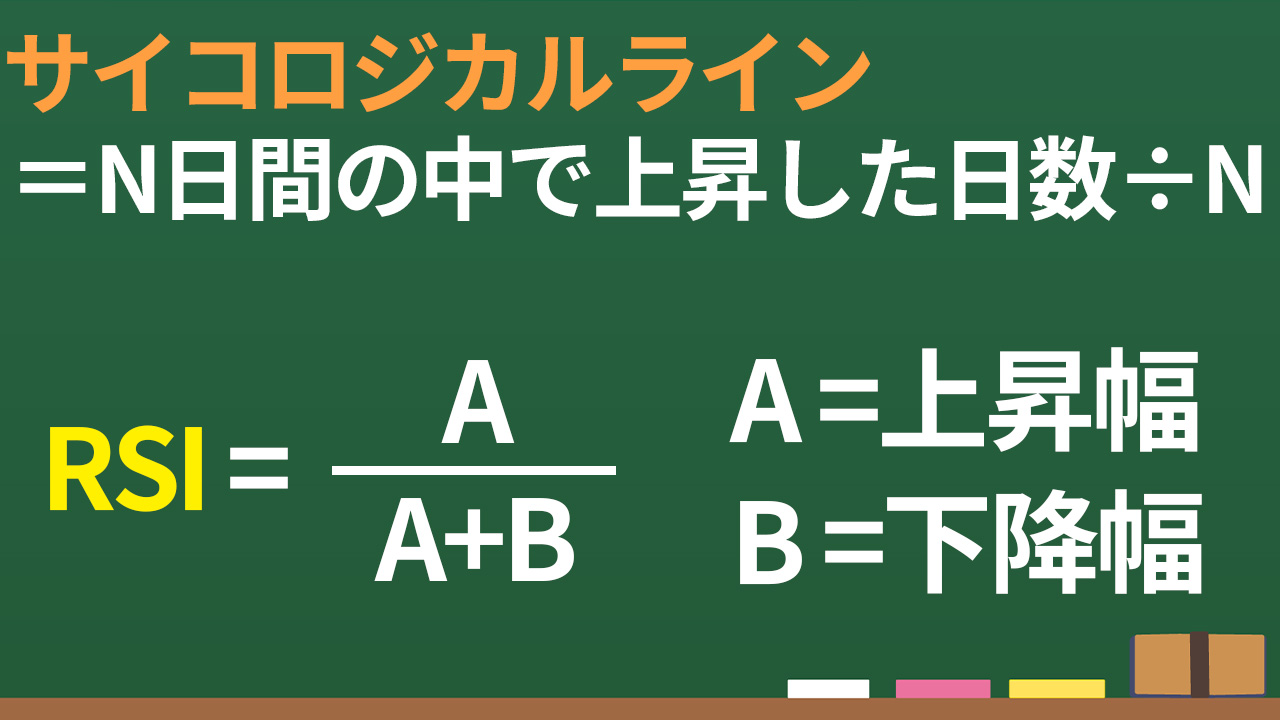
When I tried to express buying momentum numerically, simply counting the number of rising days was the Psychical Line.
Among 10 days, if there are 9 days with a day-over-day increase, it would be 90%.
However, for example, in a case where it rises by 10 yen for 9 days and drops 90 yen on the 10th day, it doesn’t accurately reflect buying momentum.

Therefore, instead of counting how many days it rose or fell, it might be more accurate to express buying and selling forces by how much it rose or fell in total during the period.
Let’s look at RSI with a concrete example.
The standard RSI parameter is 14 days, so we consider 14 days of price movement.
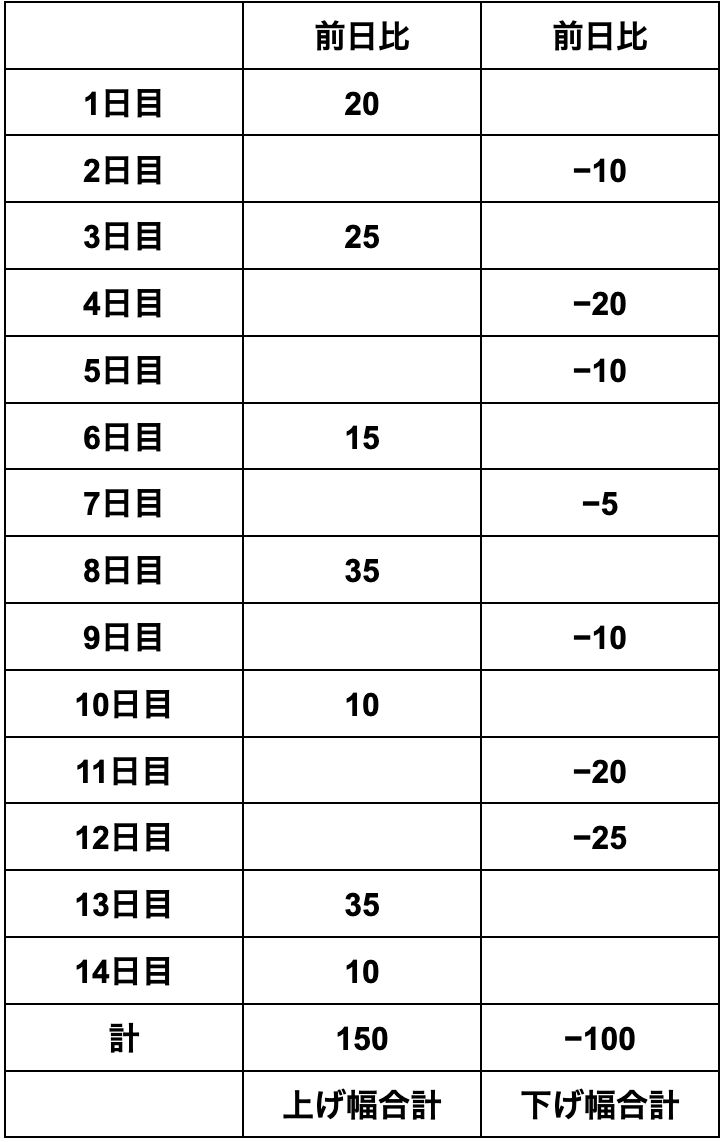
RSI = Upward range ÷ (Upward range + Downward range)
= 150 ÷ (150 + 100)
= 0.6
That is, 60%.
In a previous article, I posed a question about the Stochastic oscillator.
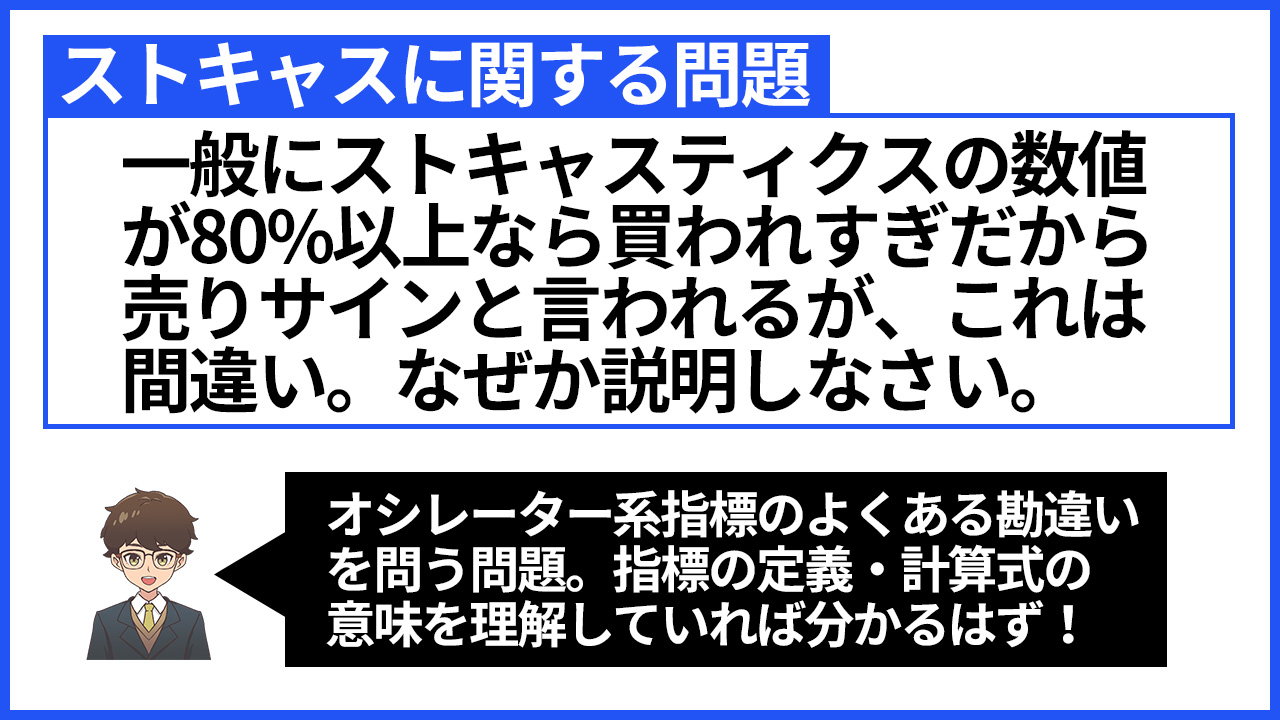
Similarly, for RSI, it is often said
“If it is above 70, it is overbought, so it signals to sell”
Let’s understand the definition and the meaning of the calculation of technical indicators and learn to use them correctly.
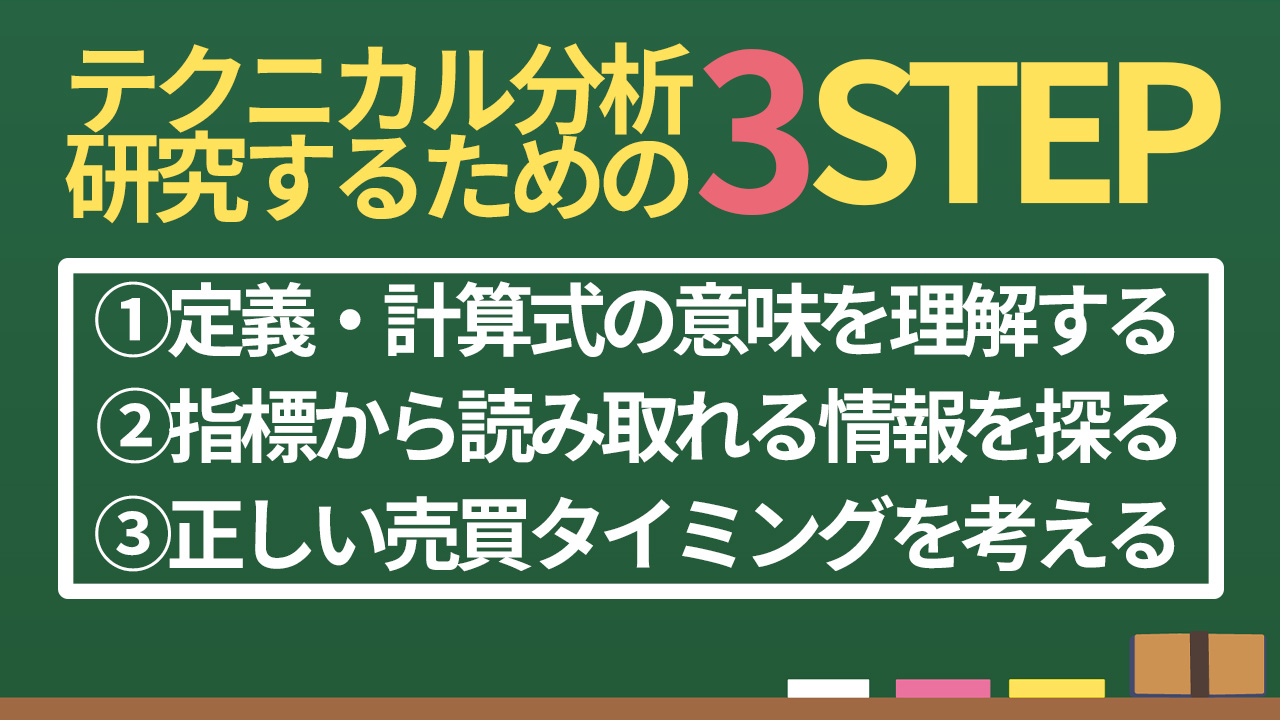
We will apply these 3 steps to RSI.
① The RSI definition is Upward range ÷ (Upward range + Downward range)
The basic period is 14 days.
② Among the price movements in the past 14 days, what percentage is upward?
③ In other words,
50% or more is a bullish situation
Less than 50% is a bearish situation
70% or more is a strong bullish situation
30% or less is a strong bearish situation
Where do these 30 and 70 numbers come from?
If a price range is constant, rising for 2 days and falling for 1 day constitutes a stable uptrend.
In that case, two-thirds of the overall price movement is upward, so RSI = 66.6.
Conversely, if it declines for 2 days and rises for 1 day, that is a stable downtrend, and RSI = 33.3.
RSI exceeding 70 indicates a value larger than stable upward movement, which is why it is said to be overbought.
RSI below 30 is the same in reverse.
However, being overbought does not automatically become a sell signal.
Rather, it indicates a strong upward momentum in an uptrend.
If it goes above 70 and then falls below 70, that means the uptrend momentum has weakened, but it does not immediately become a downtrend.
Weakening upward momentum ≠ sell signal
To use RSI correctly, you need to understand whether the trend is at its beginning or near its end.
Let’s look at the difference between Stochastic and RSI.
They are both oscillator-type indicators, but the meaning of the same value differs.
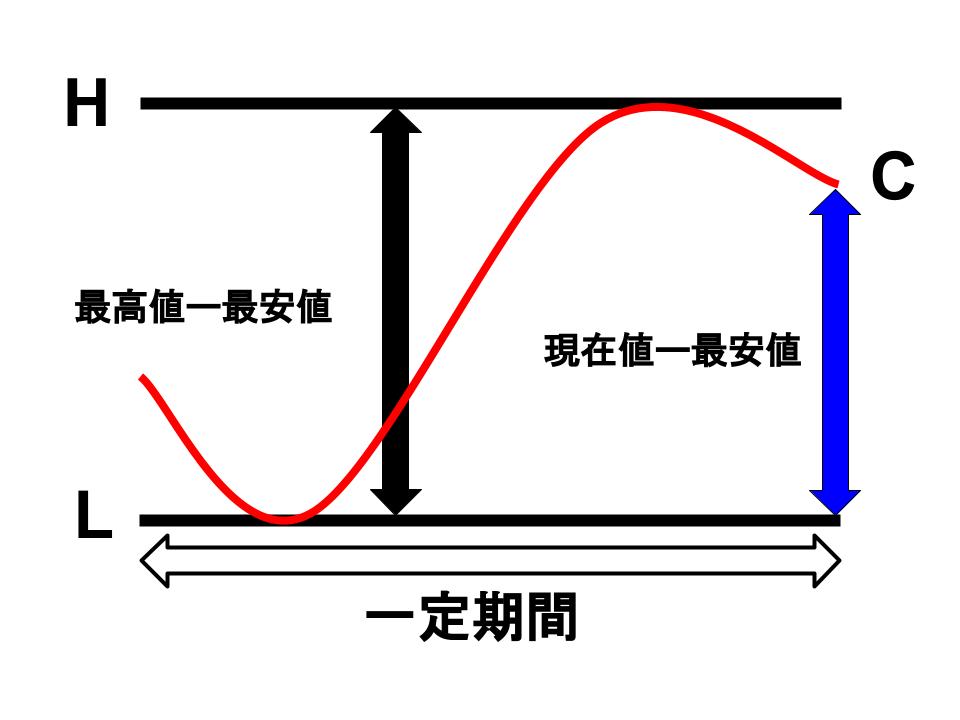
The definition of Stochastic is, as shown above,
%K = (Current price - Lowest price) ÷ (Highest price - Lowest price)
If the current price is the highest price, %K becomes 100%.
If RSI is 100%, it means it rose for 14 days in a row.
From these facts, it is clear that Stochastic easily reaches 100, but RSI rarely reaches 100.
RSI generally does not reach extreme high or low values. Stochastic can reach them easily.
However, it is important to note that simply having a high value does not automatically mean a sell signal.
That would indicate only very strong upward momentum, so using it pointlessly as a counter-trend signal is not good.
【RSI Summary】
RSI is an indicator that shows the balance of buying vs selling over a certain period.
・50% or more indicates buying pressure
・Less than 50% indicates selling pressure
Being above 70% does not automatically mean overbought and a sell signal; rather, it indicates strong upward momentum.
Be aware that the meaning of the values changes depending on whether you are at the early or late stage of a trend.