

Utilization of the "Visualization Indicator" (Part 148)
"Visualization Indicator" usage (part148)
1. Further evolve the "28 Currency Pairs List Indicator" into an Indicator
"8CP Visualization Indicator to draw GBPAUDGBPAUD on the chart
The "8CP Visualization Indicator" comes in Oceania, London, New York, and AnyCP versions. This time, the Oceania version was used.Oceania edition,London edition,NewYork edition,AnyCP edition. This time, the Oceania
The upper half is the 15-minute chart of GBPAUD. The lower half is the one based on the “8 CP Visualization Indicator,” where the orange thick line graph corresponds to GBPAUD.GBPAUD の分足チャートです。下半分は、「8CP見える化インジケータ」によるものです、橙色太線のグラフがGBPAUDに相当します。
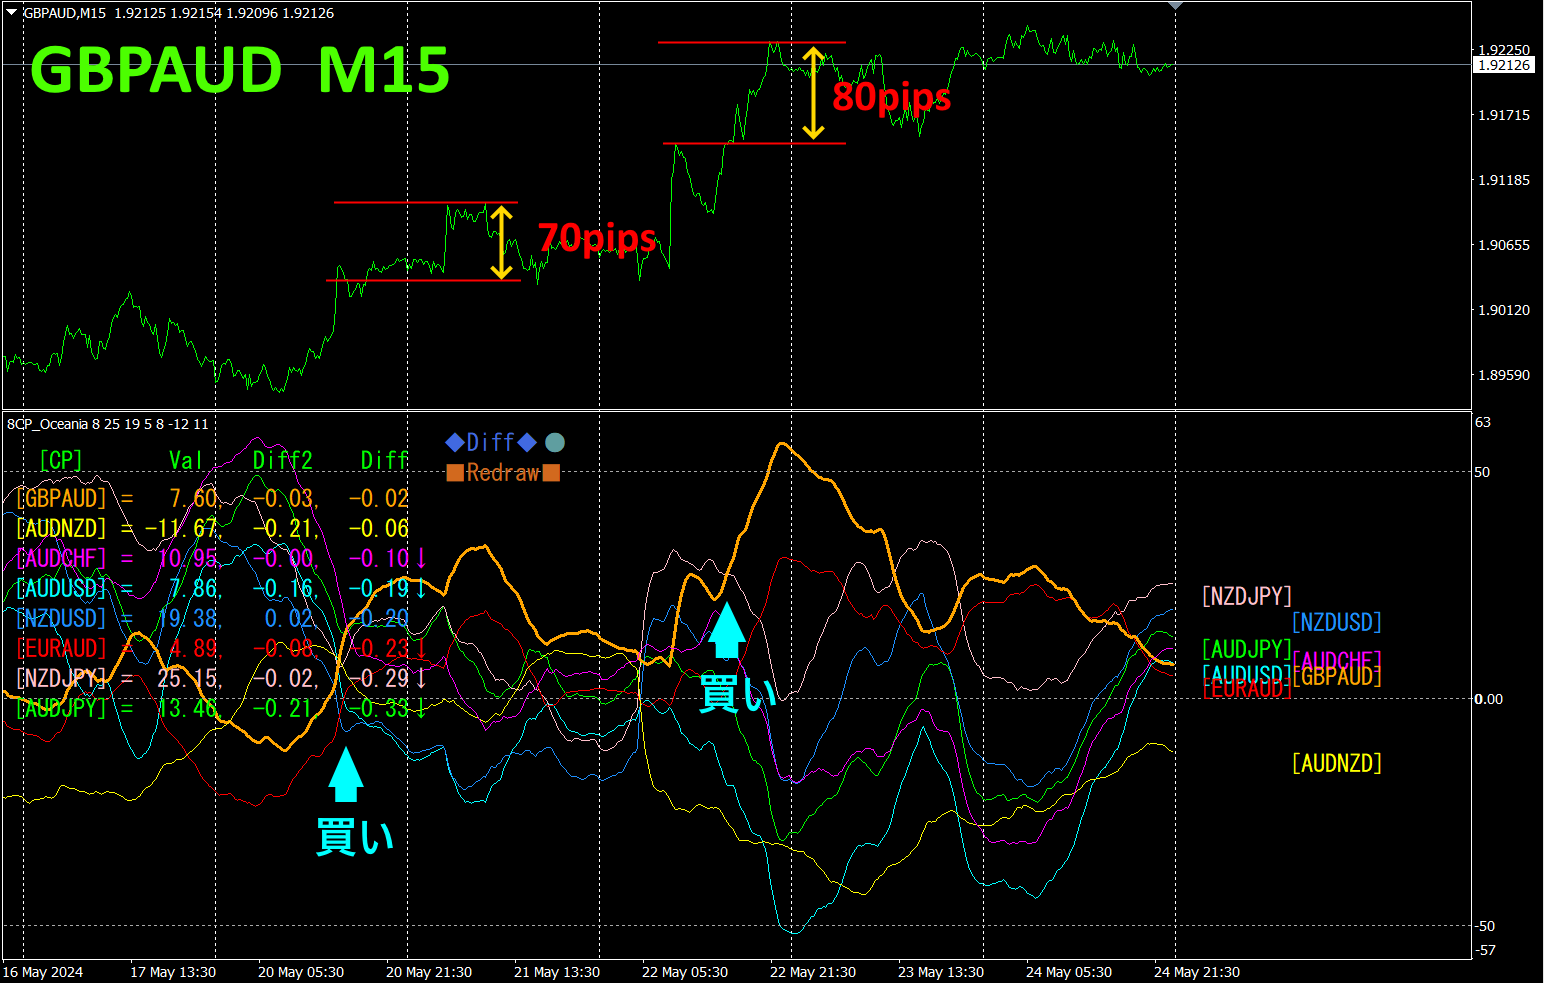
On Monday and Wednesday, GBPAUD broke above from other graph groups, so we entered a buy. We will exit when the “Visualization Indicator” peaks.70pips+80pips total, about150pips profit was achieved.
If you use the “TrendLine-EX,” entry and exit can be automated by breaking the diagonal trend line. It can be left as is for easy trading. “TrendLine-EX” is a semi-automatic EA that sells automatically when the trend line breaks below, and automatically closes when it breaks above.TrendLine-EX can automatically sell on a break below the trend line, and automatically close on a break above, making it a semi-automatic EA.
※ Recommended Indicator
For semi-automaticEA, the “Trend Line EX” allows you to draw diagonal lower-lines and, when it breaks above, automatically buy, and when it breaks above, automatically exit, enabling a hands-off trading approach.
“Trend Line EX
https://www.gogojungle.co.jp/tools/indicators/42257

2. Best Select try the indicator
The figure below is a screenshot fromMay 22, 2024 at 11:44(JST
[Total]Ranked by value descending. On the top row, NZDJPY is blue on all timeframes. In addition, the) value is 3919.88, a large positive figure. This indicates a strong uptrend for NZDJPY. shows a strong upward trend.
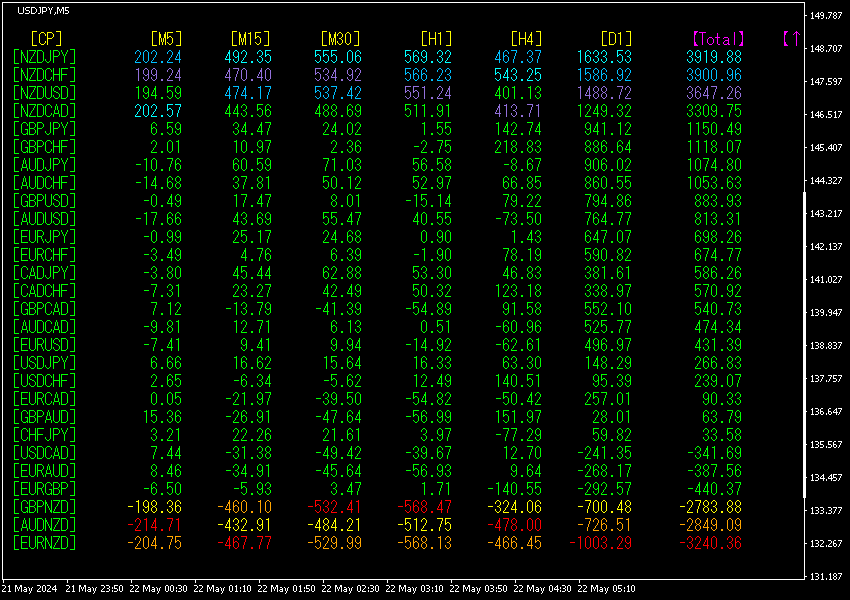
Now, let's look at the NZDJPY chart.
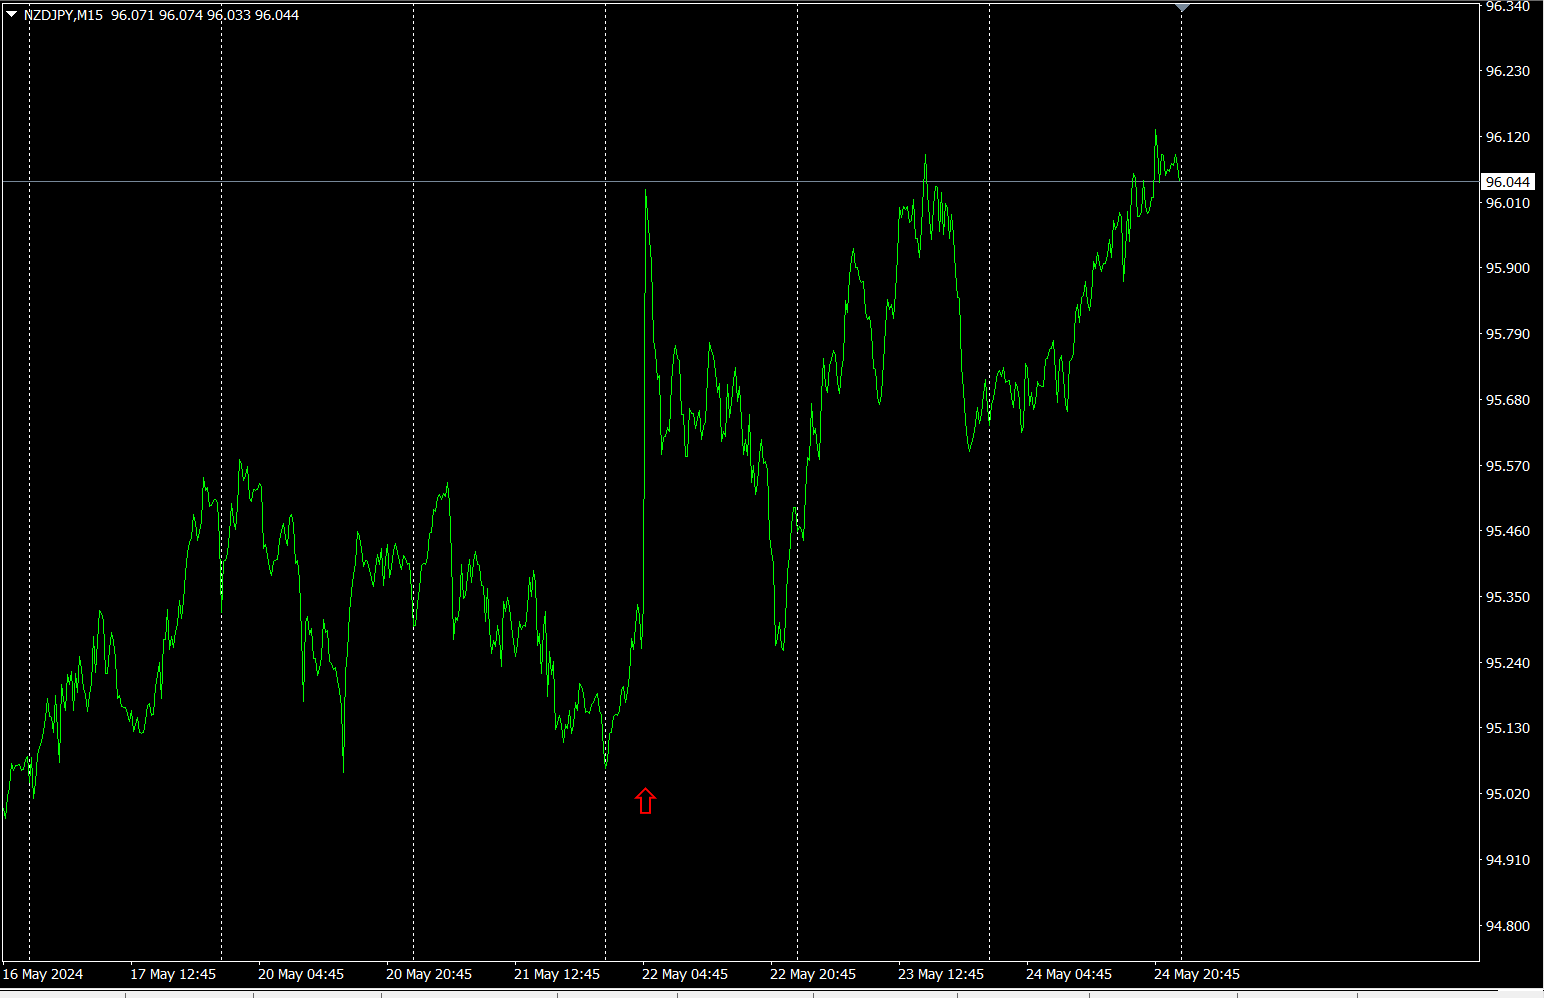
The red arrows mark the point where the screenshot was taken, where there is a sharp rise. It is likely due to indicators or announcements. Checking later, on May 22 at 11:00, there was a policy rate announcement by the RBNZ (Reserve Bank of New Zealand).5月22日の11:00に、RBNZ(ニュージーランド準備銀行)の政策金利発表がありました。
“28通貨ペアBest Select28通貨ペアの中で、最もトレンドが発生している通貨がどれかを容易に発見することができます。また、今、トレードをすべきか否かを、数値と色で教えてくれます。全通貨ペアの動向を一目で判断することができる優れたインジケータです。
“28通貨ペアBest Selectインジケータ”
https://www.gogojungle.co.jp/tools/indicators/35128

3. 2021년5月から追っているEURJPY
2021年5月からEURJPYの動きを追っています。
全体の流れを見るため、30分足チャートで直近約3週間分を描いています。
前回は、次のように書きました。
JPYはEURよりも下に位置しているので、通貨としては弱いのですが、方向性としてはJPYがやや上、EURがやや下に向いているので、EURJPYは、やや下げ方向に向かうと考えられます。ただ、基本はEUR>JPYなので、その後、EURJPYは上昇することになるでしょう。
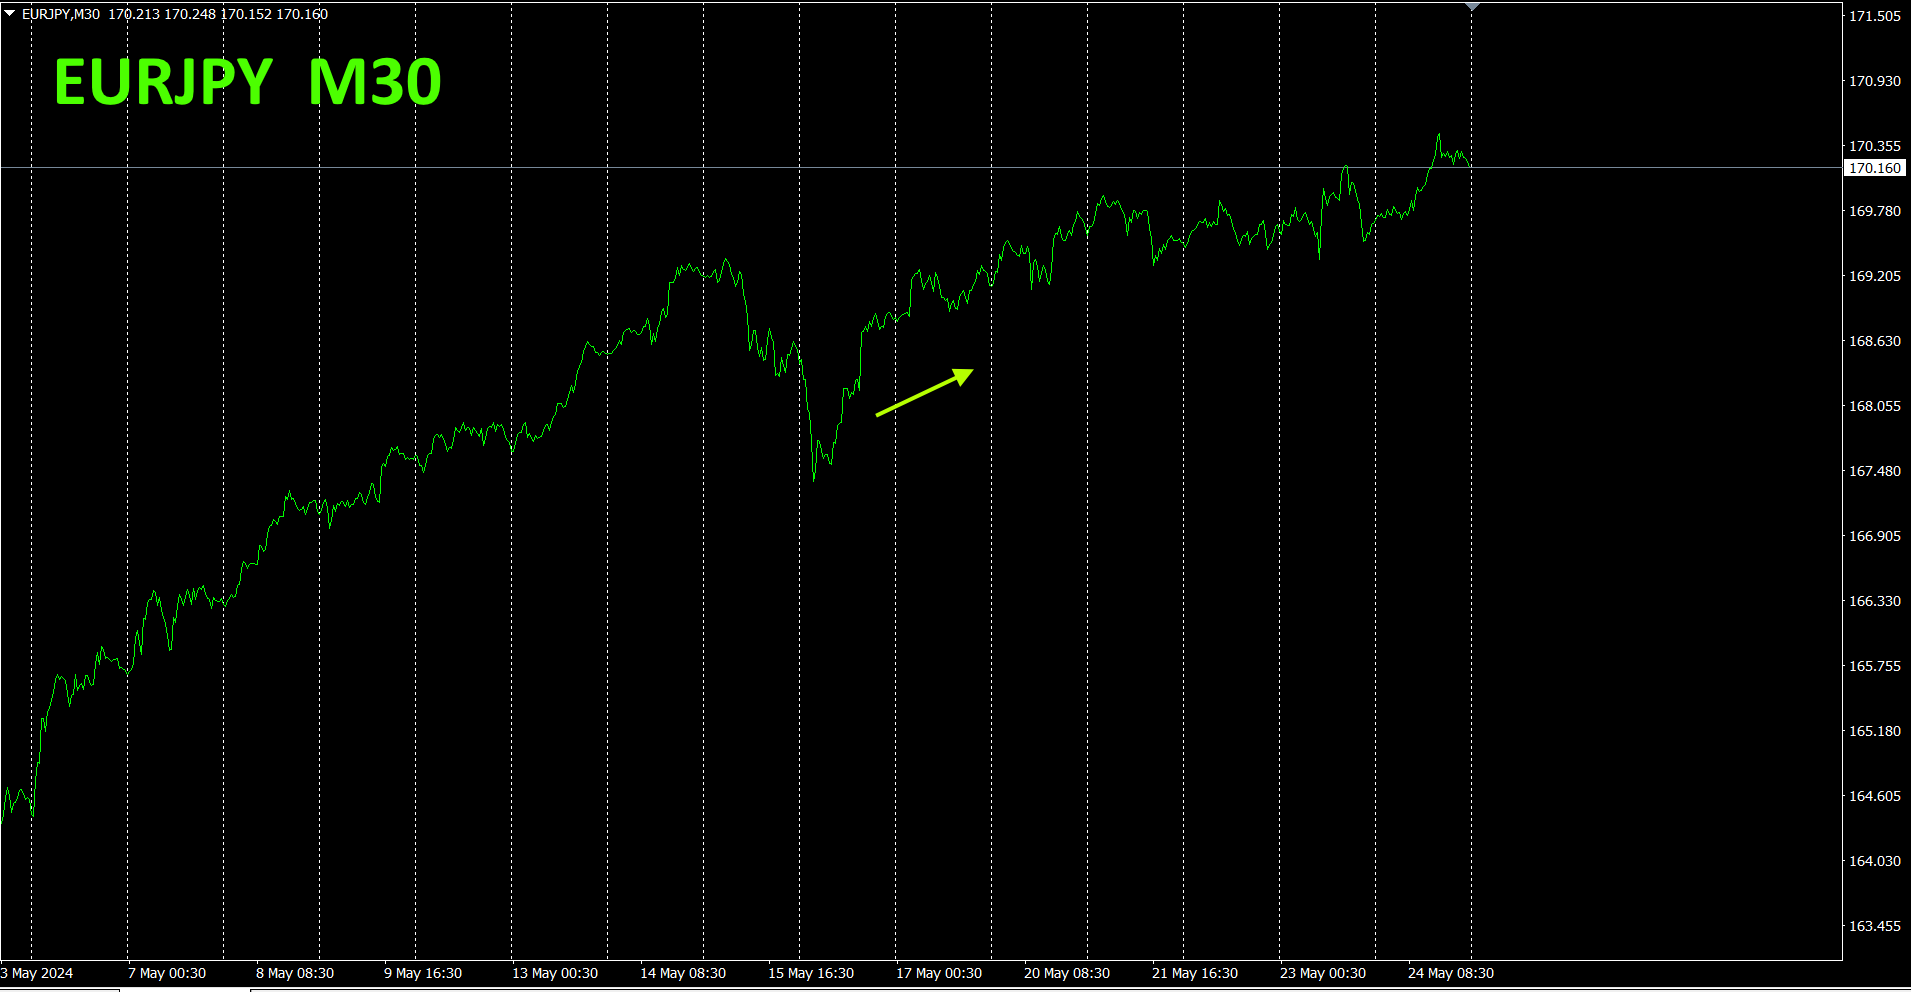
やはり、緩やかですが上昇傾向にあります。
30分足の通貨強弱チャートです。
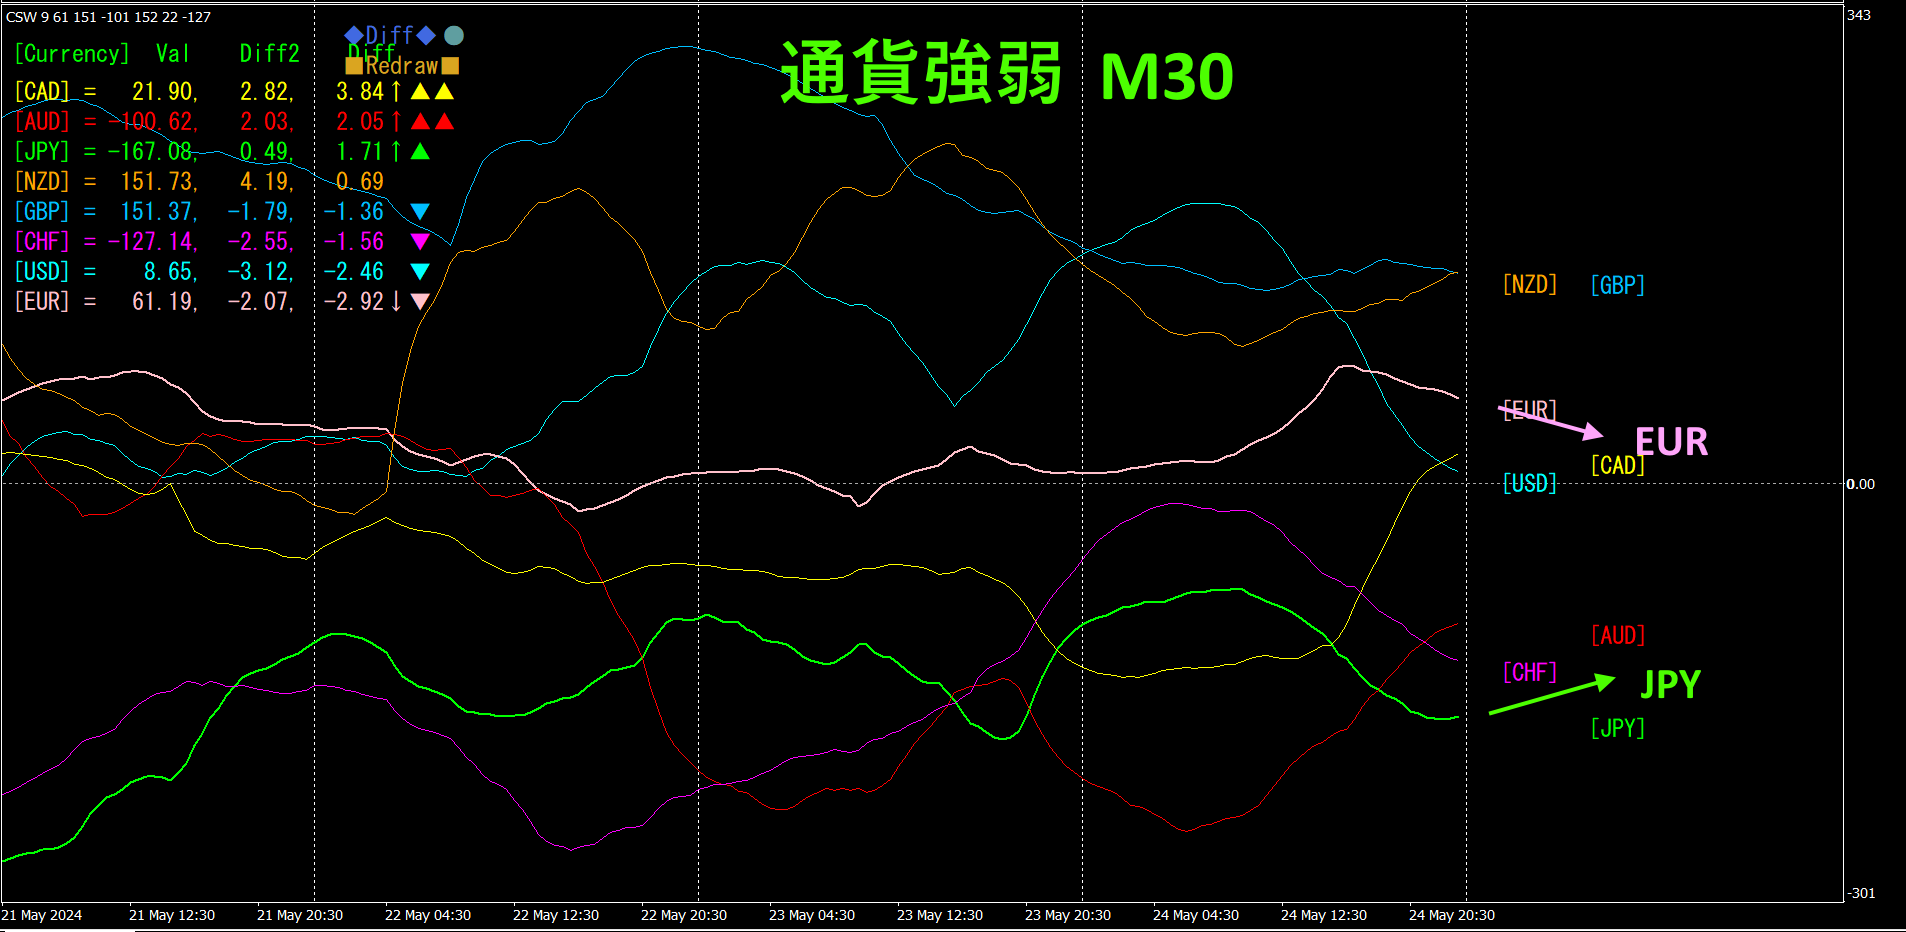
ピンク色がEUR、緑色がJPYはEURよりも下に位置しているので、通貨としては弱いのですが、方向性としてはJPYが少し上に、EURが少し下に向いているので、EURJPYは、上昇が抑えられて、やや下方向に向かうと考えられます。ただ、基本はEUR>JPYなので、その後、EURJPYは上昇することになるでしょう。
4. Two new indicators have been released.
“Toretore Indicator” and “Toretore 28CP_Select Indicator.”
These are based on viewing the market as waves and trading only in the direction of convergence turning into divergence, and not trading at other times.

Please refer to the product page below.
“Toretore Indicator”
https://www.gogojungle.co.jp/tools/indicators/50115
“Toretore Indicator”28CP_Select
https://www.gogojungle.co.jp/tools/indicators/50203
5.
Actual trades using the “Toretore Indicator”
The figure below is a screenshot of the “Toretore 28CP_Select Indicator” captured on 20, 2024 09:00“Toretore28CP_Select Indicator.”
In the topmost row, EURGBP shows the most convergence among the 28 currency pairs. Moreover, M5, M15, and H1 are red, indicating a downward direction.
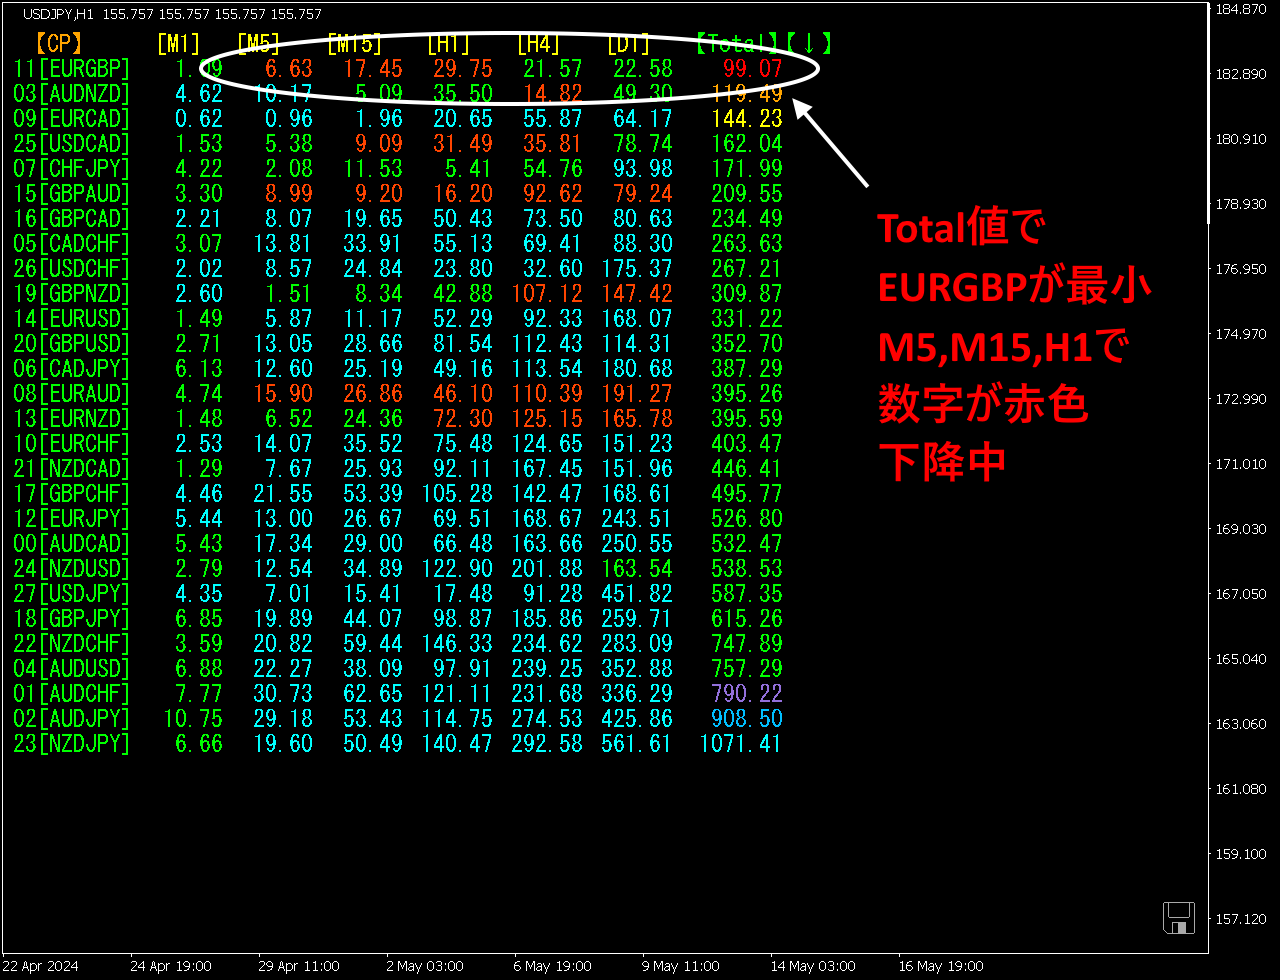
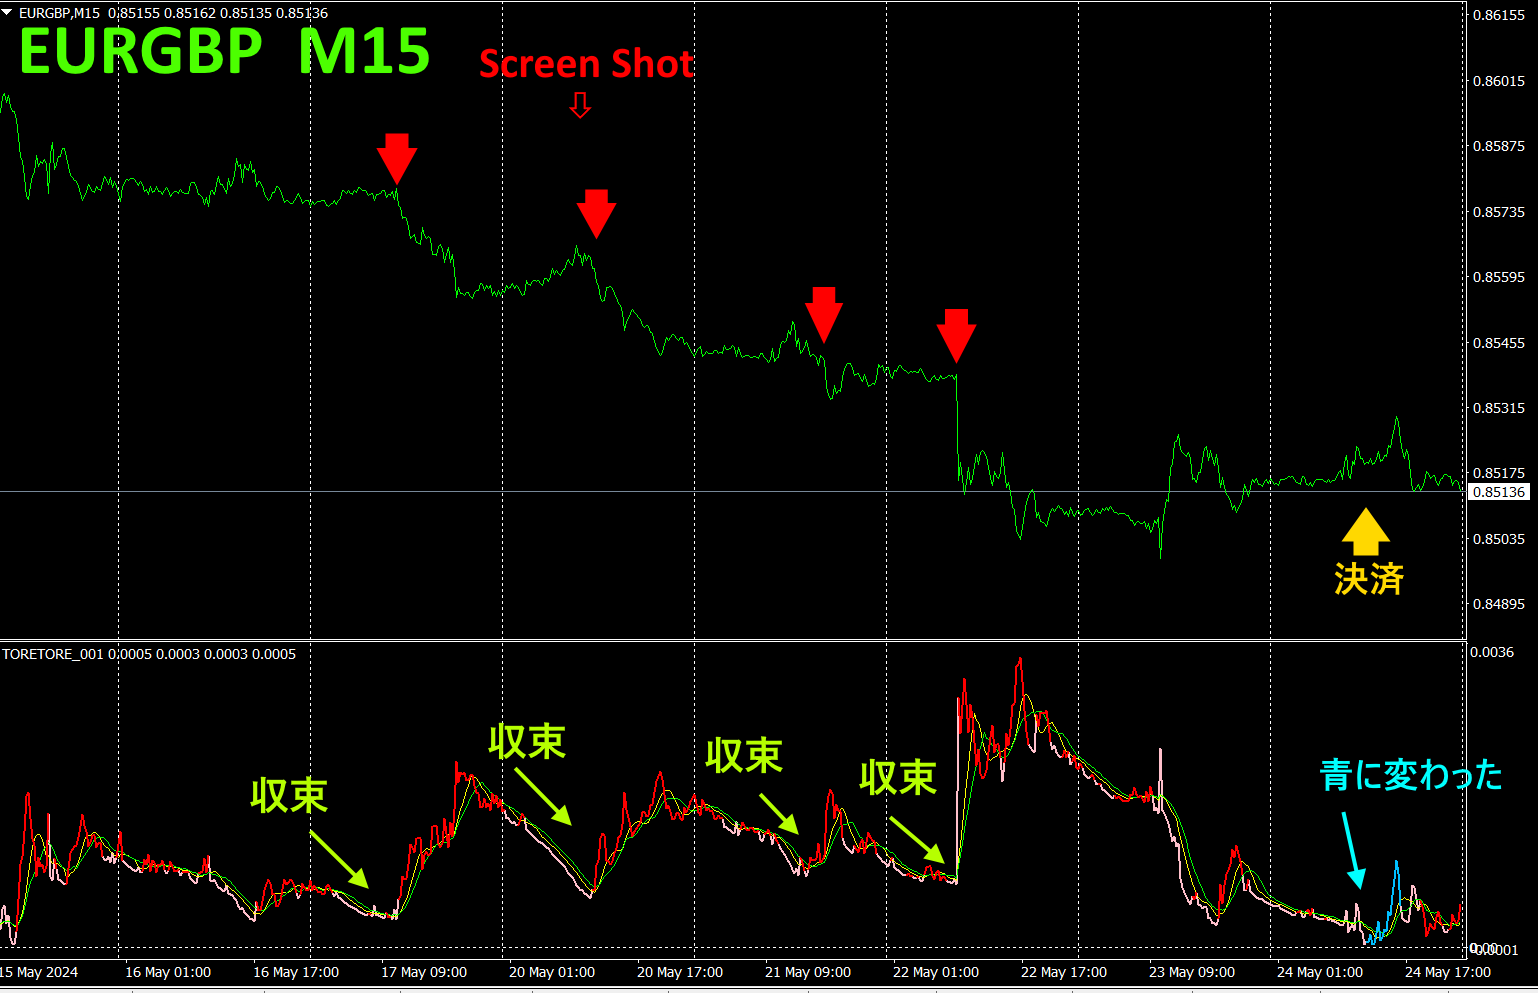
The red downward arrow marks the area where the screenshot was taken.
The bottom half shows the “Toretore Indicator.” The convergence point at four places is clearly an excellent selling point. currency pairs, EURGBP is the most converged, and since multiple timeframes show red, the direction is downward. Looking at the chart, the overall trend is downward; selling at any point yields profit. By placing a sell position at the convergence point of the “Toretore Indicator,” one can ride the market trend with the classic trade approach. Settlements are completed when the main line of the “Toretore Indicator” turns blue.
Also, if you set up the “TrendLine-EX,” you can wait for profit with zero maintenance.
6.
Recommended indicators
Please refer to the page for the “8C Currency Strength Visualization Indicator.”

MT4 version https://www.gogojungle.co.jp/tools/indicators/39150
MT5 version https://www.gogojungle.co.jp/tools/indicators/39159
【My listed products】


