

Issues with RSI
Issues regarding RSI
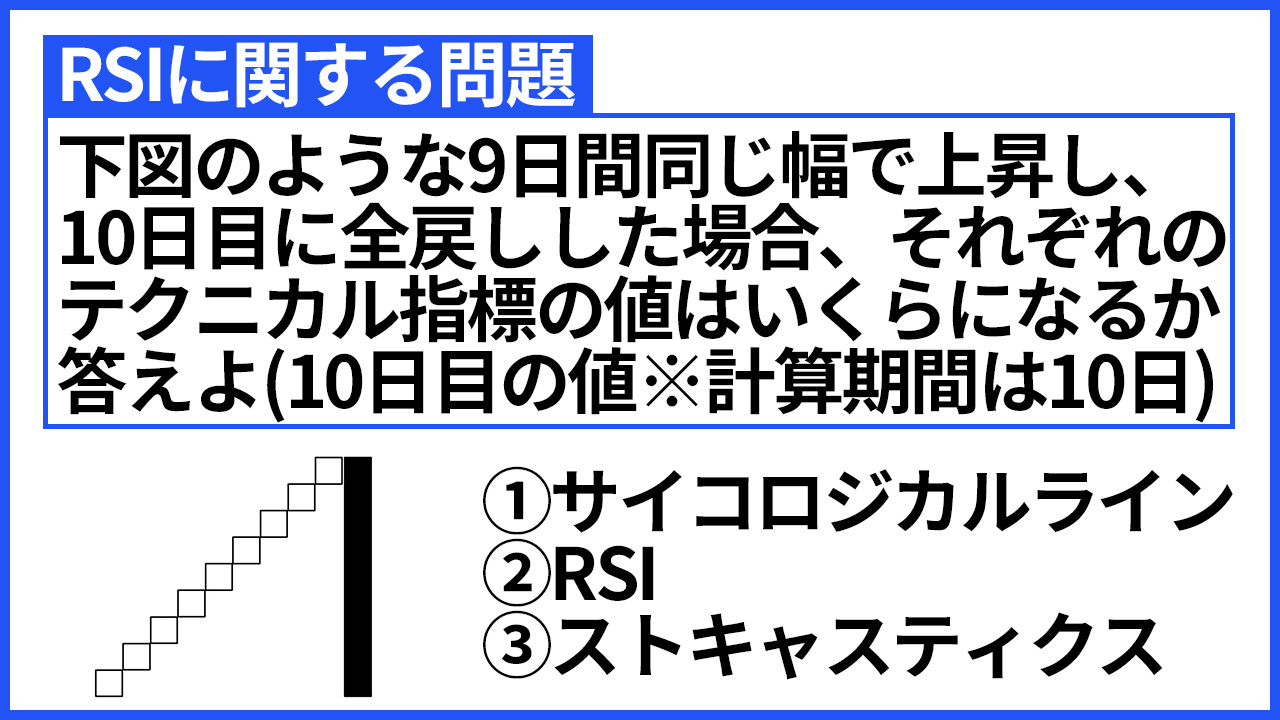
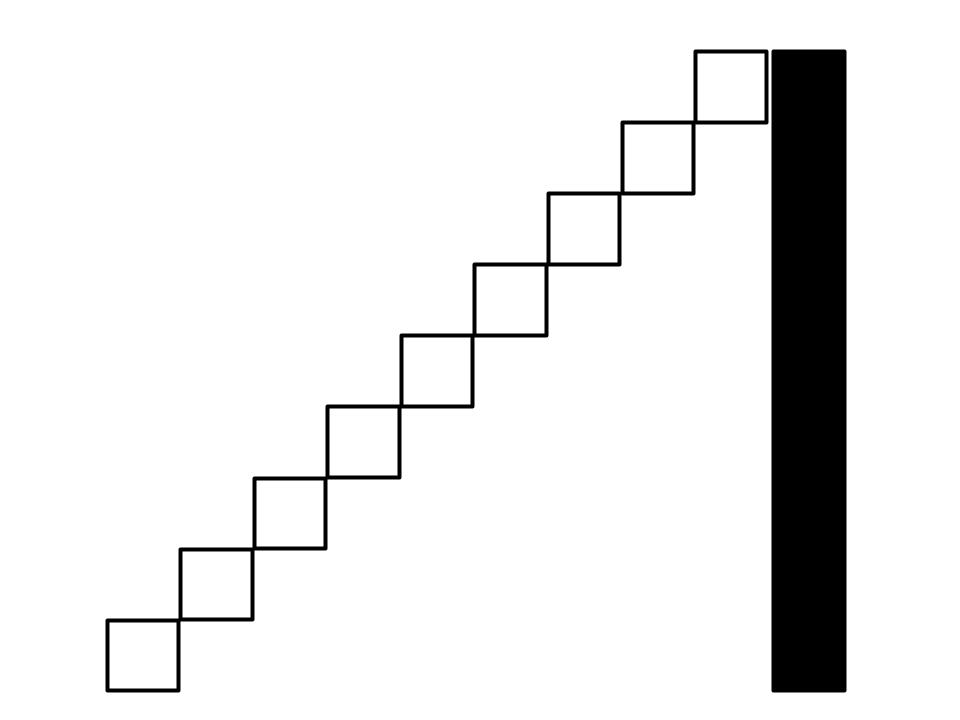
“If the price rises by the same amount for nine days as shown in the figure and then fully retraces on day 10, what are the values of each technical indicator (value on day 10; calculation period is 10 days)?”

① Psycological line
② RSI
③ Stochastics
To illustrate with concrete numbers,
From day 1 to day 9, prices rise by 10 yen each day, and on day 10 they fall by 90 yen.
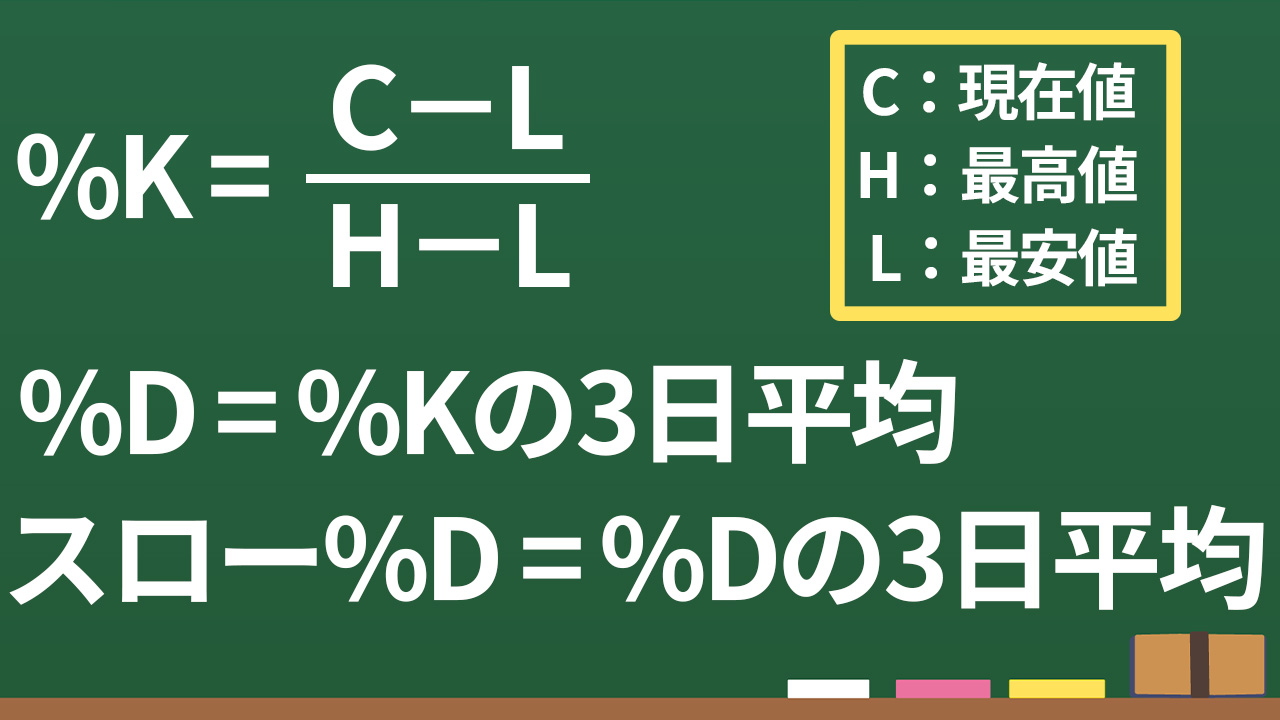
For the Stochastics, calculate the %K value.
Assume there are no wicks.
The purpose of this problem is to help you understand the differences among oscillator-type indicators.
Answer
① 90%
② 50%
③ 0%
Explanation
※ Note
In the calculation formulas for oscillator-type indicators, multiplying by 100 is sometimes used to express them as percentages. 0.5 and 50% have the same meaning.
“Psycological” means psychological (mental).
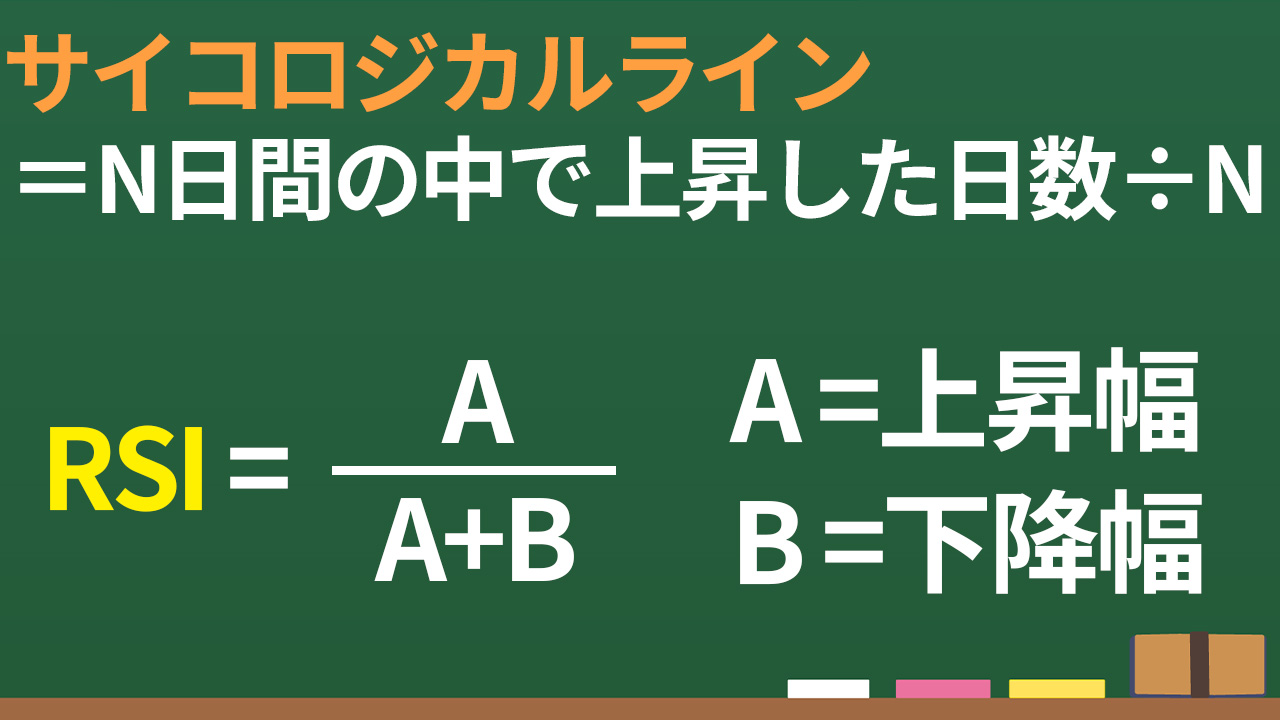
It is an indicator that shows how many days in a period moved up.
When the window is not opened, it refers to how many bullish candles there are.
In Problem 1, there are 9 bullish candles and 1 bearish candle, so
9 ÷ 10 = 90%
Simply counting the number of bullish candles cannot determine whether buying is strong; RSI takes into account price range as well.
Over N days, price movement is split into up and down moves, and the indicator shows what percentage of the total movement was upward.
In Problem 2, the case is, “From day 1 to day 9 prices rise by 10 yen each day, and on day 10 they fall by 90 yen.”
If you calculate as
RSI = (10 × 9) ÷ (10 × 9 + 90 × 1)
= 50%
In short, when the rise and fall magnitudes are the same, RSI is 50%.
We have explained Stochastics in a previous article.
“Is Stochastics unusable?” Is that true?
Problem 3 is that the closing price on day 10 is the lowest price in the 10-day period, so
%K = 0%
Do you feel anything about the differences among oscillator-type indicators by looking at this?
If you have price increases for nine days and then a reversal in one day, it tends to suggest a downward momentum rather than a further rise.
① Psycological line = 90%
② RSI = 50%
③ Stochastics = 0%
In markets that rise and fall within a relatively stable and similar range, the Psycological line and RSI seem to function well.
However, when prices move sharply, even if the chart shows a drop, the Psycological line may still show a high value.
Similarly, for RSI, a 50% value suggests that buying and selling forces are balanced, right?
RSI is a representative oscillator indicator and is often used for contrarian strategies.
However, do you understand the calculation formulas and these drawbacks when using it?
Are you just using it because it seems easy to use within the 30%–70% range?
Next time, we will discuss the correct way to use RSI.