

[Bollinger Bands ③] Trading strategy using band walk
Standard deviation from the previous-to-last time
Last time, we explained bandwise and the %b chart.
【Bollinger Bands II】Bandwise and %b chart that are surprisingly not widely known
This time, we will finally explain Bollinger Band trading strategies.
Roughly speaking about the market
Three market trends: uptrend, ranging, and downtrend
Three band-width states: expanding, sideways, contracting
divided into 3×3 = 9 patterns.
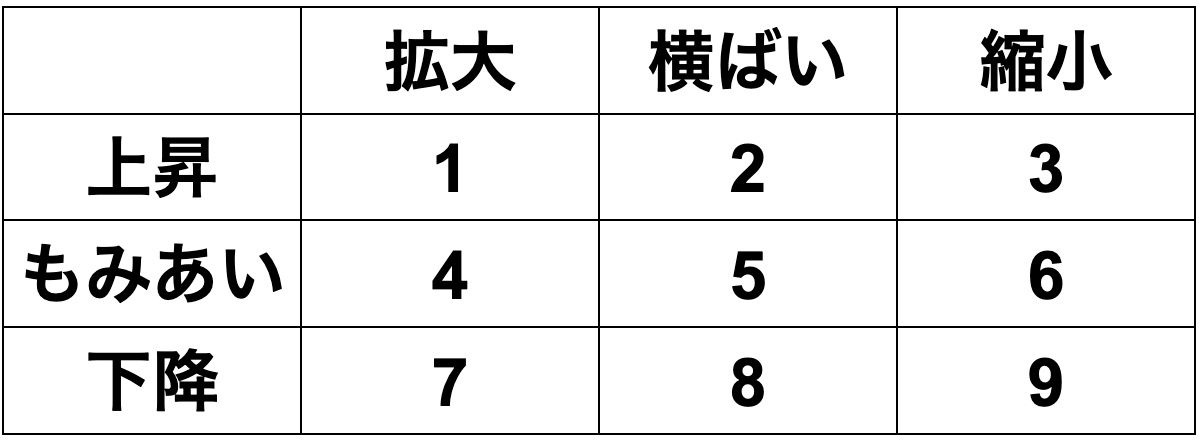
Notable are patterns 1 and 7.
Since price moves or not, the practical trading focus is the point where a band walk occurs.
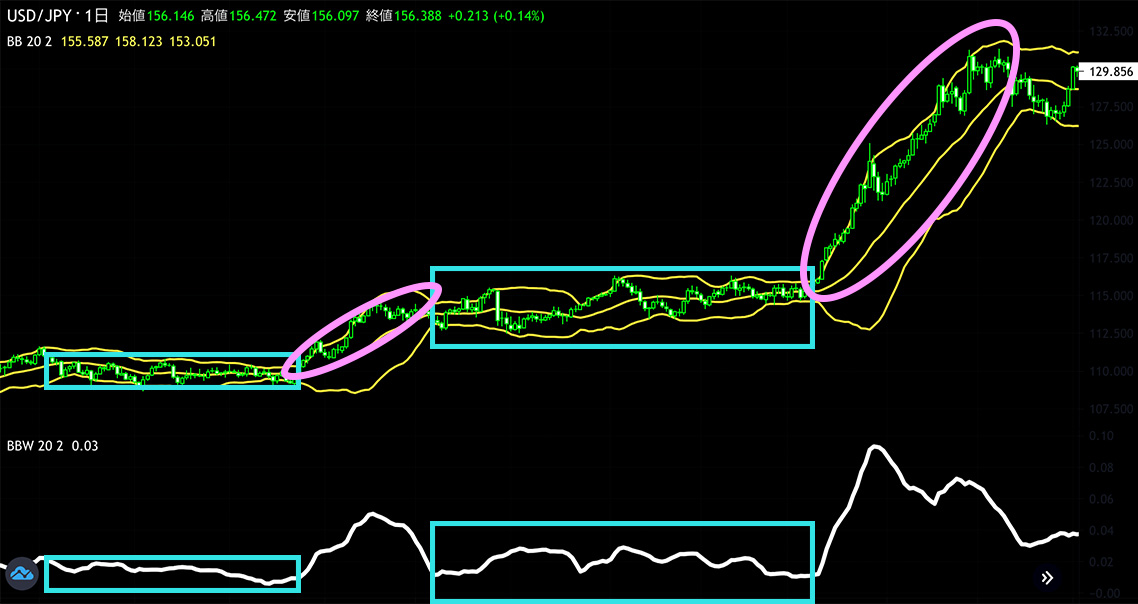
When price ranges, band width is often sideways, which corresponds to pattern 5
After that, pattern 1, where band width expands and moves up along the upper band, yields larger price moves.
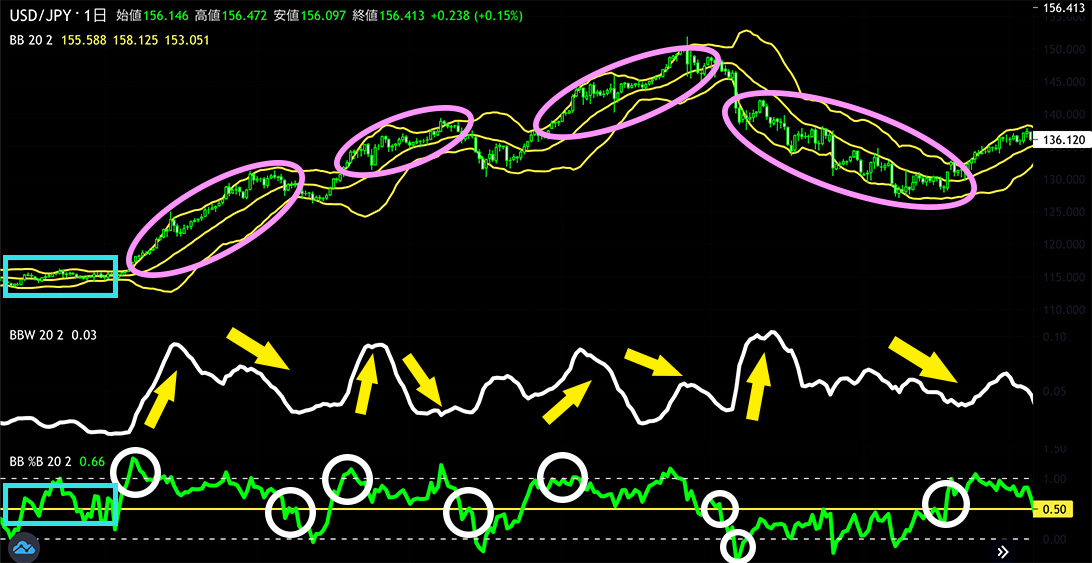
The area enclosed by the pink circle indicates a stable uptrend phase.
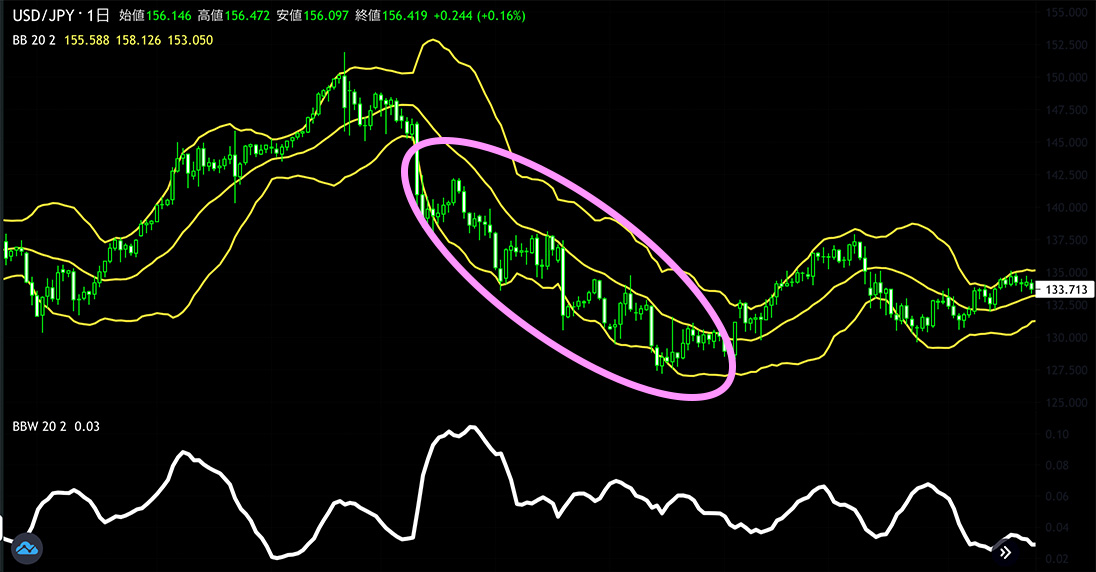
Even when band width is sideways, moving along the lower band corresponds to pattern 8
This is a stable downtrend.
Next, we will look at concrete entry points.
There is the following relationship between Bollinger Bands and %b.
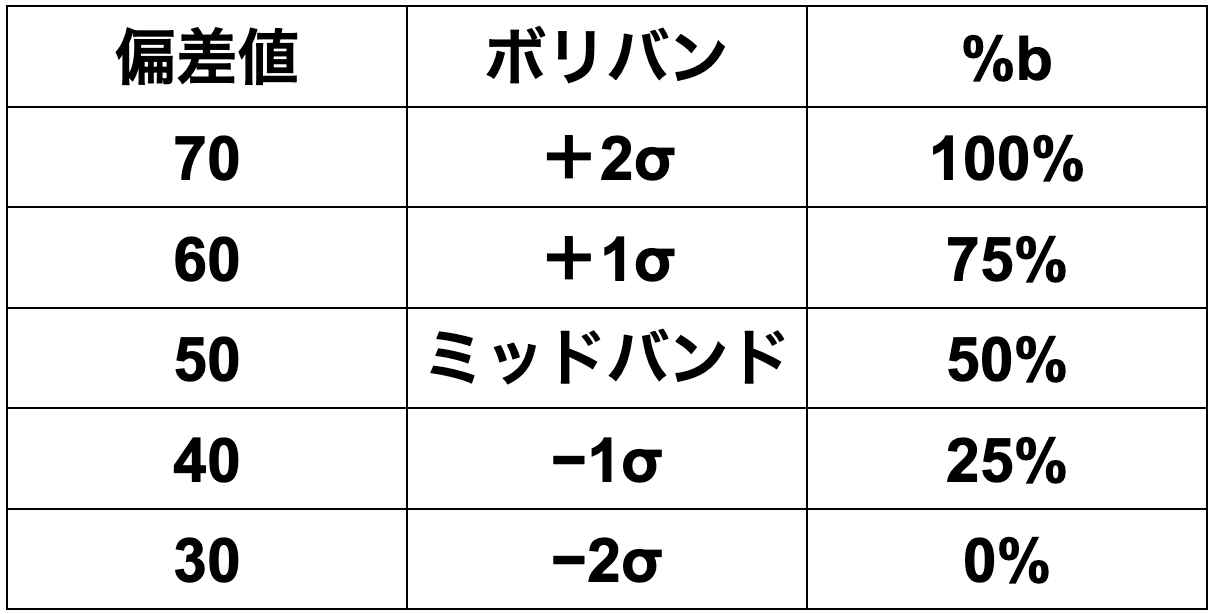
To review the definition of %b

About entry and exit using Bollinger Bands
Buy signal
・ price breaks above +2σ
・ band width contracts → expands
Exit
・ band width contracts
・ price closes below the mid-band
Sell signal is the opposite
Even by just looking at Bollinger Bands, you can see that price has broken above +2σ, but to analyze more precisely you need %b.
You can also restate the buy and exit signals in terms of %b.
Price breaks above +2σ = %b breaks above 100%
Mid-band break below = %b breaks below 50%
Also, as seen in the pink circled area in the image above, it might look like simply being above or below the 20-day moving average.
However, using a bandwise chart reveals when price is released from ranging.

A diagram that again divides the market into 9 patterns by the three trends and three band-width states.
Pattern 4, where price ranges while band width expands, can be rephrased as price moving with new highs and new lows, i.e., bigger price swings.
This case generally does not last long and tends to transition into a trending market, so there is little need to dwell on it.
The most important timing is when price is ranging and band width is contracting and then expands
from 6 to 1 or 6 to 7
moving along the upper or lower band is called a “band walk.”

From the cyan box where price is ranging and band width is contracting, the price breaks above +2σ and band width expands; the leftmost pink circle is a classic example of pattern 6→pattern 1.
It is not enough to simply stay on the band upper or lower limit; what matters is to follow it steadily. This is the key point where you should capture the price movement.
What constitutes a stable following state is,
In an uptrend, price moves between +1σ and +2σ
In a downtrend, price moves between −1σ and −2σ
If expressed as %b
In an uptrend, price moves between 75% and 100%
In a downtrend, price moves between 25% and 0%

By looking at %b alone, you can tell whether it is a stable uptrend or a stable downtrend.
When price ranges, the mid-band goes back and forth, so %b hovers around 50%.
【Bollinger Bands Summary】
Bollinger Bands combine moving averages and Stochastics to add a perspective on volatility.
・Mid-band (20-day moving average) indicates the direction of the mid-term trend
・Bandwise shows volatility
・%b chart shows the relative price level
which can be understood.