

Utilization of the "Visualization Indicator" (Part 147)
Usage of the “Visualized Indicator” (part147)
1. Further evolving the “28 Currency Pairs List Indicator” into a more advanced indicator
“8CPVisualized Indicator”forUSDJPY chart
The “8CPVisualized Indicator” includesOceania edition,London edition,NewYork edition,AnyCP edition. This time, theLondon edition was used.
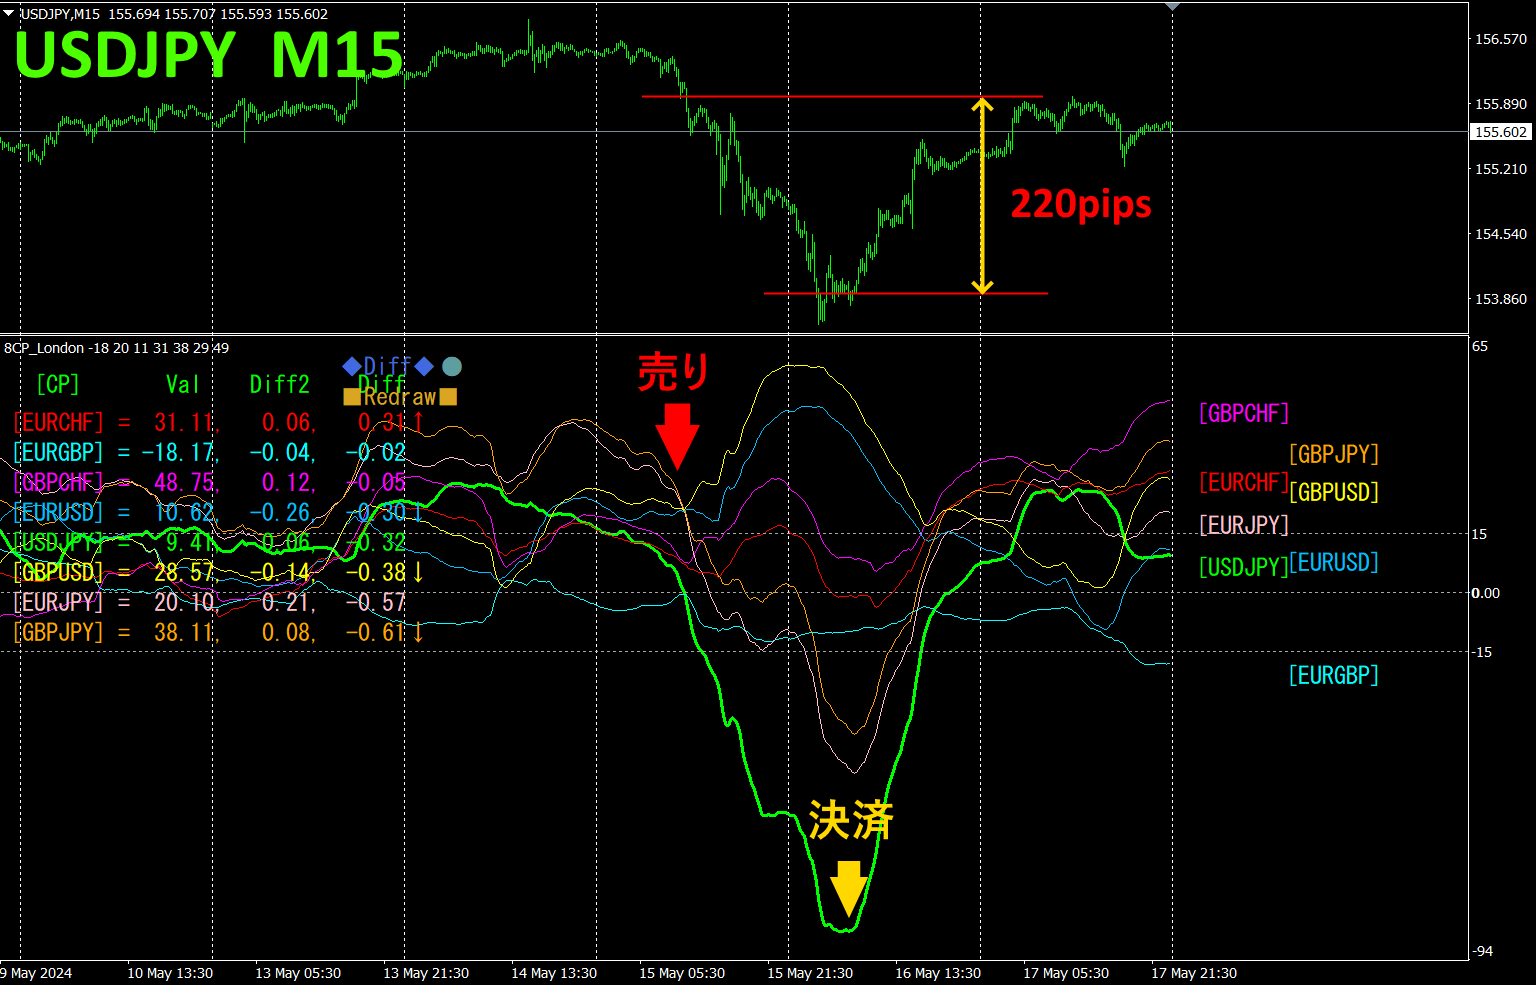
The upper half is theUSDJPY 15-minute chart. The lower half is from the8CP Visualized Indicator, and the green thick line chart corresponds toUSDJPY.
On Wednesday, USDJPY broke below from other chart groups, so a sell entry was made. It hit a bottom on Thursday, and was closed. Profit was about220pips.
If you were using theTrendLine-EX, you could automate entry and exit by a diagonal trendline break. You could leave it as is for easy trading. The is a semi-automatic EA that performs automatic selling on a trendline break below and automatic exit on a trendline break above.TrendLine-EX
※Recommended Indicator
With a semi-automaticEA, if you have theTrend Line EX, you can draw a diagonal descending line and automatically buy when it breaks upward and automatically exit when it breaks upward, enabling hands-off trading.
“Trend Line EX”
https://www.gogojungle.co.jp/tools/indicators/42257

2. Best SelectTry the Indicator
The figure below is a screenshot fromMay16, 2024 at 00:44(JST
[Total]The values are arranged in descending order. The top row,NZDUSD, is blue across all timeframes. Moreover, theTotal value is 4192.96, a large positive number. This indicates a strong uptrend in
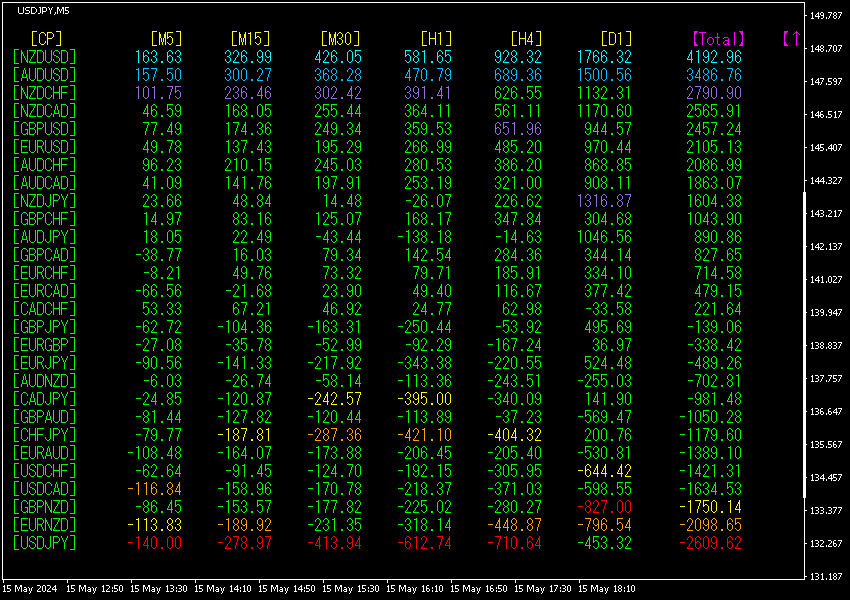
Now, let’s look at theNZDUSD chart.
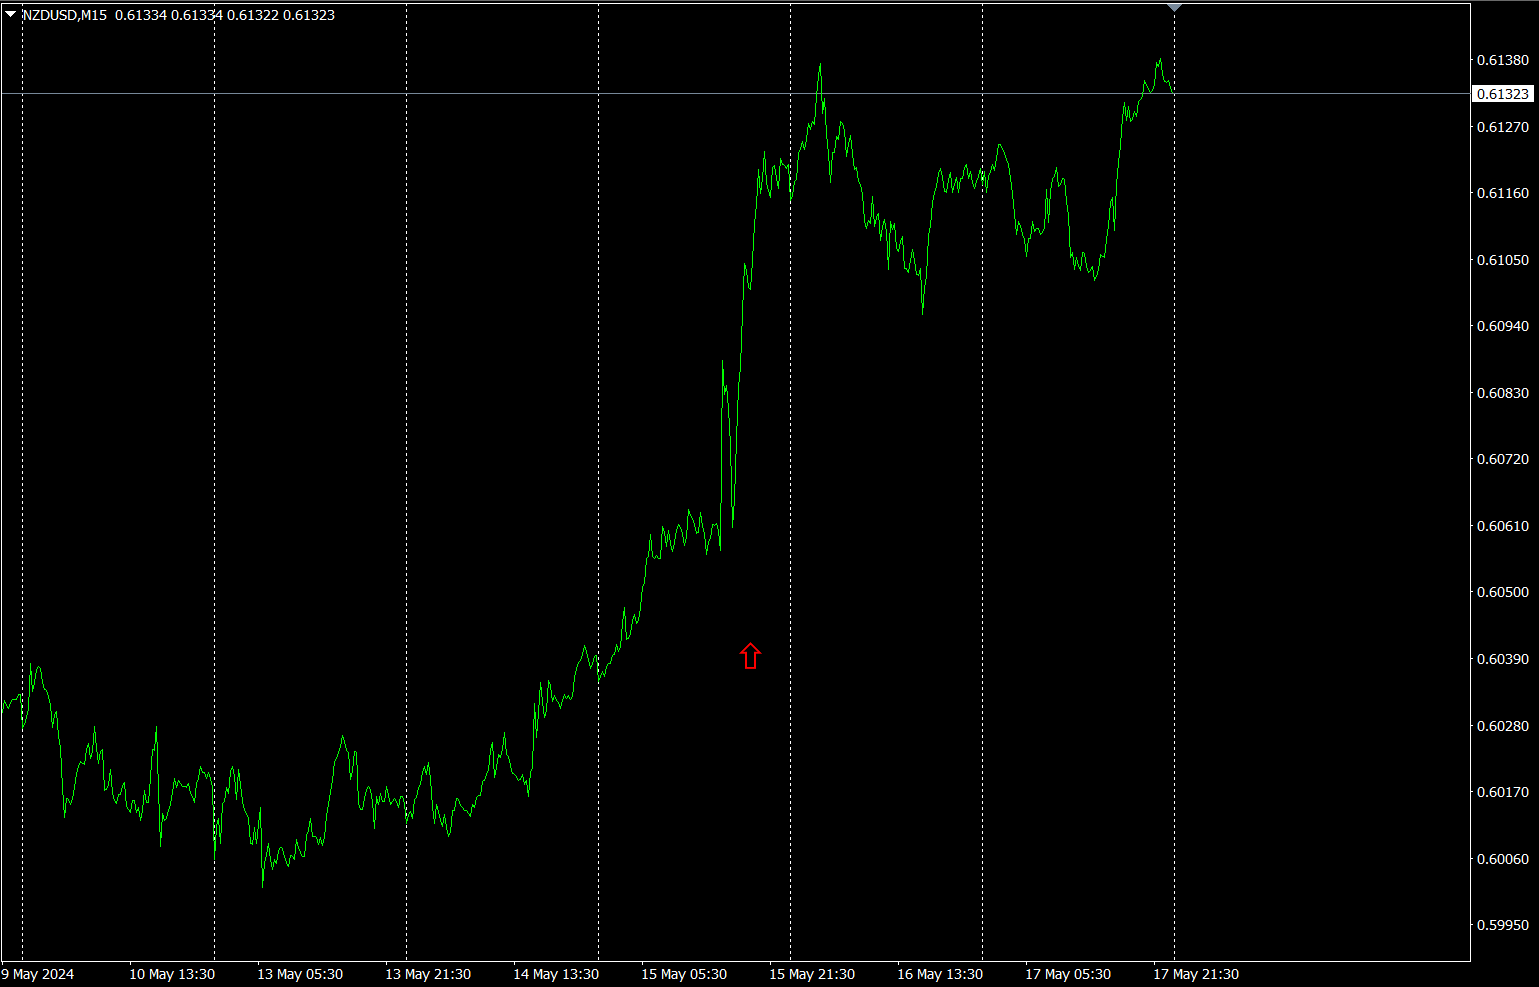
The red arrows indicate the captured screenshot. It has surged solidly. If you held a long position until the next morning, you could have earned about70pips of profit.
The “28 Currency Pairs Best Select
The “28 Currency Pairs Best Select Indicator

https://www.gogojungle.co.jp/tools/indicators/35128
3. 2021 May, 2021 to present EURJPY
2021 year 5 month EURJPY
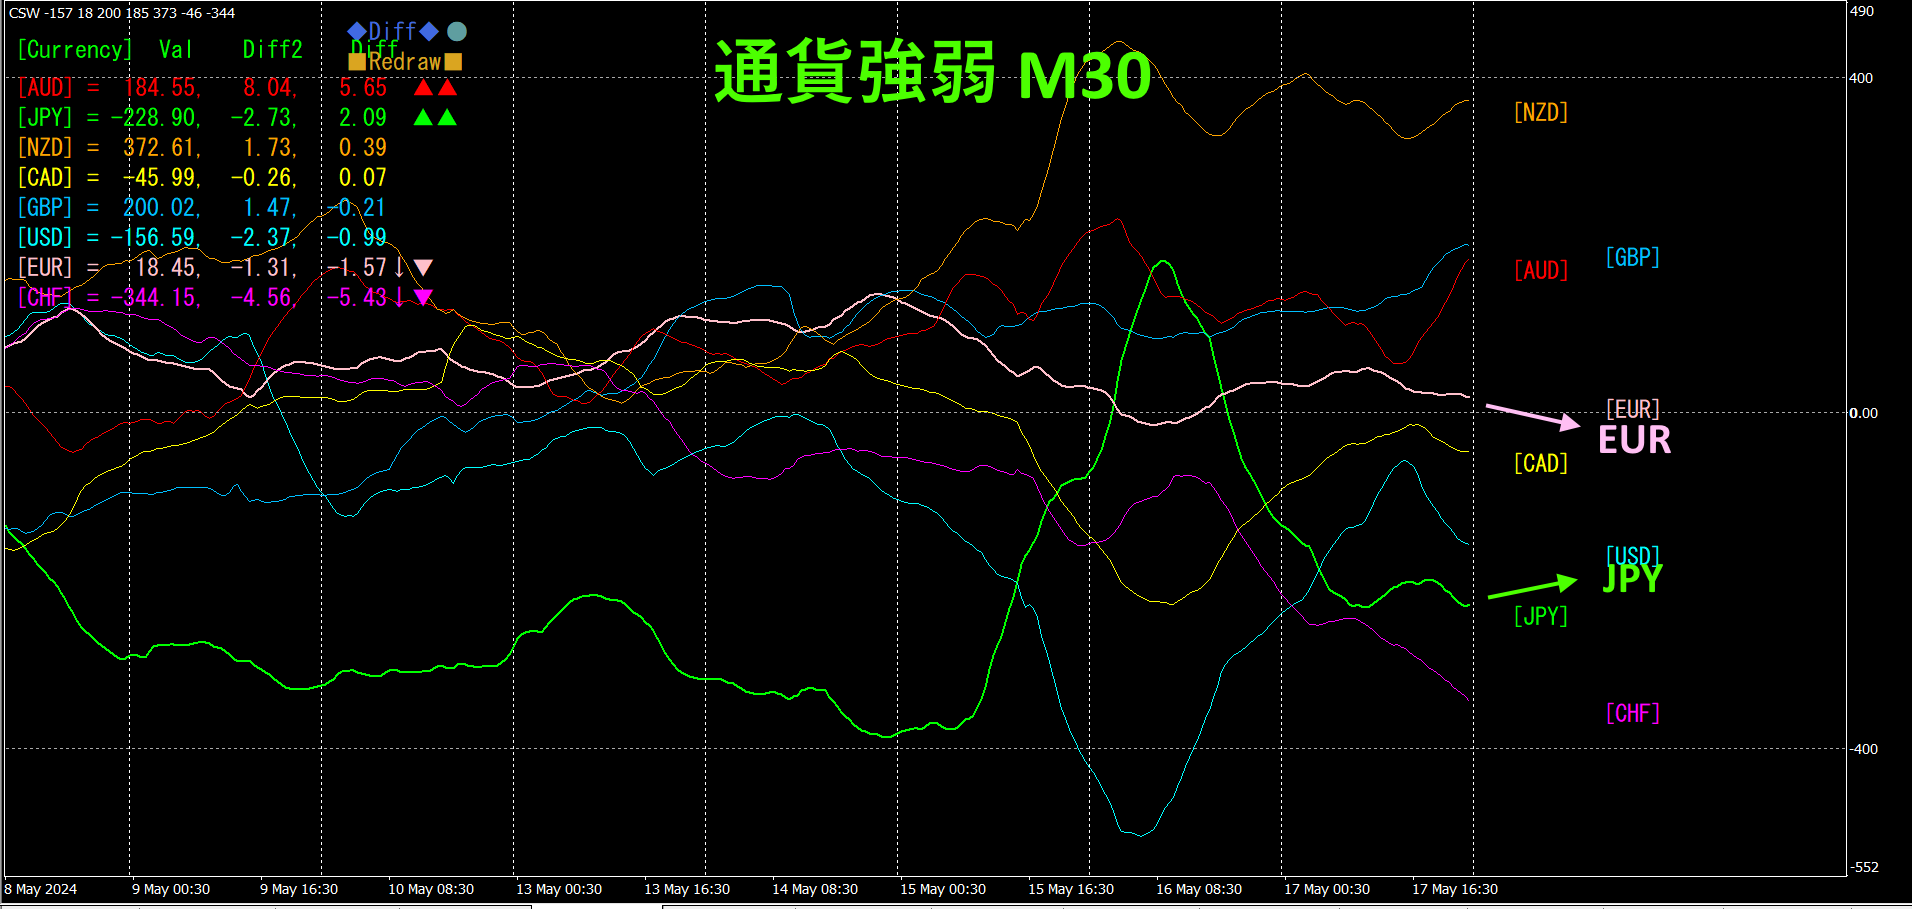
To view the overall trend, a30 minute chart shows roughly3 weeks worth of data.
Previously I wrote the following.
Due to Forex interventions, theJPY temporarily became the strongest currency, but this state could not last, and it fell back to being the weakest currency. Subsequently,JPY slightly strengthened, andEUR slightly weakened, so future
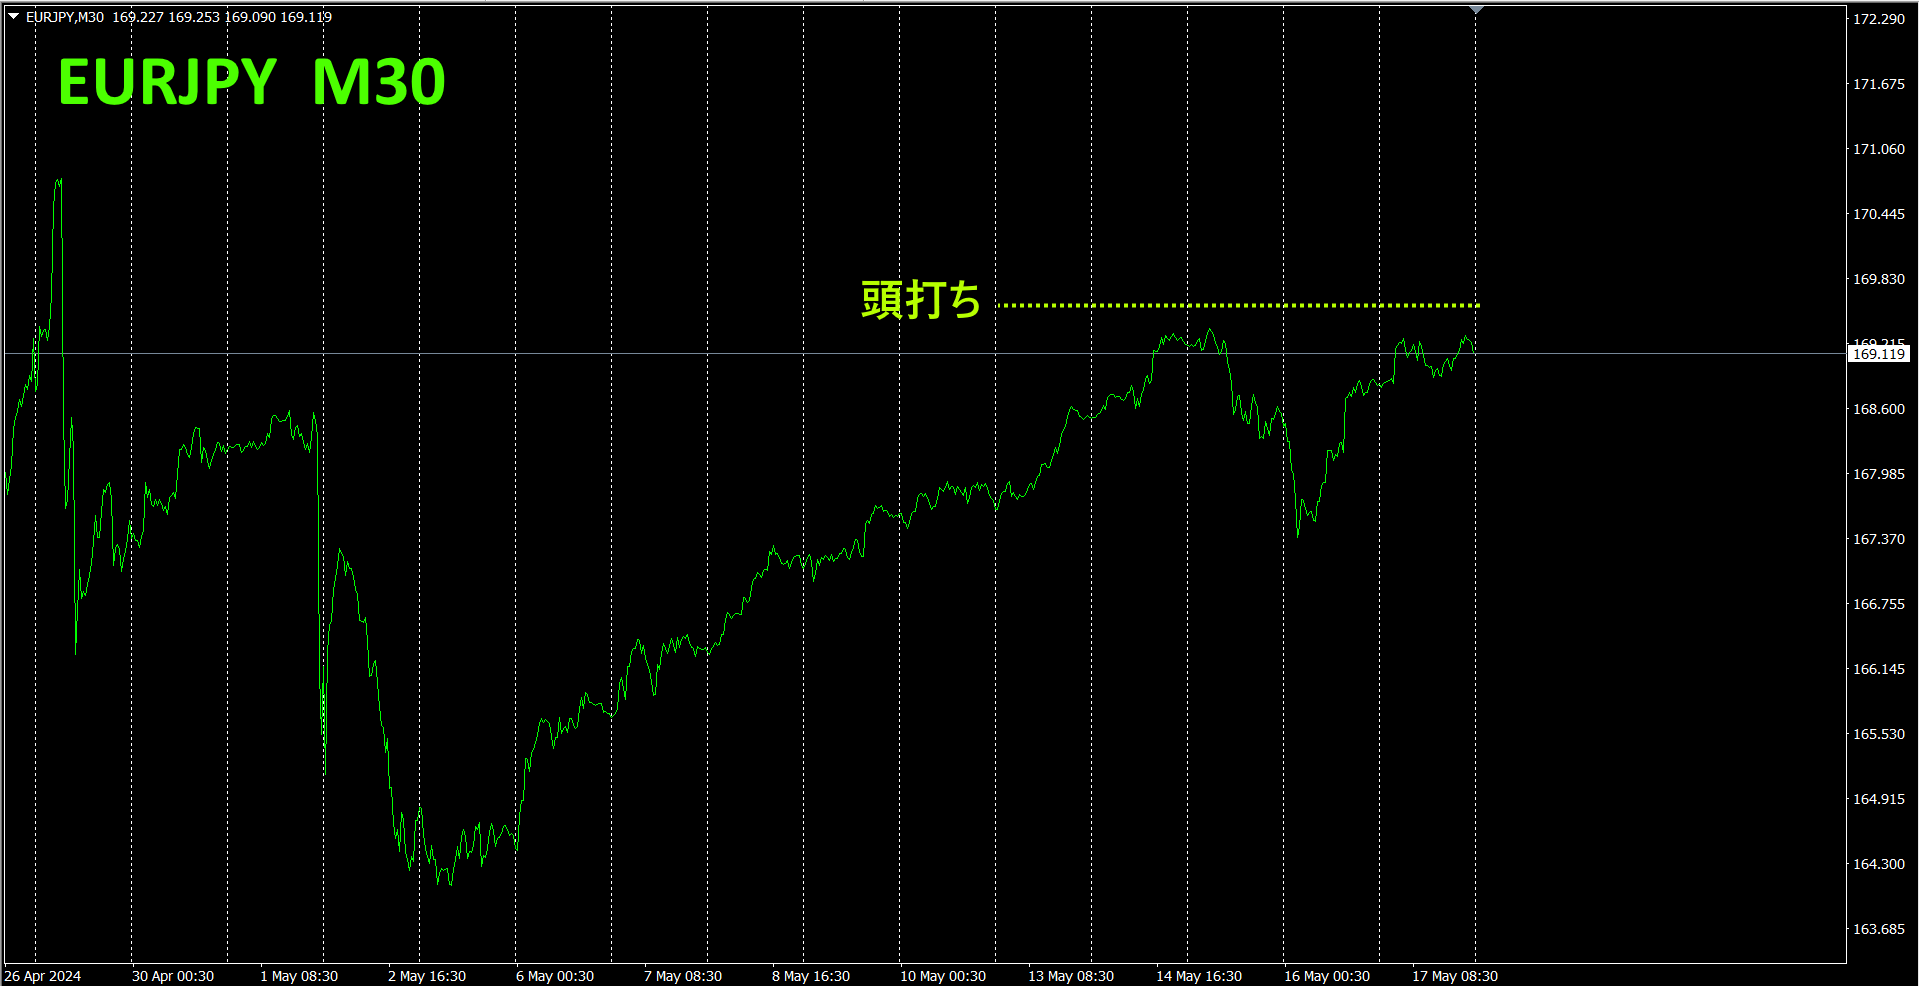
As predicted, it topped out and moved a bit lower.
30 minute currency strength chart.
Pink isEUR, green isJPY.JPY is located belowEUR, so the currency itself is weaker, but in terms of direction,JPY is slightly higher, andEUR is slightly lower, soEURJPYEUR >JPY,EURJPY should rise afterward.
4. Two new indicators have been released.
“Torotore Indicator” and “Torotore28CP_SelectIndicator”.
These are based on treating the market as waves, trading only the direction from convergence to expansion (and not trading at other times) during the repetition of convergence and expansion.
Please watch the introduction video created with AI added to the “Torotore Indicator.”
Please see the product page below.
“Torotore Indicator”
https://www.gogojungle.co.jp/tools/indicators/50115

“Torotore28CP_SelectIndicator”
https://www.gogojungle.co.jp/tools/indicators/50203
5.
Trading using the “Torotore Indicator”
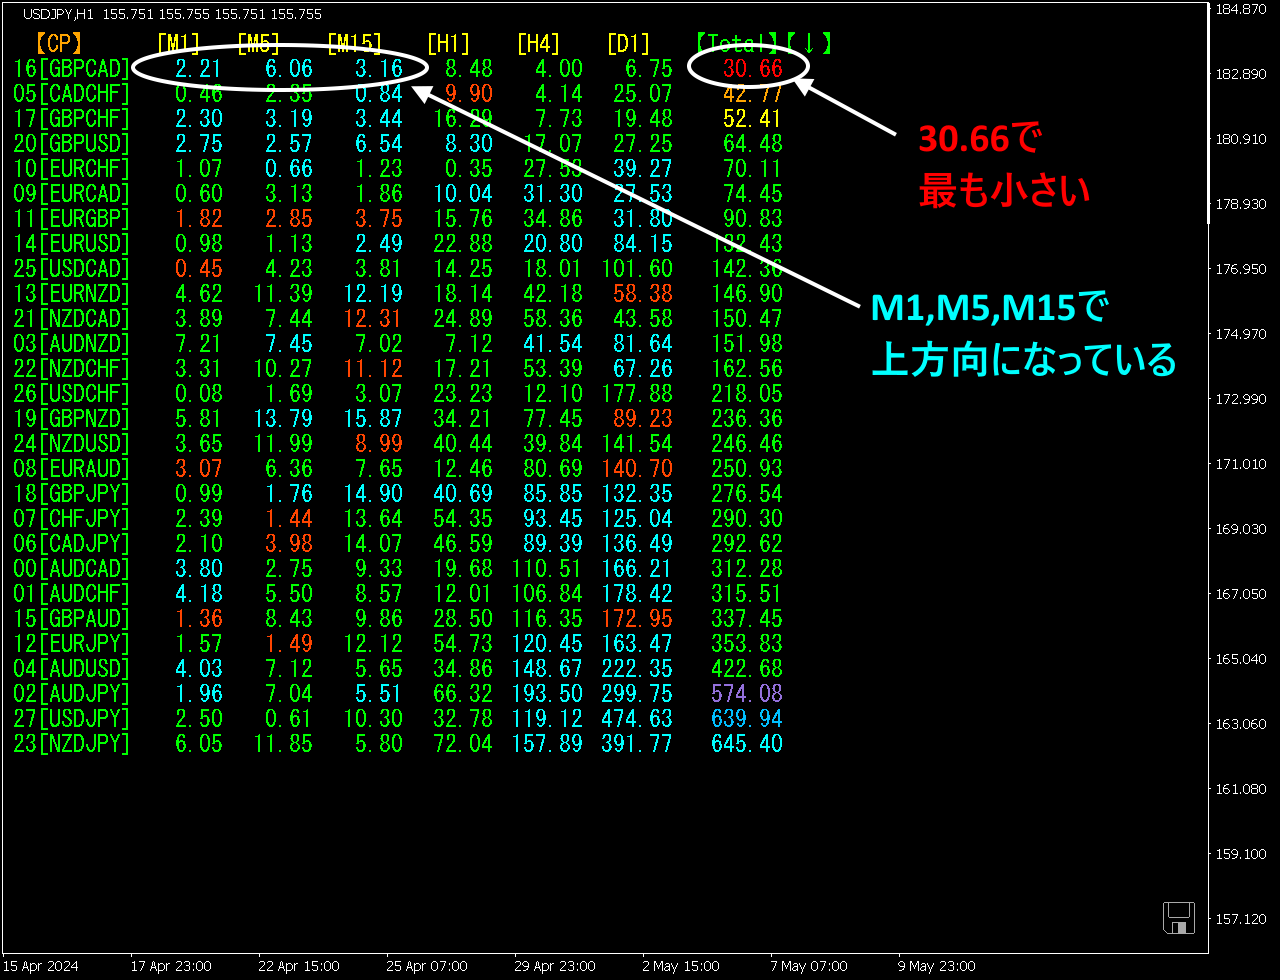
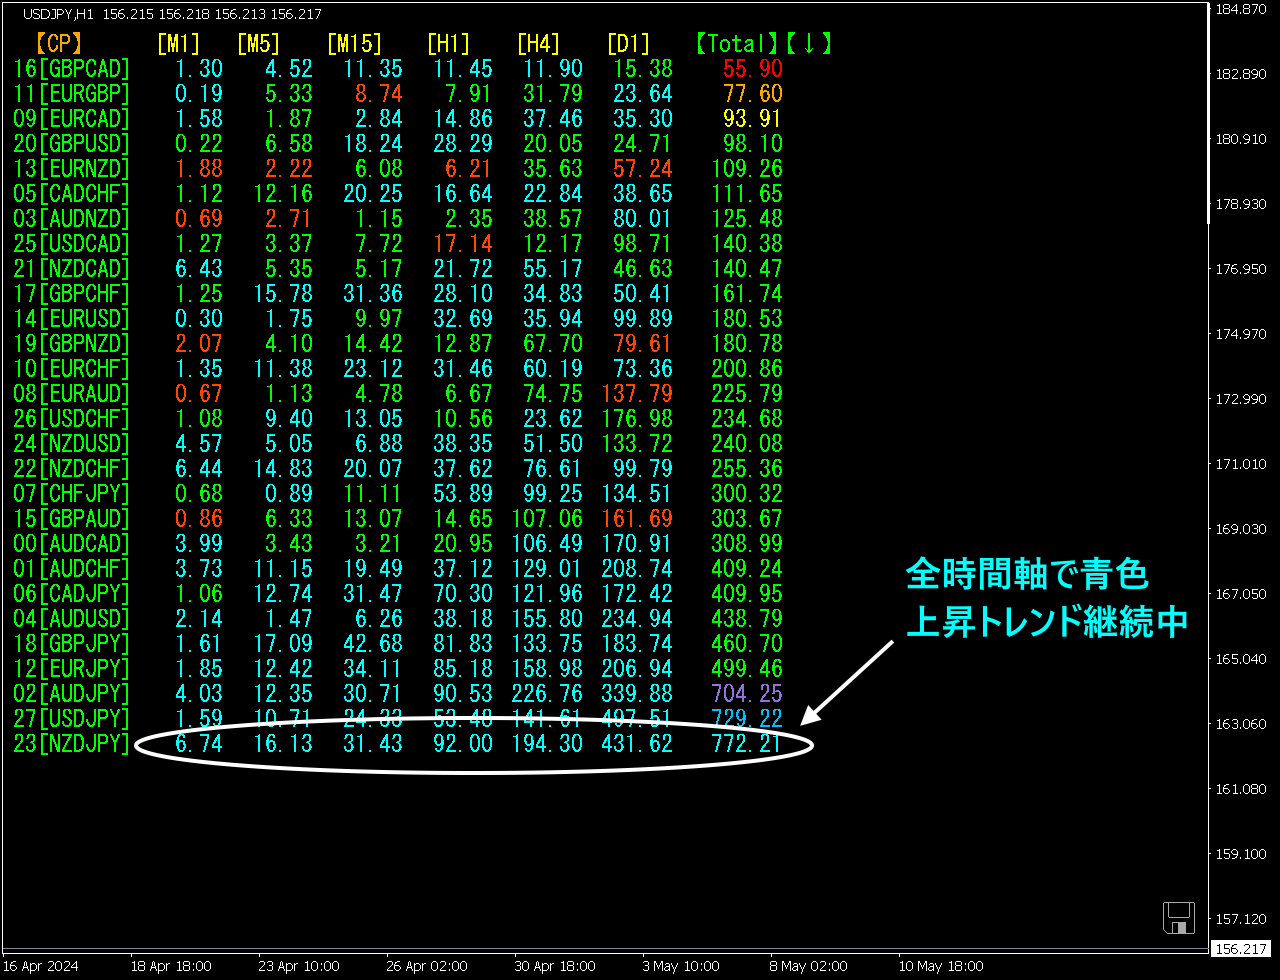
The figure below was captured onMay13, 2024 at 13:00(JST)28CP_SelectIndicator.”
In this, the top row’sGBPCAD is the most converged among the 28 currency pairs, and the bottom row’sNZDJPY is the most divergent among the 28 currency pairs. In particular,GBPCAD has aTotal value of30.66 and is the most converged; moreover,M1,M5,M15 are blue, indicating an upward direction. It confirms that the direction is upward.
Now, let's look at the chart.
(1) GBPCAD
The red downward arrow marks the captured screenshot. With the “Torotore Indicator,” you can wait for convergence and find numerous favorable entry points for buying.
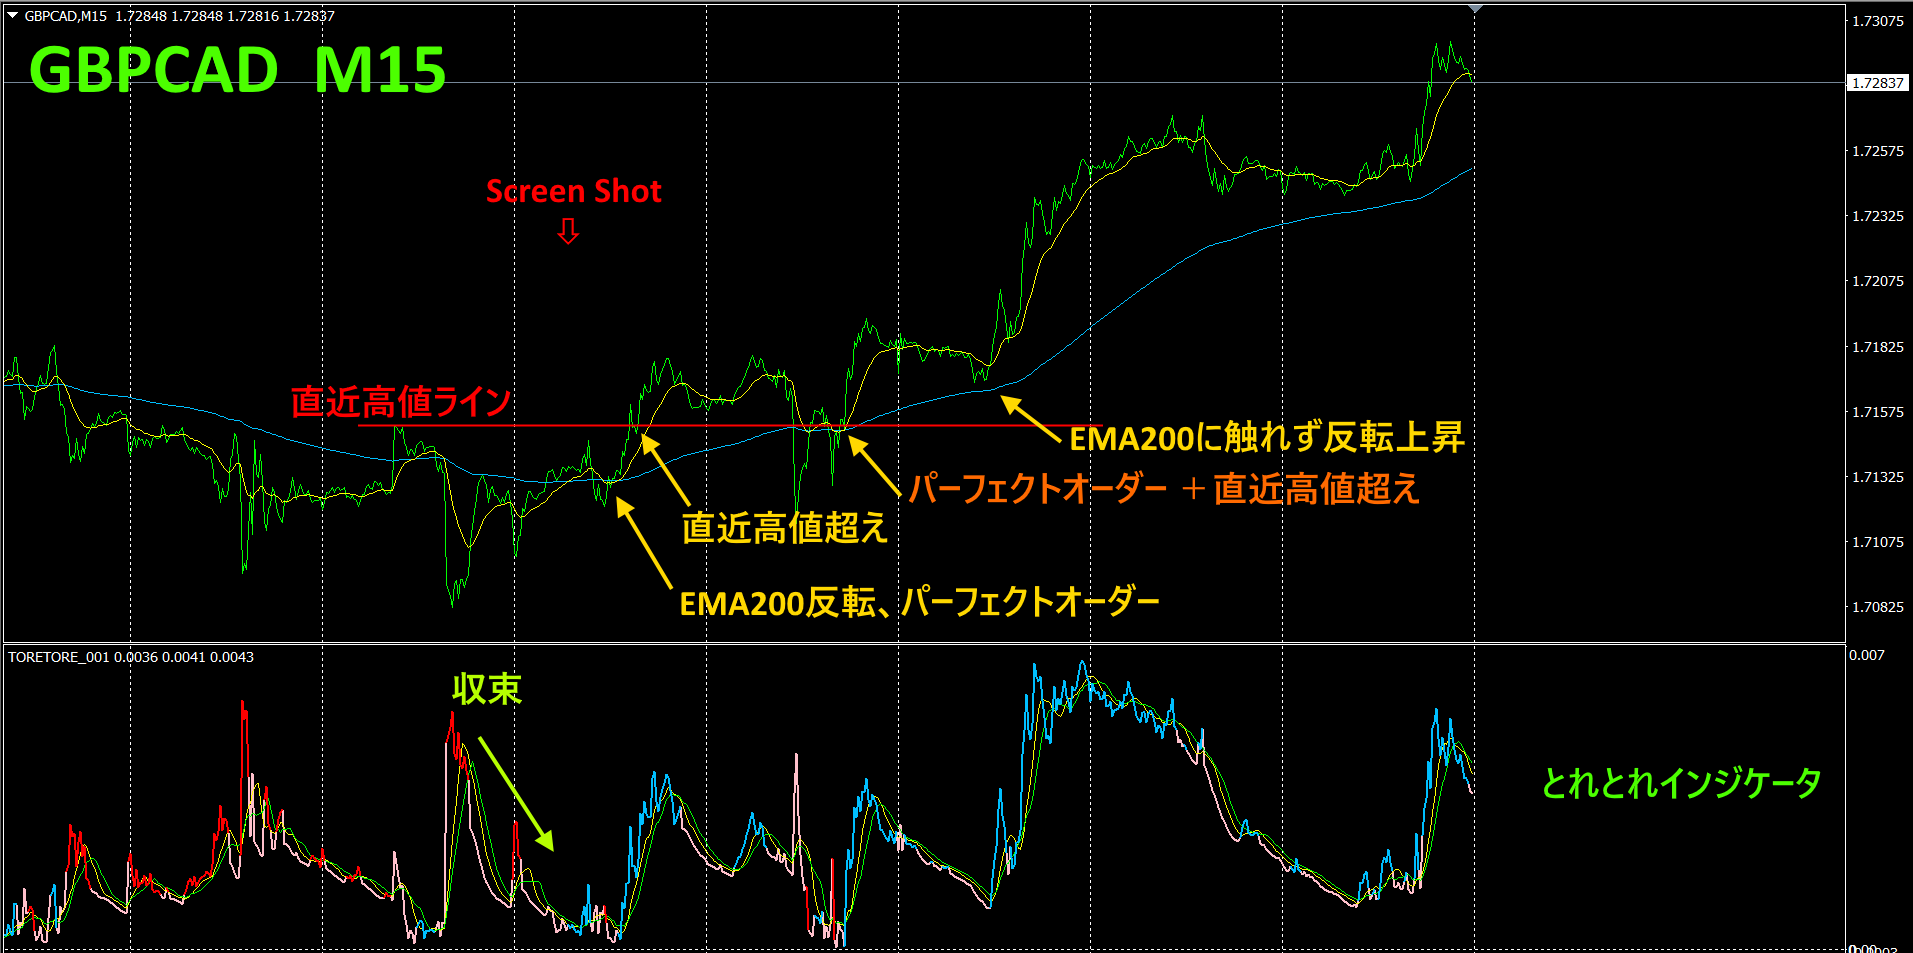
No forceful trading, easy160pips
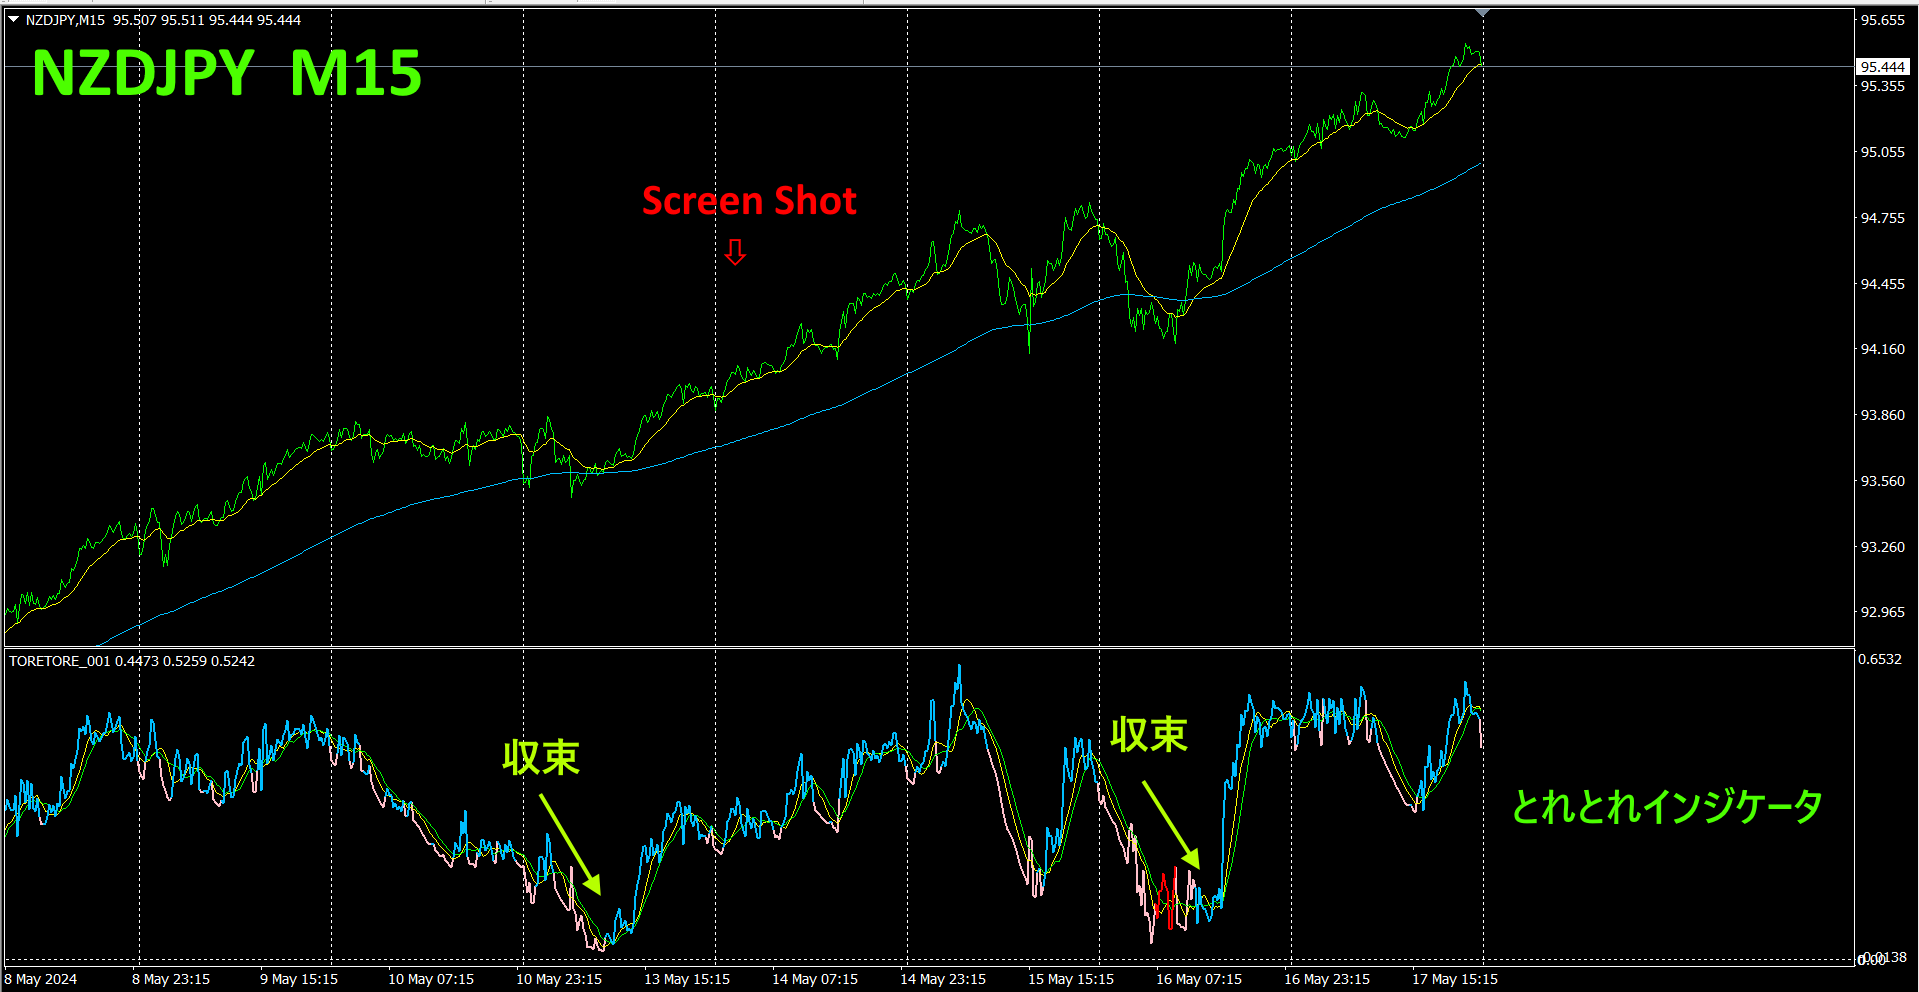
(2)NZDJPY
So, among the 28 currency pairs, how about the largest divergence, NZDJPY?
Screenshot from14 at 8:00.
From the previous screenshot, theNZDJPY Total has increased. Furthermore, all timeframes are rising!
TheNZDJPY
In the midst of a rising uptrend, any buy would likely profit if held. With the “Torotore Indicator,” you can wait for convergence before buying, enabling an ideal entry point.
If you buy, you will immediately see unrealized gains, making it a solid classic trade. Beginners often fall into the trap of “buying at the high” or being stopped out after buying.
In the above example, if you had bought at the initial entry point, you would already have about190pips of unrealized gains. And since the upward trend continues, you can hold the position until it moves below the moving average.
If you employTrendLine-EX, you can leave it completely to wait for a favorable exit.
6.
Recommended Indicators
“TrendLine-EX”
https://www.gogojungle.co.jp/tools/indicators/42257

The “8C Currency Strength Visualization Indicator” is detailed on the pages below.

MT4 Edition https://www.gogojungle.co.jp/tools/indicators/39150
MT5 Edition https://www.gogojungle.co.jp/tools/indicators/39159
【My listed items】


