

【Bollinger Bands II】Band-wise and %b chart that surprisingly not well known
In the previous article, I explained standard deviation.
【Bollinger Bands Part 1】About standard deviation
This time, I will explain the lesser-known %b chart and BandWidth chart.
The information contained in Bollinger Bands is
・Trend direction
・Volatility
・Relative price level
These three things.
Just by looking at Bollinger Bands, you can understand these three things, but for a more accurate analysis, you need
Volatility → BandWidth chart
Relative price level → %b chart
Please master them during this opportunity.

BandWidth refers to the band width. The formula is,
BandWidth = (Upper band − Lower band) ÷ Mid band
Simply, band width refers to the distance from +2σ line to −2σ line.
However, for example,
the width of 100 yen when the price is 500 yen
and the width of 100 yen when the price is 5000 yen have different meanings.
Therefore, by dividing by the mid band, this metric measures what percentage of the current average price is the width, and aims to read changes in band width correctly.

BandWidth allows you to understand changes in band width.
An important concept in reading those changes is the expansion and contraction of band width.
In a certain period, the band width is
Squeezed to its minimum
Expanded to its maximum is called Boj
.
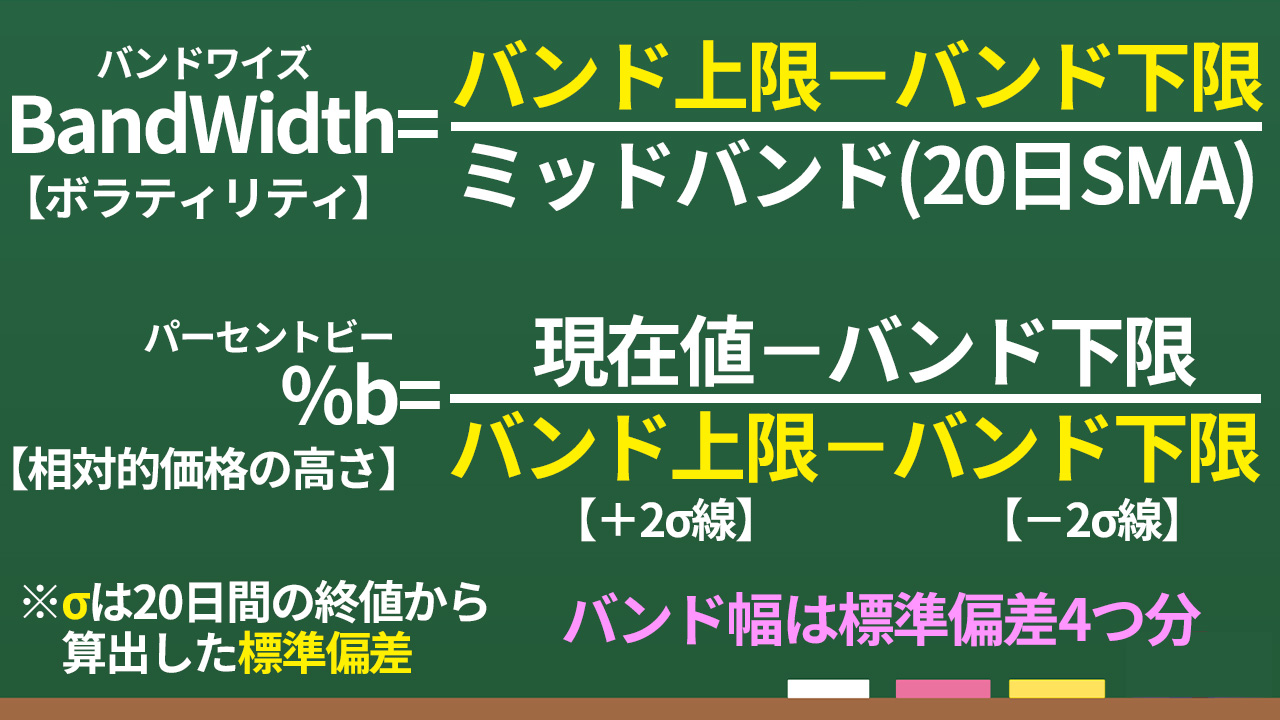
%b chart shows the current price relative to the past 20 days. The formula is,
%b = (Current value − Lower band) ÷ (Upper band − Lower band)
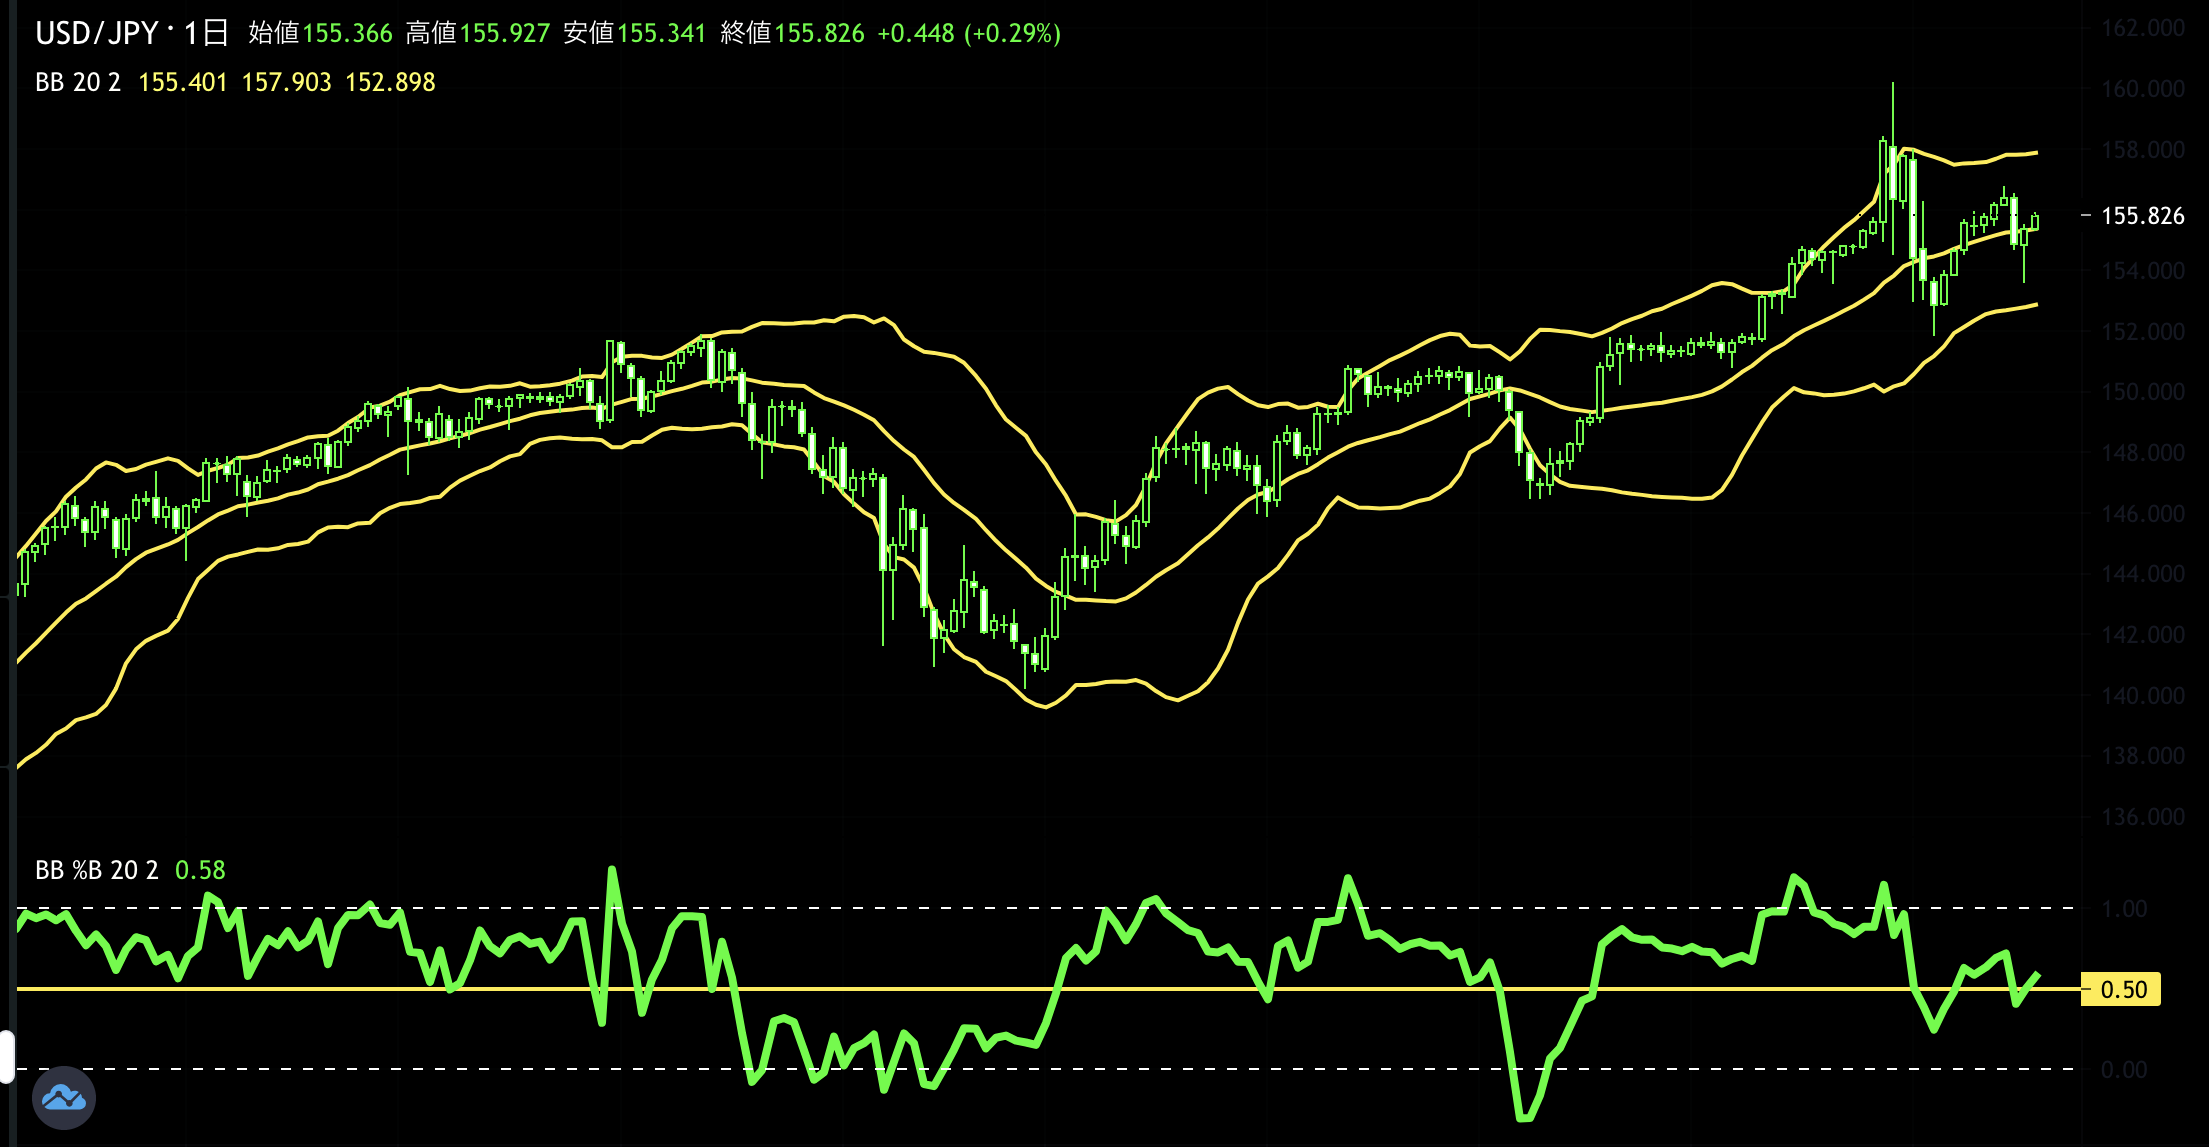
It is a gauge of where the current value sits between the lower band and the upper band.
There is an oscillator-like indicator that is very similar to this.
That is the Stochastic oscillator.
Is it true that you cannot use the Stochastic oscillator?
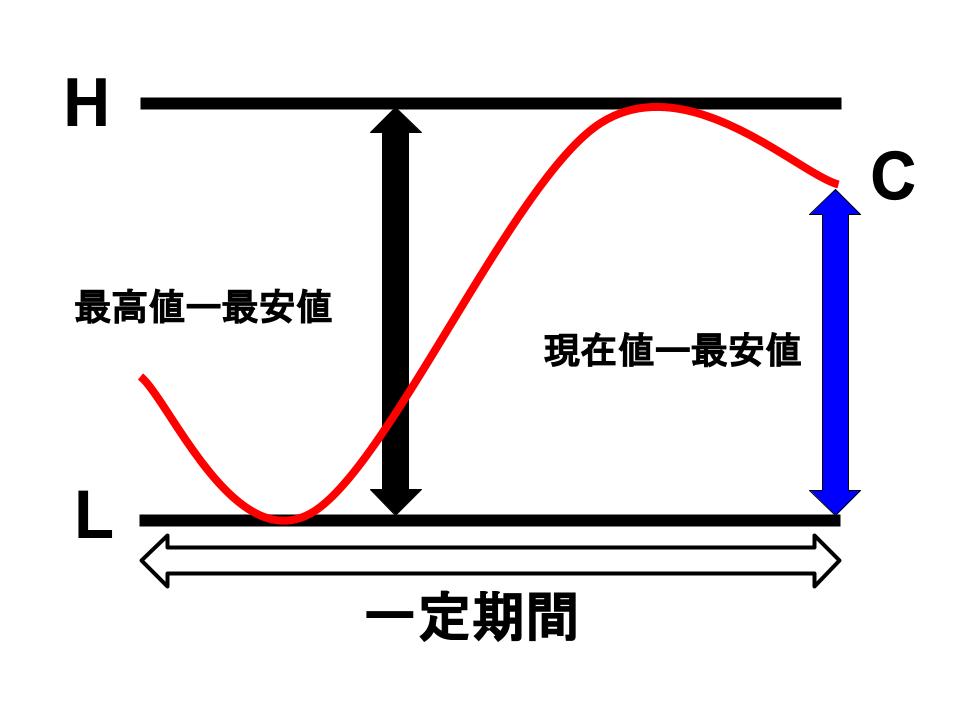
When comparing the definitions of %K in Stochastic and %b,
%K = (Current − Highest) ÷ (Highest − Lowest)
%b = (Current − Lower band) ÷ (Upper band − Lower band)
You can see they are similar.
In short, the difference between these two is that relative price height is
%K is a score
%b is a percentile
in effect.
What does that mean?
%K ranges from 0–100%
%b theoretically can take any value.
To illustrate with test scores, in the previous article I explained percentile (偏差値) using standard deviation.
【Bollinger Bands Part 1】About standard deviation
I discussed how even with the same average score and ranking, percentile can differ.
With only scores, you cannot judge how high you are, so using standard deviation to assess data spread makes relative position easier to understand, which is what percentile is.
If your score is one standard deviation above the average, percentile is 60
If your score is two standard deviations above the average, percentile is 70
.
Returning to the comparison of %K and %b definitions for Stochastic:
%K = (Current − Highest) ÷ (Highest − Lowest)
%b = (Current − Lower band) ÷ (Upper band − Lower band)
In Stochastic, at the highest value, %K = 100%
%b chart, when price is at the position of +2σ, %b = 100%
From the formula,
%K is between 0 and 100%
%b can take values below 0 or above 100%
Summary
The information contained in Bollinger Bands is
・Trend direction → Mid band
・Volatility → BandWidth chart
・Relative price level → %b chart
These three things.
Bollinger Bands can be described as a moving average with Stochastic added and volatility incorporated.
Next time, I will explain trading strategies using Bollinger Bands.