

Utilization of "Visualization Indicator" (Part 146)
Usage of the "Visualization Indicator" (its146)
1. Further develop the "28 Currency Pairs List Indicator" into a more advanced indicator
“8CP Visualization Indicator” to chartUSDJPY
The “8CP Visualization Indicator” includesOceania London version, NewYork version, AnyCP version. This time, we used theLondon version.
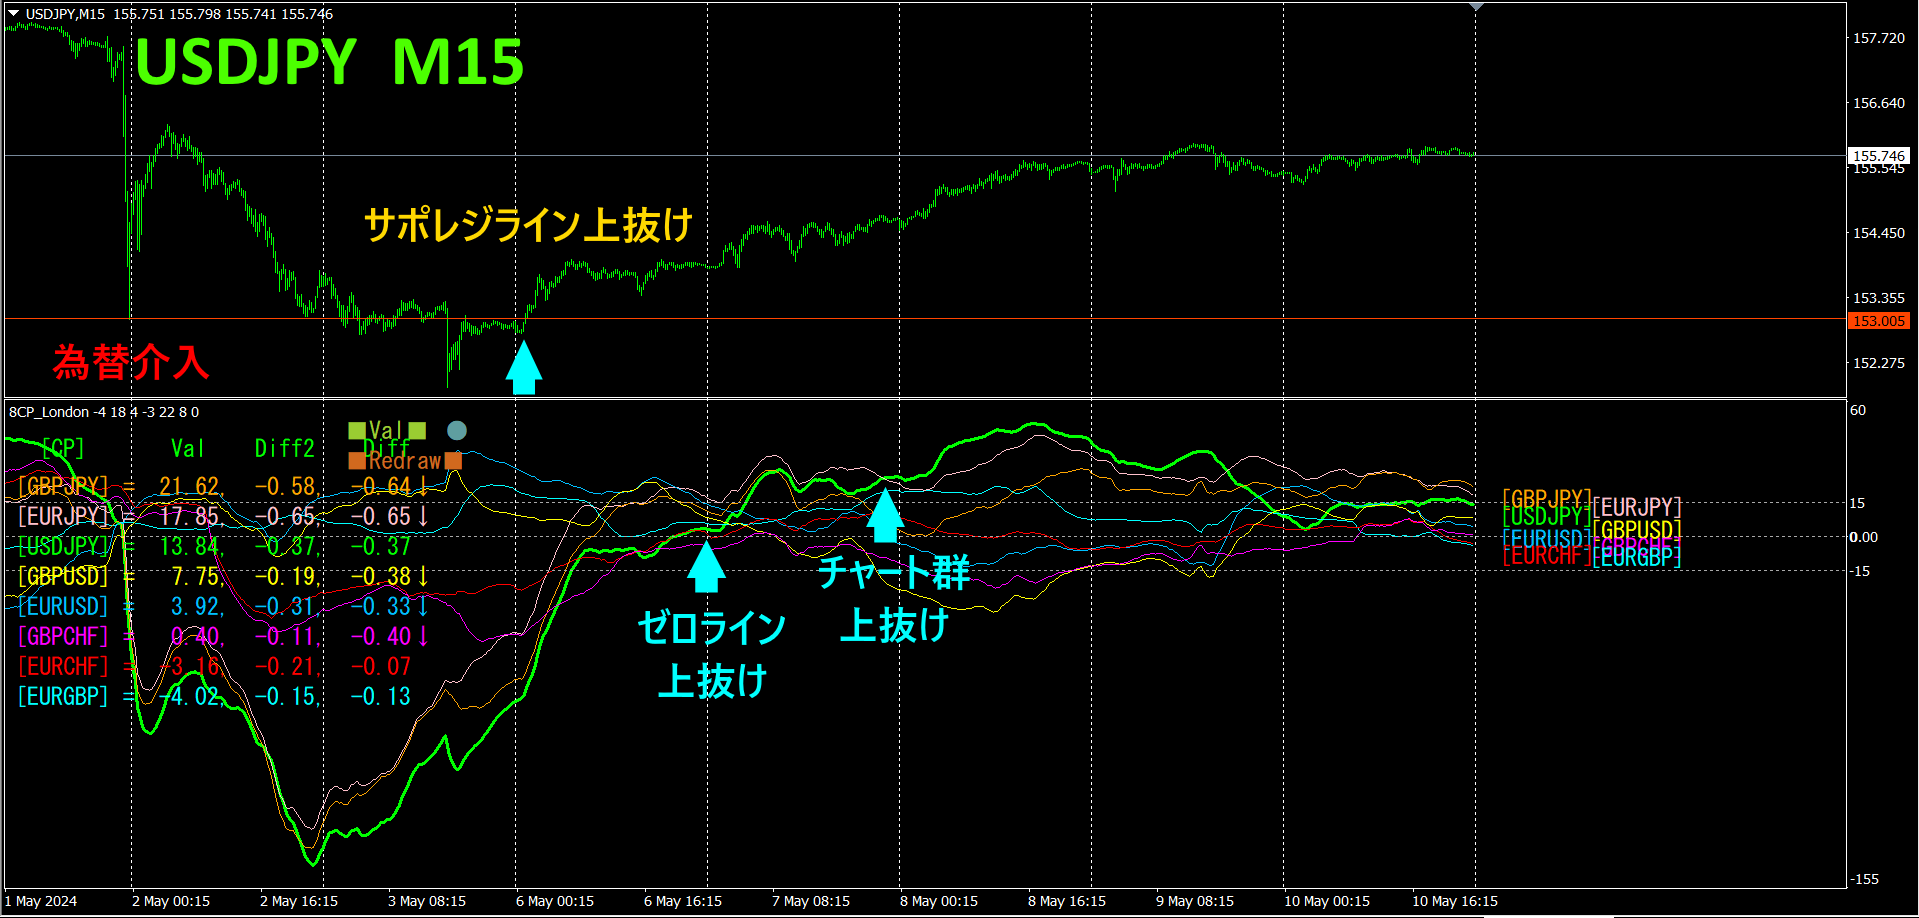
The upper half is theUSDJPY 15-minute chart. The lower half is from the “8CP Visualization Indicator”; the green thick line graph corresponds toUSDJPY.
Due to forex intervention the USDJPY briefly moved toward a stronger yen, but the fundamental weakness of theUSDJPY remained largely unchanged, gradually turning back toward yen weakness. In such a market, merely holding a USDJPY long position would naturally expand unrealized gains. It was a market condition where you could safelybuy USDJPY.
Using the usual method of the “8CP Visualization Indicator,” you would target points breaking above the moving zero line from another currency pair’s chart, but in cases like this, you could also purchase earlier from the point where it breaks above the zero line. Either way, you could comfortably gain100pips or more.
Alternatively, by drawing a single horizontal line corresponding to a support/resistance line, you can place a buy order once it breaks above that support/resistance line. In this case, that would yield about290pips of profit.
With humanly driven moves like forex interventions, there is always a tendency to revert. Especially since fundamentals indicate inevitable yen weakness, trading the dollar-yen bounce with a USDJPY buy is reasonable. Even after learning of the intervention through news, you could still profit from the market.
If you were using “TrendLine-EX, you could have pre-set a position. The semi-automatic EA would automatically sell when the trend line is broken downward and automatically close when it breaks upward.TrendLine-EX is such a semi-automatic EA.
※ Recommended Indicators
With a semi-automaticEA, the “Trend Line EX” allows you to draw a slanted down line, and when it breaks above, auto-buy, and when it breaks above a rising line, auto-close, enabling a hands-off trading approach.
“Trend Line EX”

https://www.gogojungle.co.jp/tools/indicators/42257
2. Best SelectTry the Indicator
The image below is a screenshot fromMay 9, 2024 at 21:43(JST
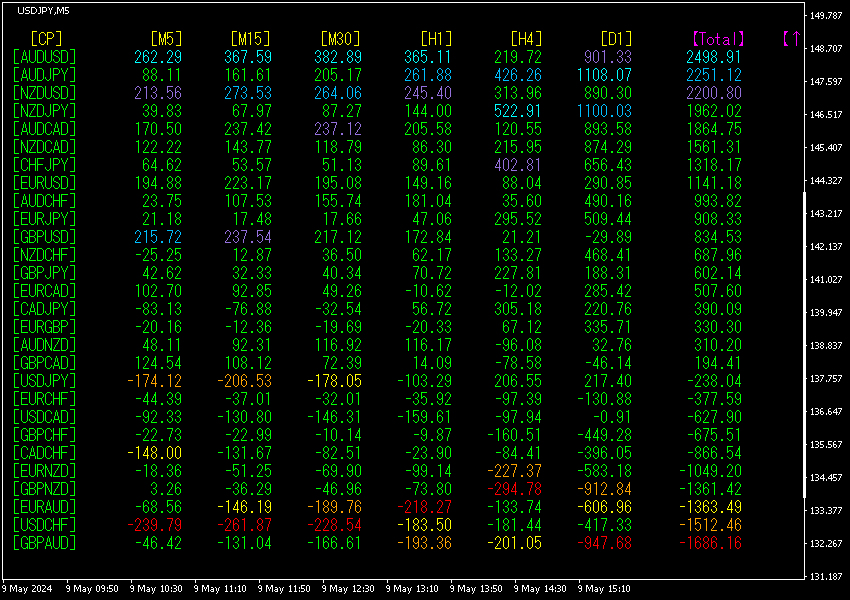
[Total]Numbers are sorted in descending order. The top line’sAUDUSD is blue across all timeframes. The total value is 2498.91, a large positive figure. This indicates an uptrend inAUDUSD.
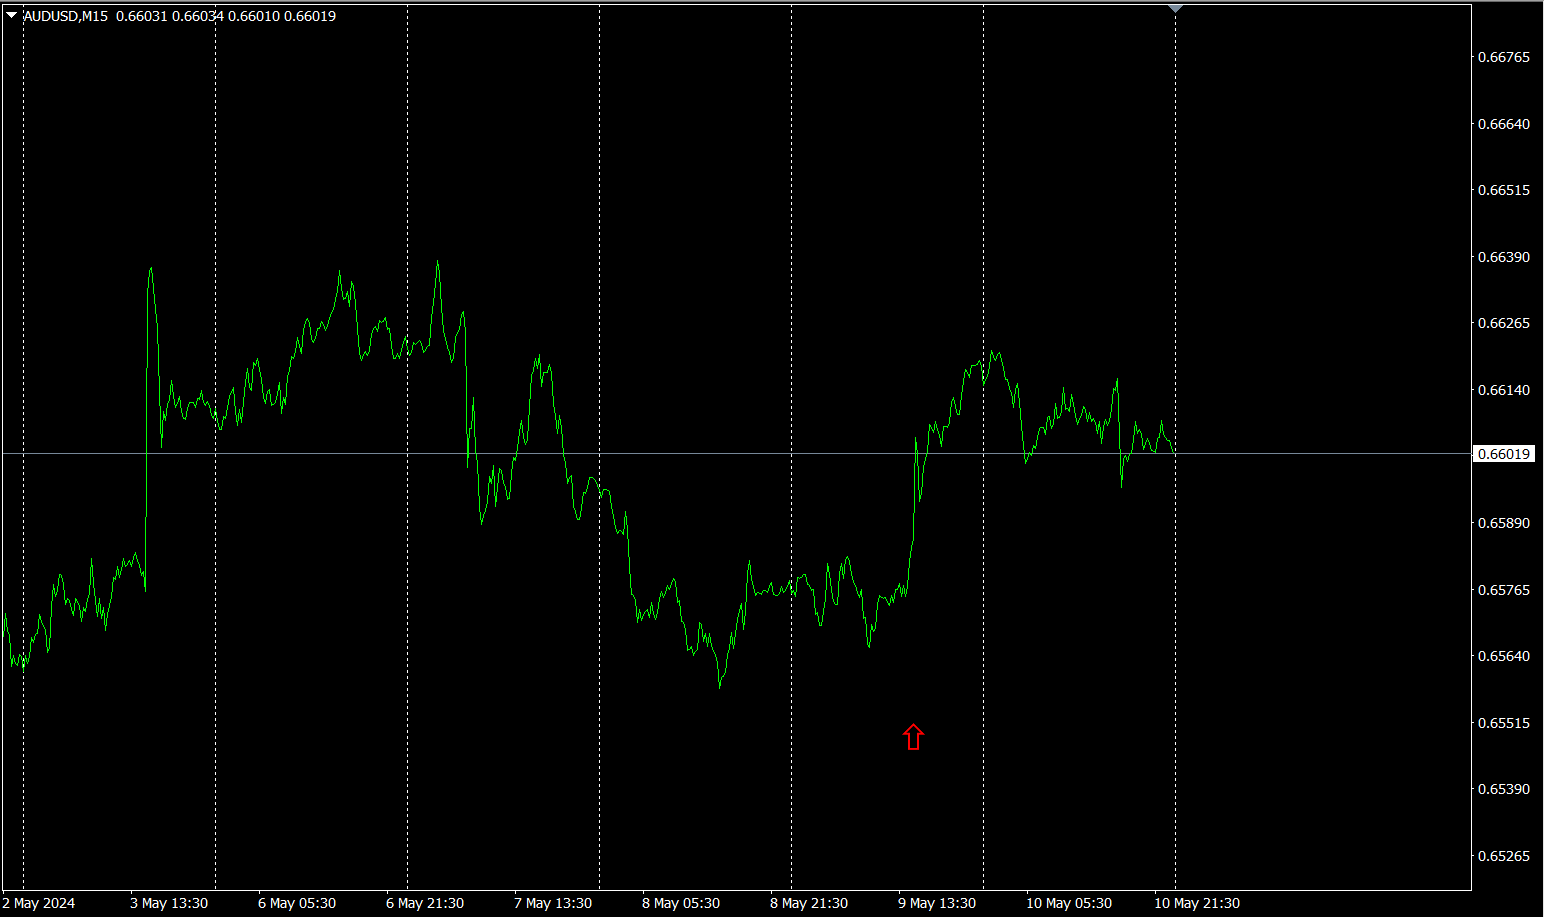
Now, let’s look at the AUDUSD chart.
The red arrow marks the screenshot point. It has surged indeed. After exceeding the recent high, a buy trade yielded about40pips of profit.
The “28 Currency Pairs Best Select Indicator” helps you easily identify which of the 28 currency pairs is currently in the strongest trend. It also tells you whether you should trade now with color-coded numerical values. It provides a quick overview of all currency pairs’ movements.
The “28 Currency Pairs Best Select Indicator”29
https://www.gogojungle.co.jp/tools/indicators/35128

3. 2021 year May, EURJPY movement: what happened?
From2021 May, EURJPY movement is being tracked.
To view overall trends, a30currency pairs Best Select Indicator-minute chart showing roughly the last3 weeks is drawn.
Previously I wrote the following:
Because of forex interventions,JPY briefly strengthened, but this was limited and it has already fallen. Meanwhile, has been rising, so going forward, is expected to rise.
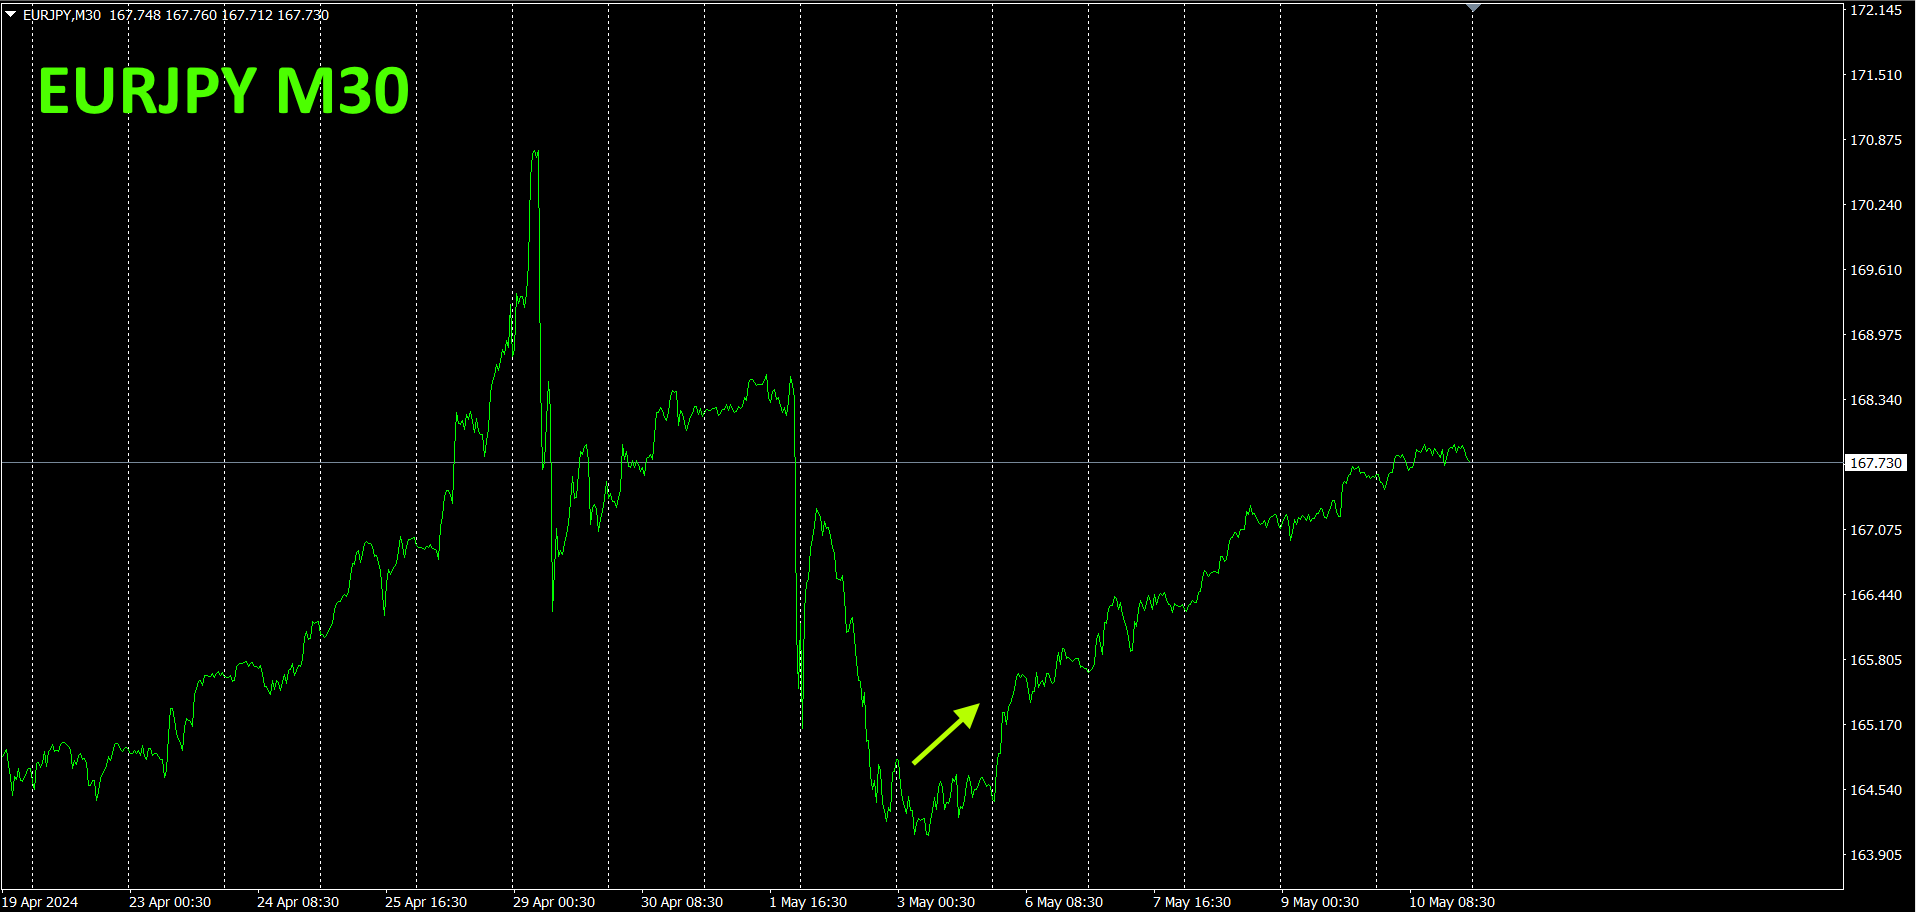
As predicted, it has continued to rise gradually. If you had bought on Monday morning, you could have earned about330pips by the end of the week.
minutes of currency strength chart.
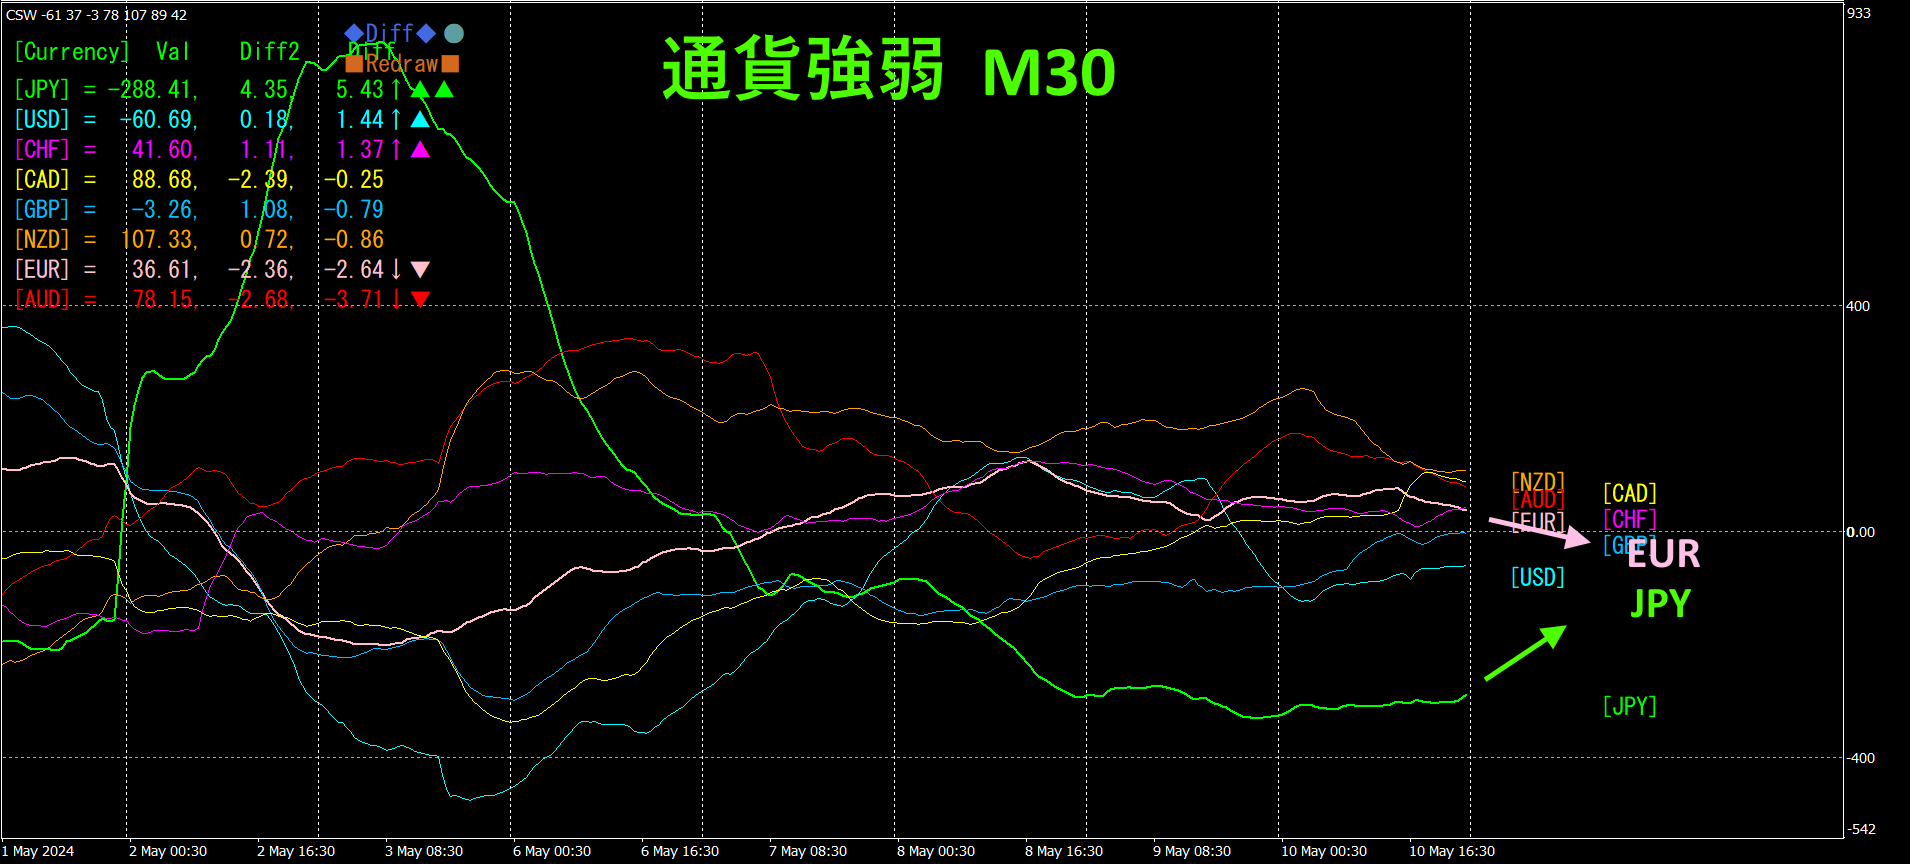
Pink indicatesEUR, green indicatesJPY briefly became the strongest currency, but this state could not last, and it fell back to being the weakest. Subsequently, turned slightly upward, while turned slightly downward, so in the future is expected to reach a plateau and move slightly downward.
4. Two new indicators have been released.
“Toretore Indicator” and “Toretore28CP_Select Indicator.”
These are built on the concept of considering the market as waves, trading only in the direction from convergence to expansion within cycles of convergence/divergence (and not trading at other times).
Please see the product pages below.
“Toretore Indicator”
https://www.gogojungle.co.jp/tools/indicators/50115

“Toretore28CP_Select Indicator”
https://www.gogojungle.co.jp/tools/indicators/50203
5.
Trade example using the “Toretore Indicator” (GOLD))
GOLD is on a15-minute chart with the “Toretore Indicator.” Wait for the main line to converge sufficiently before starting trading. If the main line is red, it’s a sell; if blue, a buy.
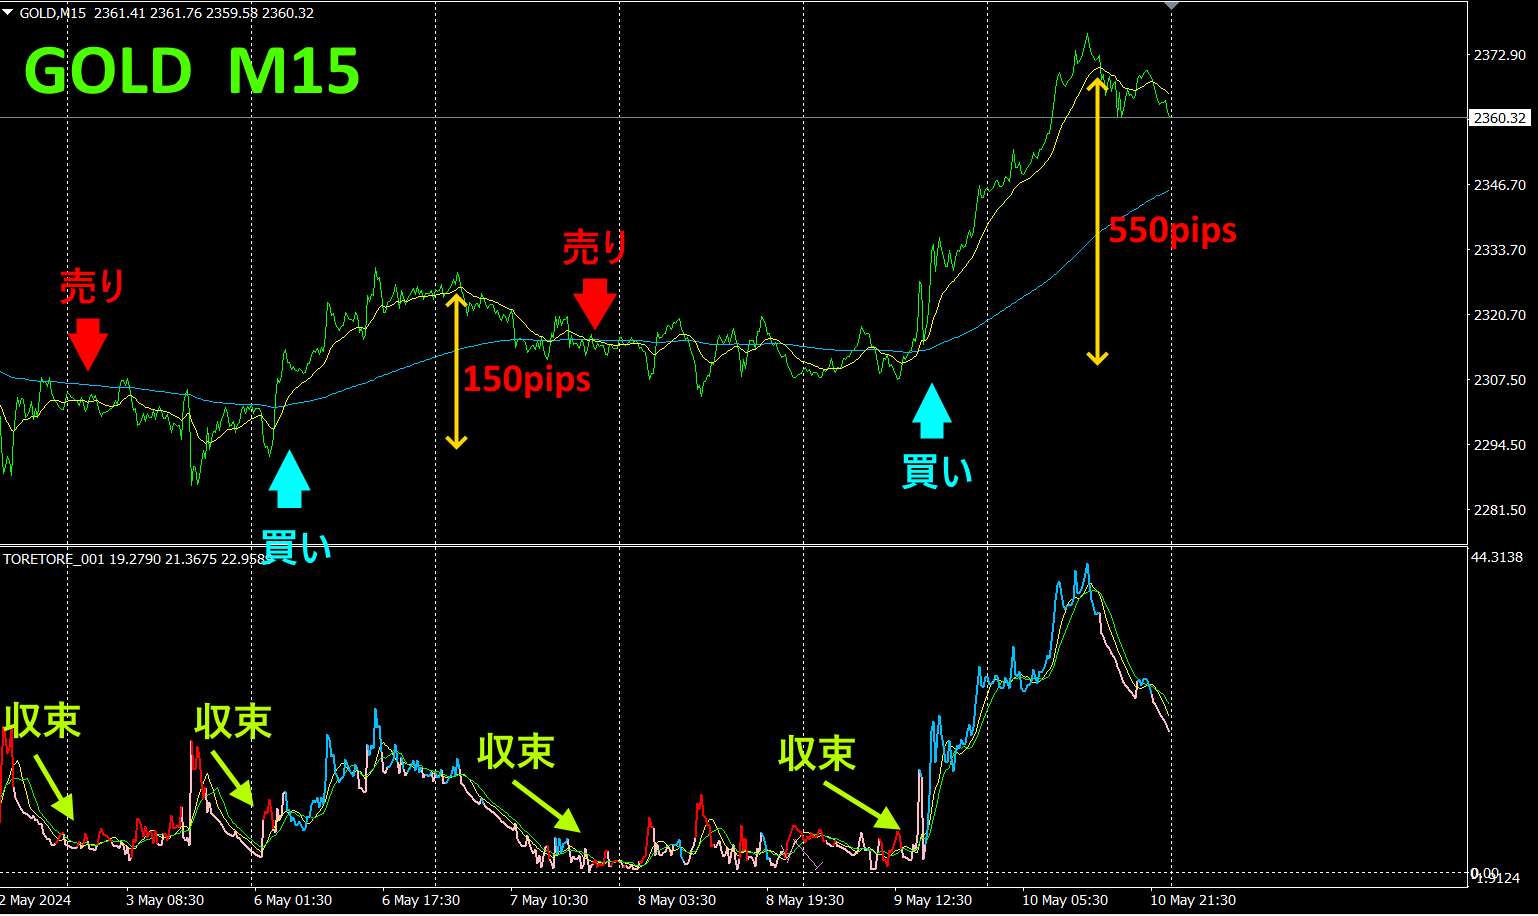
Wait for the main line of the “Toretore Indicator” to converge. After convergence, the point where it moves toward expansion becomes an excellent entry point. If the indicator turns red, it’s a sell; if blue, a buy. In the chart above forGOLD, the long-term timeframe shows an uptrend, so focusing on buying alone is fine. Trading on two buying points yielded150pips+550pips total700pips
has high volatility, so targeting only the upward moves yields substantial profits.
6.
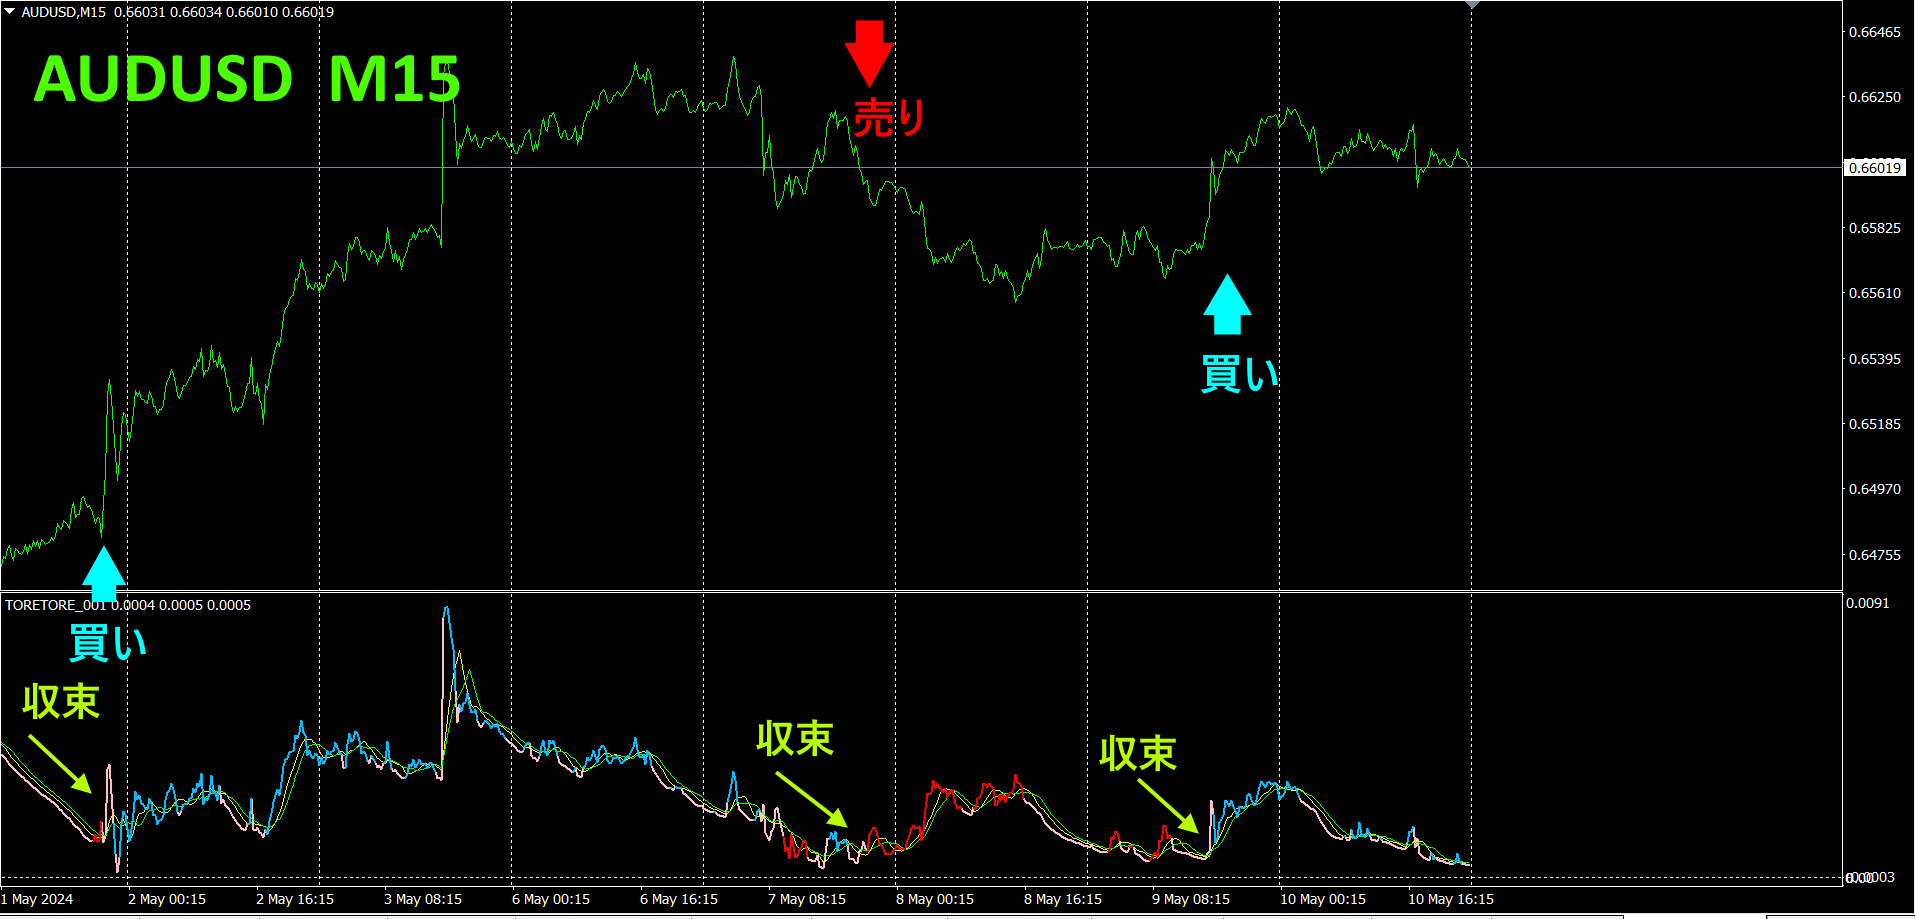
Trade example using the “Toretore Indicator” (AUDUSD)
AUDUSD on a15-minute chart with the “Toretore Indicator.” Wait for the main line to converge sufficiently before starting the trade.
Wait for convergence to avoid overpriced entries, allowing only carefully selected trades. In this example, the long-term trend is up, so buying only is appropriate. It would be a selective two-buy-per-week strategy. This alone yields about140pips of profit.
7.
Recommended indicators
“8C Currency Strength Visualization Indicator” is described on the following pages.

MT4 version https://www.gogojungle.co.jp/tools/indicators/39150
MT5 version https://www.gogojungle.co.jp/tools/indicators/39159
【My items for sale】


