

Utilization of the "Visualization Indicator" (Part 145)
Utilization of the "Visualization Indicator" (part145)
1. Further evolve the "28 Currency Pairs List Indicator" into an indicator
“8CPVisualization Indicator”to plotUSDJPY.
There are versions of the “8CPVisualization Indicator”Oceania版,LondonNewYork版、版、AnyCP版があります。今回は、London版を使いました。
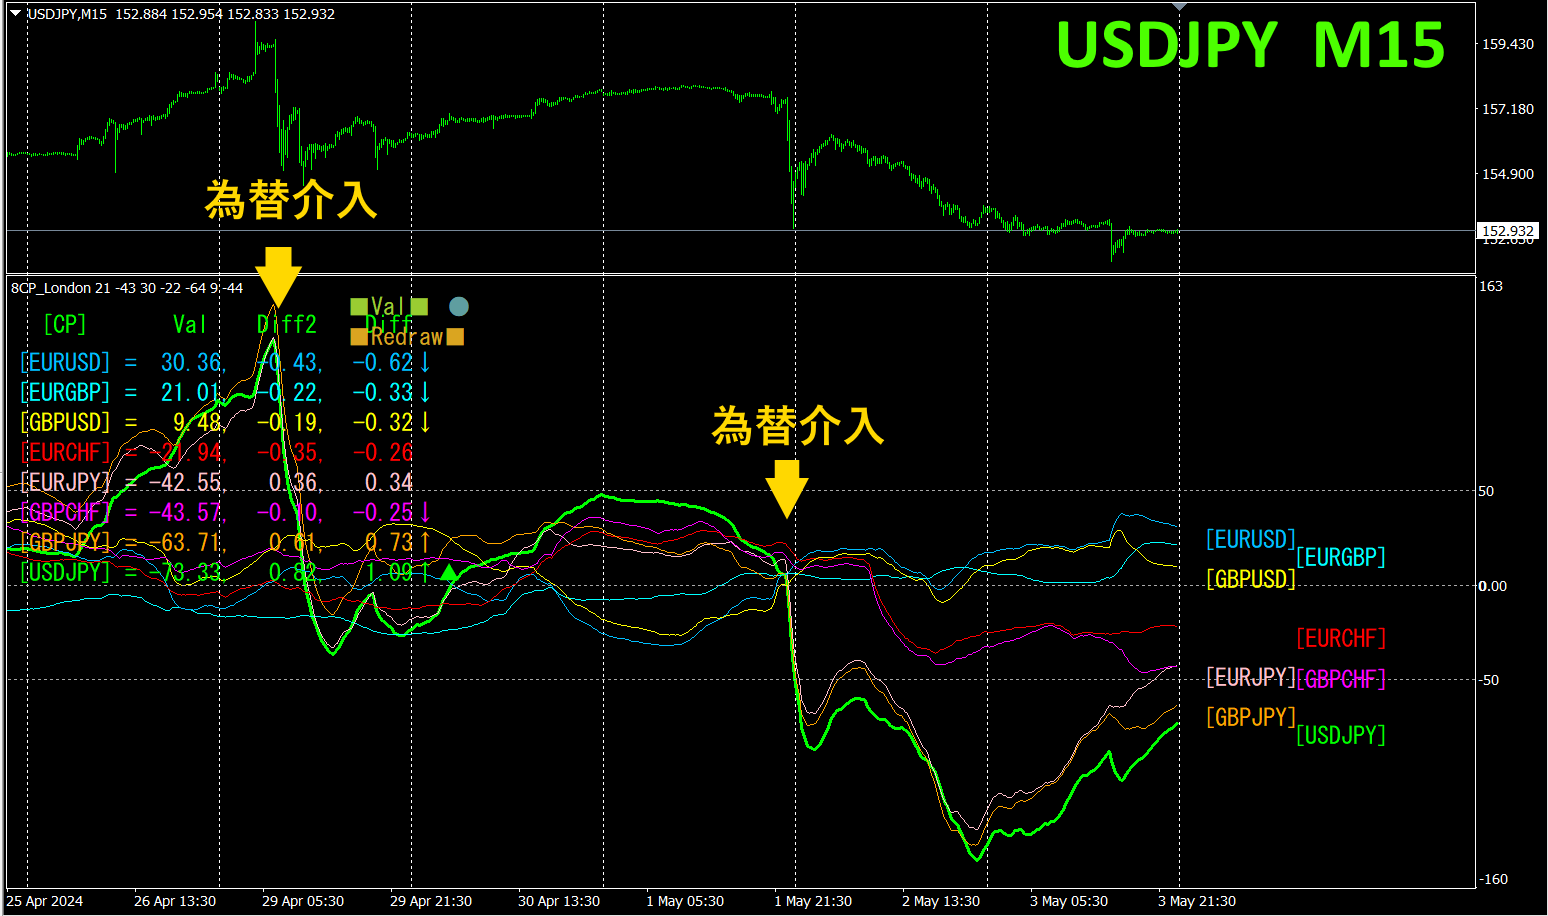
The top half is the 15-minute chart ofUSDJPY. The bottom half shows the results from the “8CPVisualization Indicator”; the solid green line graph corresponds toUSDJPY.
2The effects of two rounds of currency intervention are clearly visible in the currency strength chart. Each has fallen by more than about400pips, so if you caught the initial move of the decline, you could have made a substantial profit.
The “8CPVisualization Indicator” allows efficient trading simply by focusing on the most volatile currency pair.
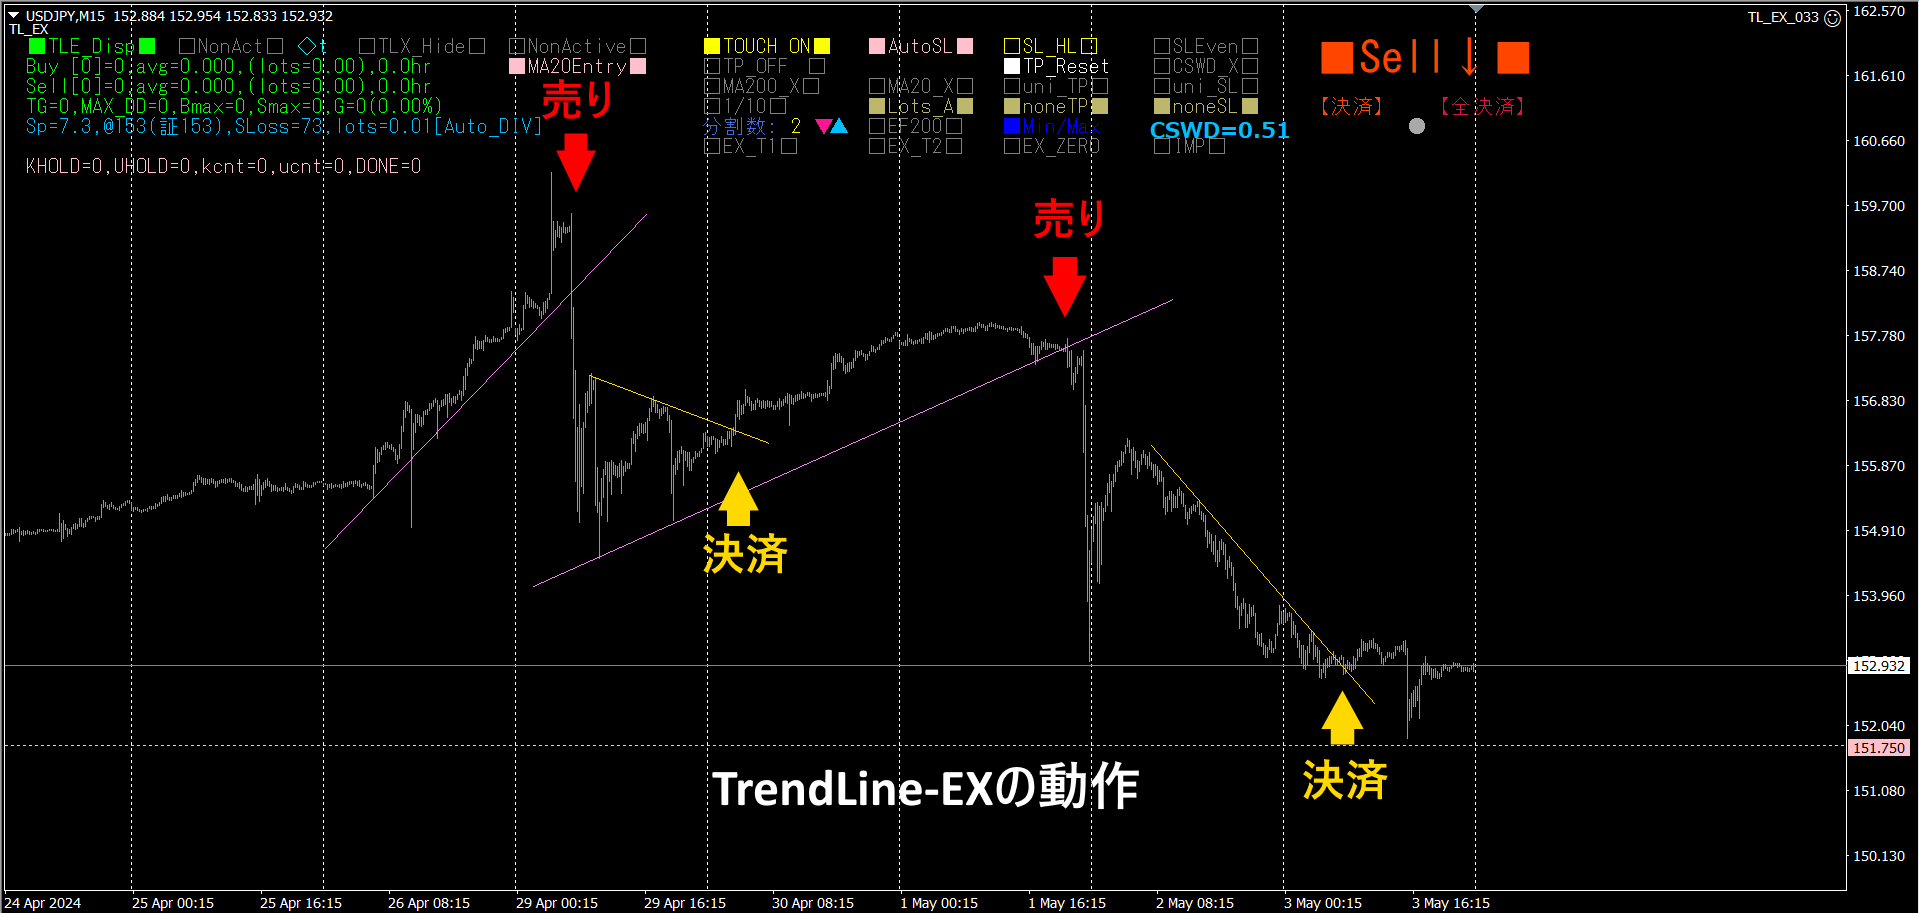
If you were using the “TrendLine-EX, you could have set up in advance. With the “TrendLine-EX trend line, automatic selling when the price breaks below and automatic closing when it breaks above is a semi-automatic EA.
※ Recommended indicators
With the semi-automaticEA, if you have the “Trend Line EX
“Trend Line EX”

https://www.gogojungle.co.jp/tools/indicators/42257
2. Best SelectTry the indicator
The following image is a screenshot taken on2024年月29日10:35(JST)
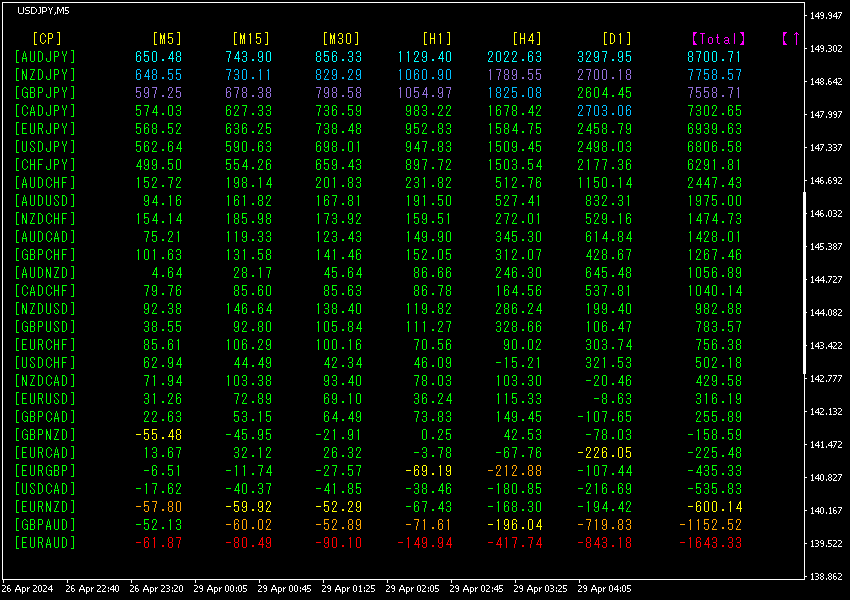
[Total]The numbers are sorted in descending order. The top row’sAUDJPY is blue in all timeframes. Moreover, theTotal value is 8700.71, a large positive number. The total value ofTotal is8700, which is unusually high and suggests abnormal forex movement.
Now, let’s look at theAUDJPY chart.
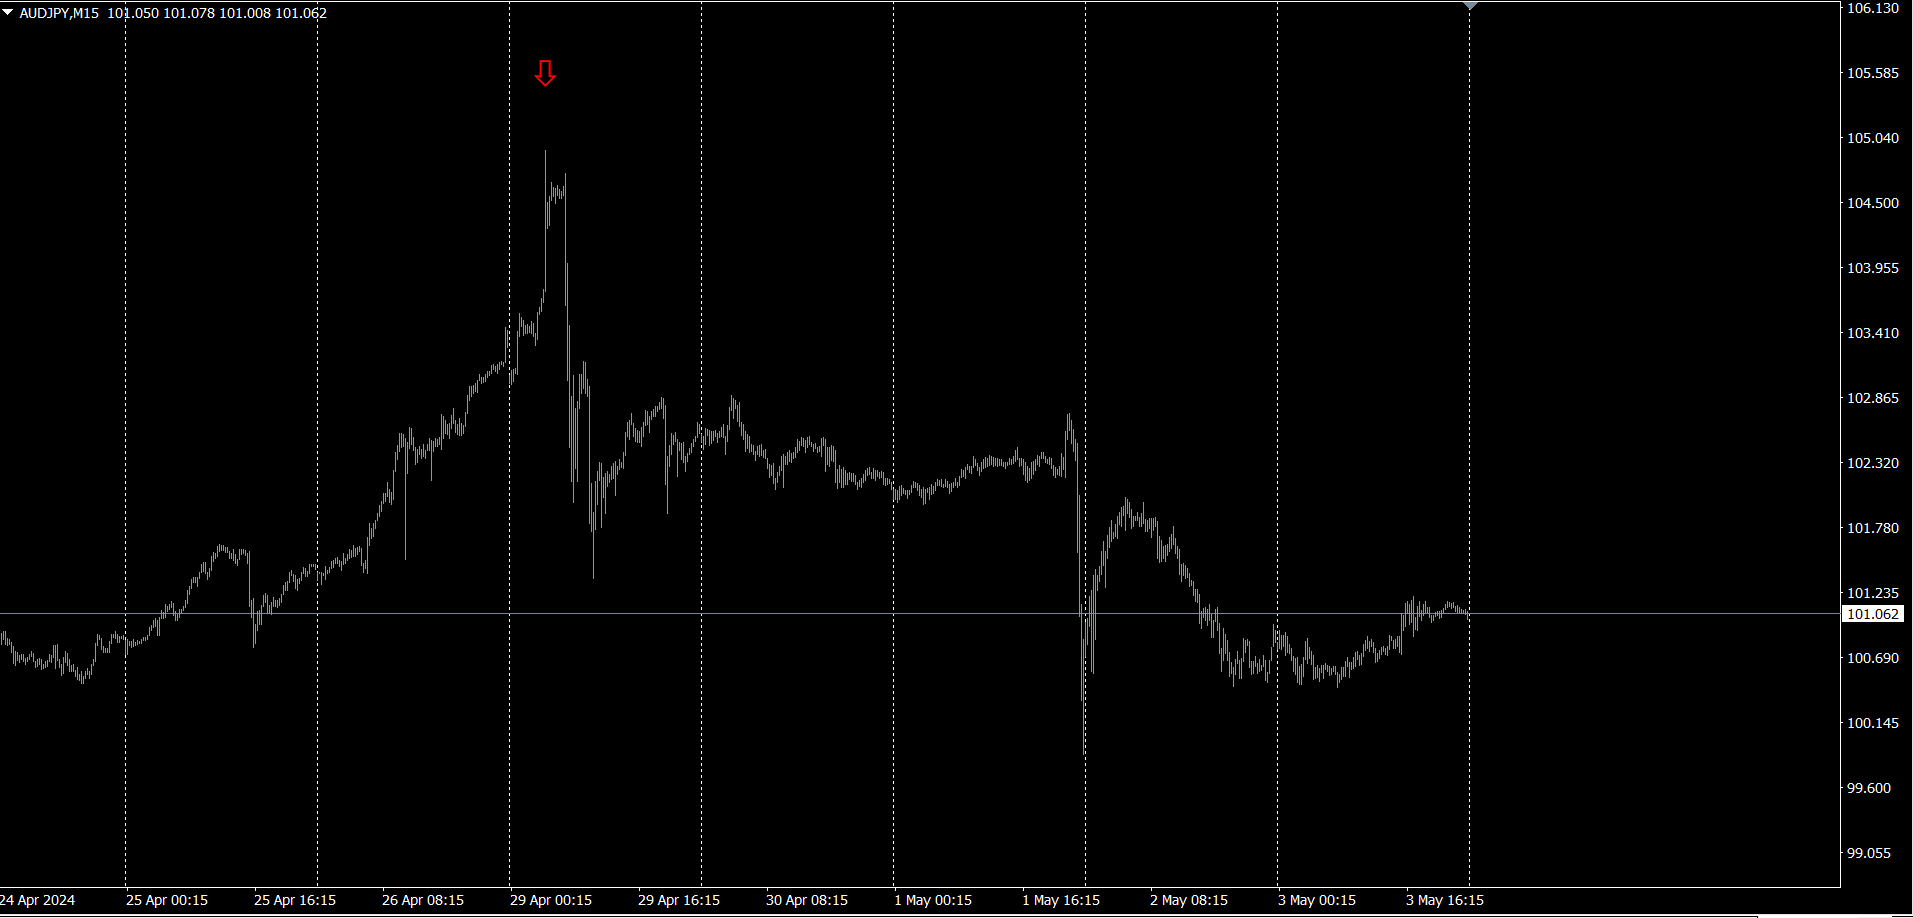
The red arrows mark the point where the screenshot was taken. This area shows a long upper wick with a temporary surge. After that, the Bank of Japan’s intervention causedAUDJPY to plunge. When the numeric value is excessively abnormal, it’s prudent not to jump in hastily and instead be prepared for something unusual.
“28 Currency PairsBest Select
“28 Currency PairsBest Select
https://www.gogojungle.co.jp/tools/indicators/35128

3. 2021年5月から追っているの動きはどうなった?EURJPY
2021年5月からEURJPY
全体の流れを見るため、30分足チャートで直近約3週間分を描いています。
前回は、次のように書きました。
通貨強弱の点から眺めると、EURの強さは変わっていないのに対して、JPYが急激に弱くなったことが認められます。今後もEUR>JPYなので、EURJPYの上昇傾向は継続するものと考えられます。
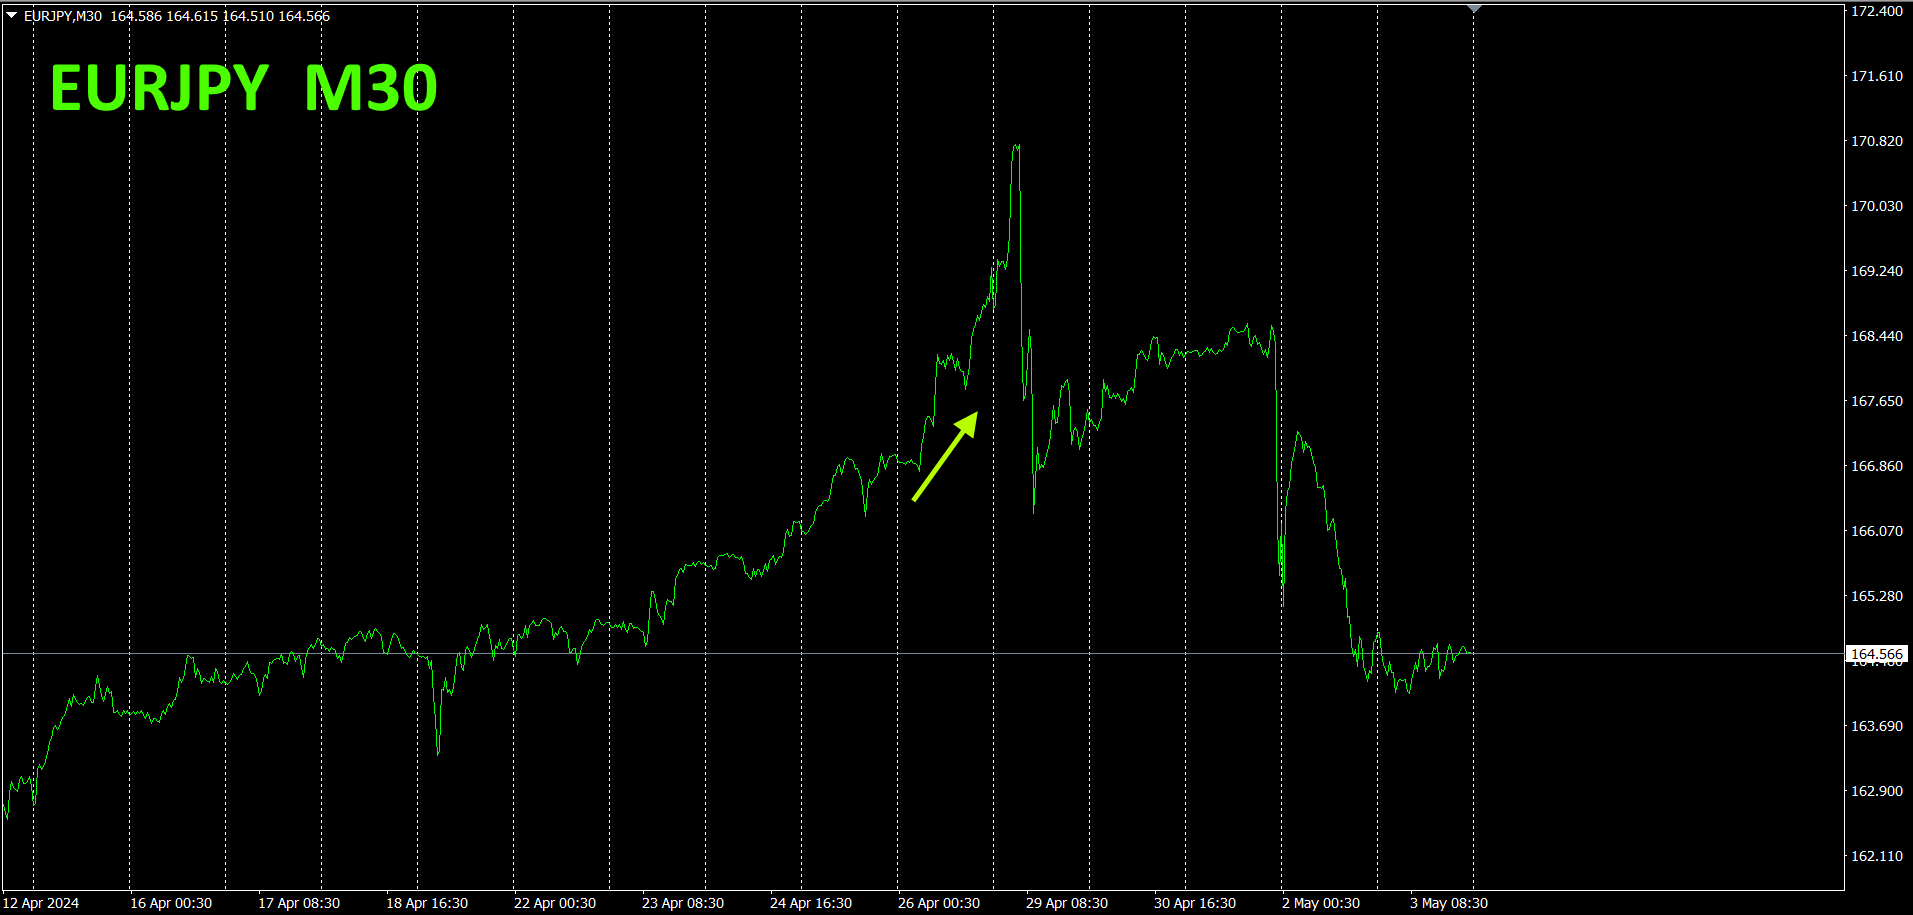
月曜日は、先々週からの上昇が継続して急角度で上げてきましたが、その後の為替介入により、2段下落して、元の水準に戻ってきました。
30分足の通貨強弱チャートです。
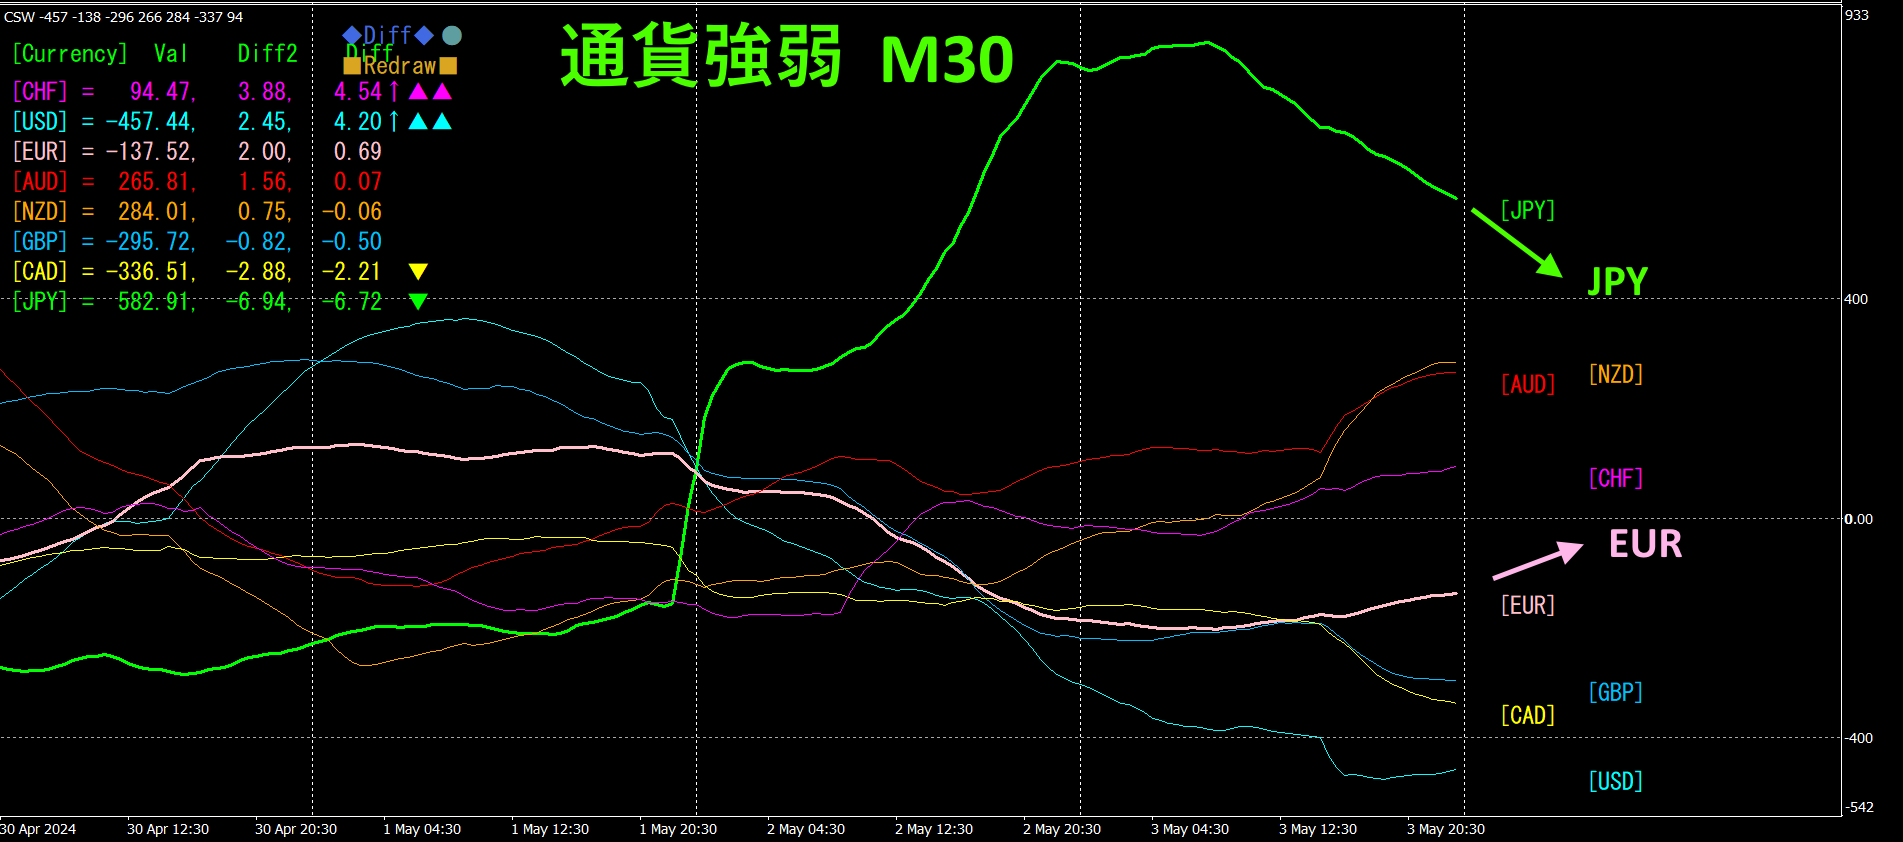
ピンク色がEUR、緑色がです。為替介入の影響で、JPYは一時的に強くなりましたが、限定的であり、既に下落してきています。一方は上向きになっているので、今後は上昇すると考えられます。
4. Two new indicators released.
“Tore Tore Indicator” and “Tore Tore28CP_SelectIndicator”.
These are built on treating the market as waves, trading only in directions where convergence turns to divergence (and not trading at other times).
Please see the product pages below.
“Tore Tore Indicator”
https://www.gogojungle.co.jp/tools/indicators/50115

“Tore Tore28CP_SelectIndicator”
https://www.gogojungle.co.jp/tools/indicators/50203
5.
Trade example using the “Tore Tore Indicator” (NZDUSD)NZDUSD
分足に「とれとれインジケータ」を導入します。インジケータのメイン線が、十分に収束するのを待ってから、トレードを開始します。メイン線の色が赤なら売り、青なら買いです。
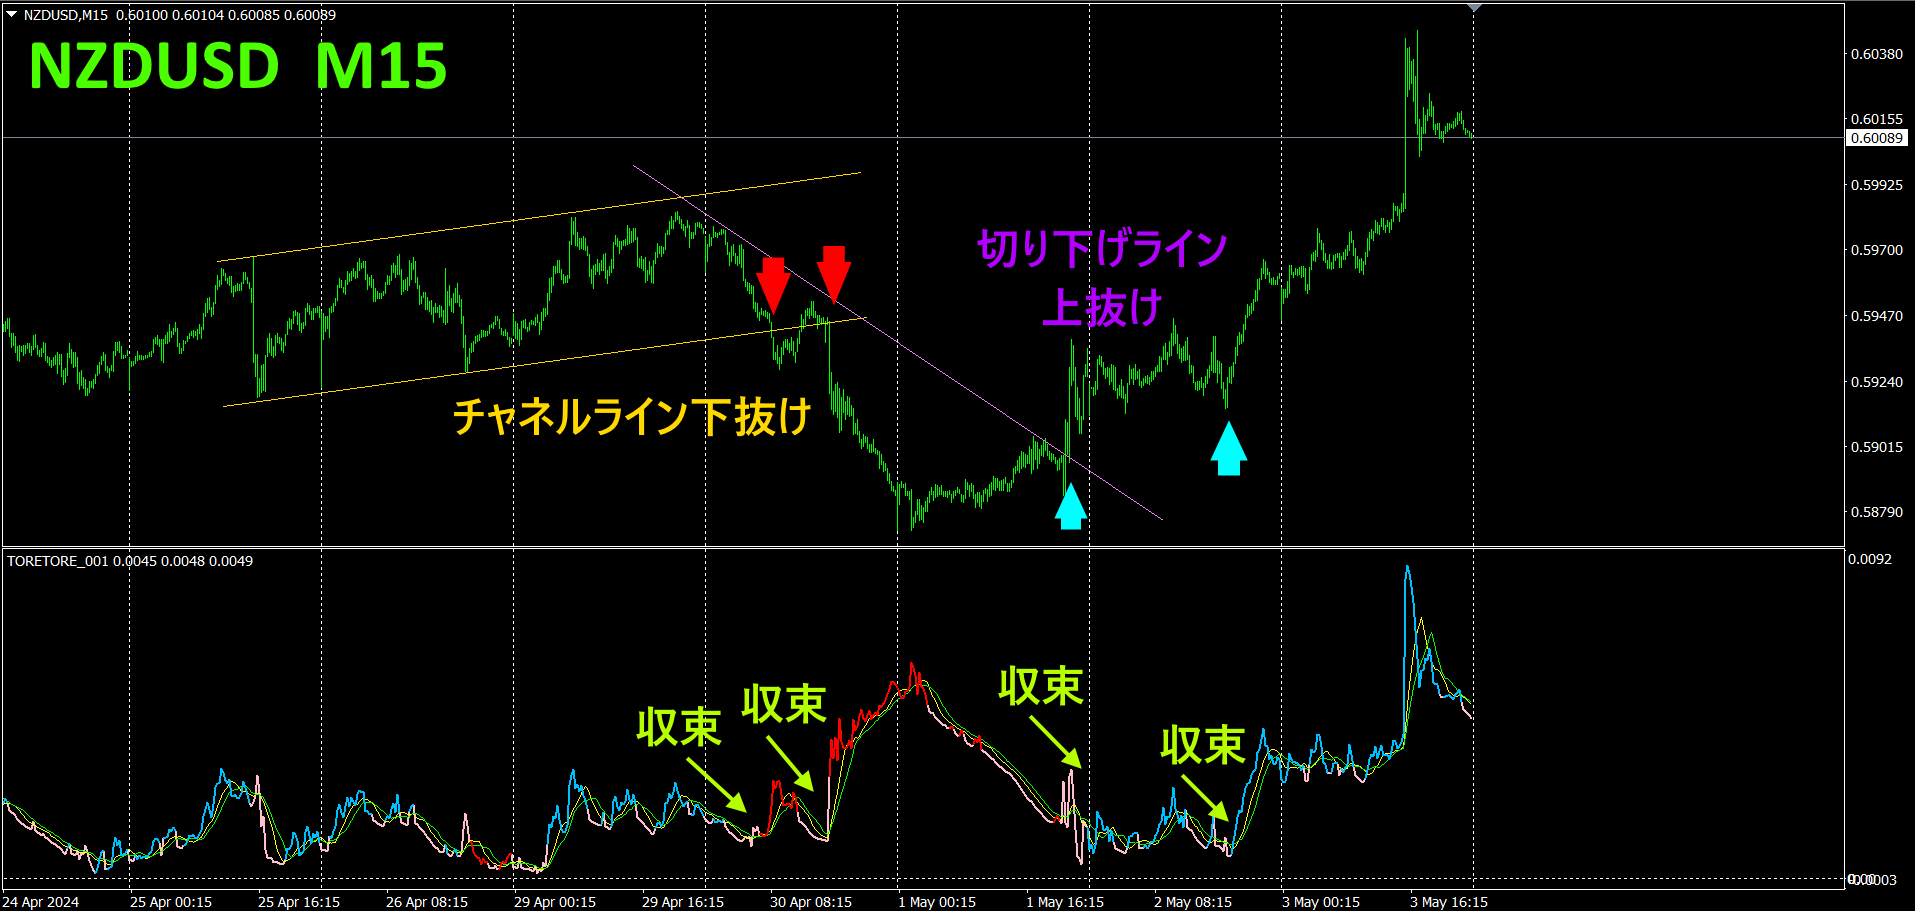
The point where the main line of the Tore Tore Indicator converges provides an excellent entry. The point where it breaks below the channel line and where the Tore Tore Indicator converges aligns perfectly. Since the color is red, selling here yields about70pips profit. Next, when the descending line breaks above, the convergence of the Tore Tore Indicator aligns nicely, and a buy entry is made as the color changes to blue after convergence. This yields an excellent dip-buying opportunity with about120pips profit. In total, the Tore Tore Indicator captured190pips of profit.
6.
Recommended indicators
Please refer to the page for the “8C Currency Strength Visualization Indicator.”

MT4 Version https://www.gogojungle.co.jp/tools/indicators/39150
MT5 Version https://www.gogojungle.co.jp/tools/indicators/39159
【My items for sale】


