

Utilization of the "Visualization Indicator" (Part 144)
Usage of the “Visualization Indicator” (that144)”
1. Further evolving the “28 Currency Pairs List Indicator” into an indicator
“8CPVisualization Indicator”to drawGBPJPY.
The “8CPVisualization Indicator” includesOceania版 (version),London版 (version),NewYork版 (version),AnyCP版 (version).This time, we used the

The upper half is theGBPJPY 15-minute chart. The lower half is from the “8CP Visualization Indicator”; the orange thick line graph corresponds toGBPJPY.
On Tuesday,GBPJPY broke above the other graphs, so we entered a long. We closed for the week and earned about0550 pipsin profit.
With the “8CP Visualization Indicator”, focusing only on the most volatile currency pair movement allows for efficient trading.
2. Best Select indicator to try
The figure below is a screenshot taken onApril,24,2024 at10:45 (JST).

The currencies are listed in order of name. In the ninth row from the top,EURAUD shows red color across all timeframes.Total value is -2252.06, a large negative number.This indicates a significant downtrend in EURAUD.
Now, let’s look at the chart forEURAUD.

The red arrow marks the point at which the screenshot was taken, catching a sharp drop.
“28 currency pairsBest Select indicator” allows easily identifying which currency has the strongest trend among the 28 pairs. It also tells you, with numbers and colors, whether you should trade now or not. You can judge all currency pairs’ movements at a glance with this excellent indicator.
“28 currency pairsBest Select indicator”
https://www.gogojungle.co.jp/tools/indicators/35128

3. 2021年5月から追っているEURJPY
From 2021年5月,EURJPY has been tracked.
To see the overall trend, a30-minute chart shows about3 weeks of data.
Previously, I wrote the following.
In terms of currency strength, EUR has higher strength than JPY, and while both vectors are upward,EUR remains upward, whereasJPY shows a weaker upward movement. Therefore, EURJPY is expected to rise in the future.

As predicted previously, it has indeed risen.
30-minute currency strength chart.

Pink isEUR, green isJPY. From the currency strength perspective,EUR remains strong, whileJPY has weakened sharply. Going forward,EUR > JPY, so the rise ofEURJPY is expected to continue.
4. Two new indicators have been released.
They are the “Toretore Indicator” and the “Toretore28CP_Select Indicator.”
These are built on the idea of viewing the market as waves of convergence/divergence, trading only in the direction from convergence to divergence (and not trading at other times).
Please see the product pages below.
“Toretore Indicator”
https://www.gogojungle.co.jp/tools/indicators/50115

“Toretore28CP_SelectIndicator”
https://www.gogojungle.co.jp/tools/indicators/50203

5.
Trade example using the “Toretore Indicator” (EURAUD)
EURAUD on the15-minute chart with the “Toretore Indicator.” Wait for the main line to converge sufficiently, then start trading. If the main line color is red, it’s a sell; if blue, it’s a buy.
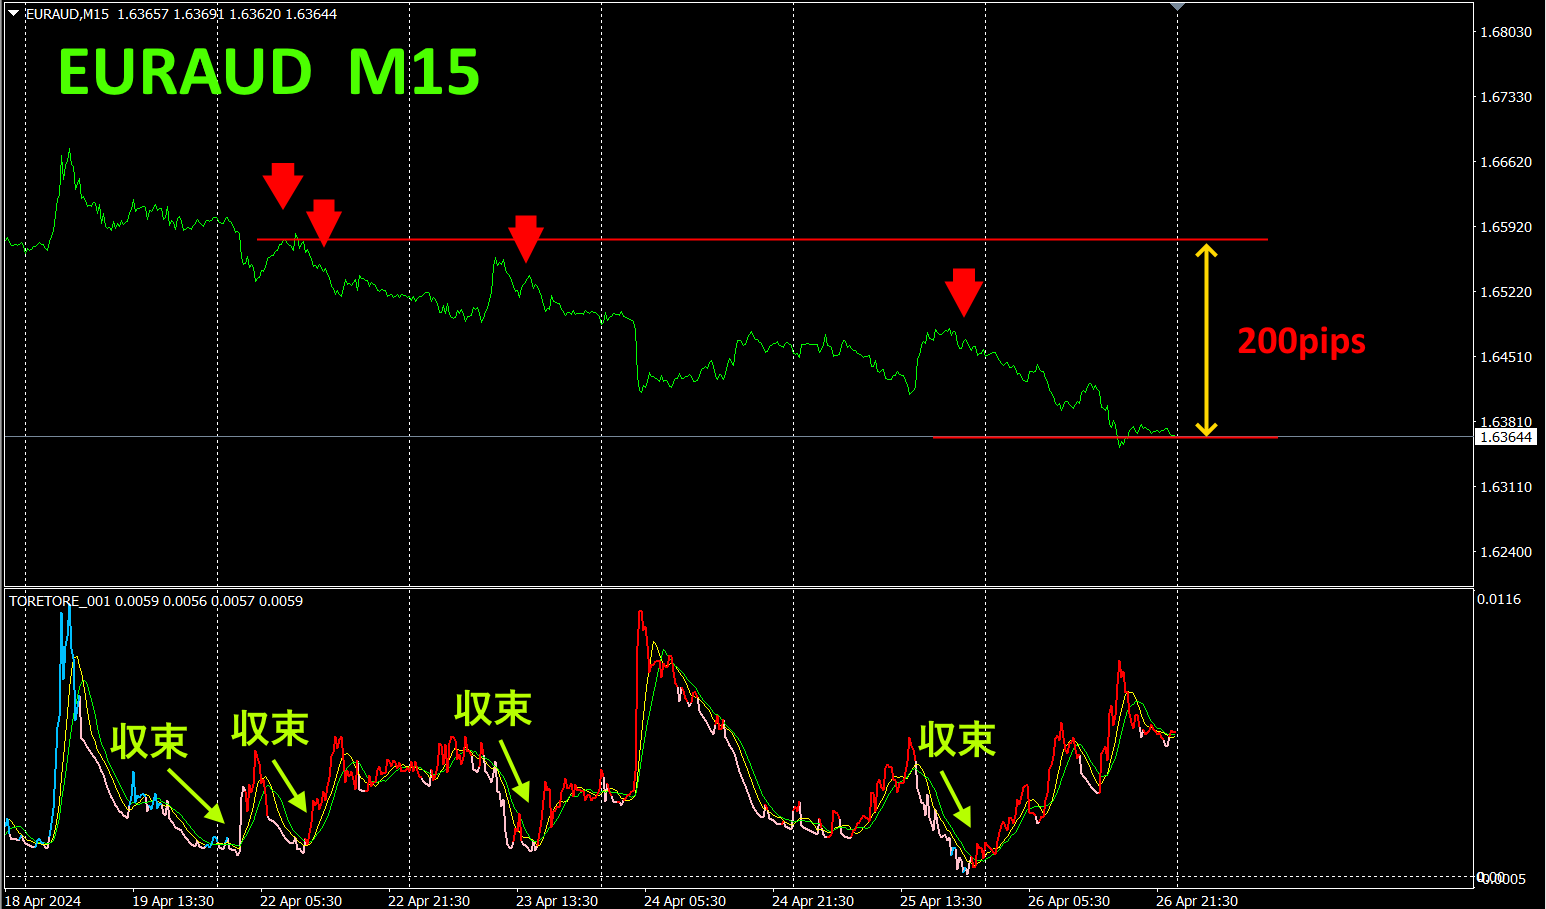
In this example, since the main line color of the “Toretore Indicator” is red, you should sell after convergence. The ideal sell point is at the location of the red downward arrow. If you hold a short position from Monday through the weekend, you could gain about200pips of profit.
6.
Recommended indicators
Semi-automaticEA, the “Trend Line EX,” lets you draw a diagonal advancing line and automatically Buy when price breaks above it and automatically close when price breaks above the rising line, enabling a passive trading approach.
※“Trend Line EX

https://www.gogojungle.co.jp/tools/indicators/42257
If you’re interested in the “8C Currency Strength Visualization Indicator,” please refer to the following pages.

MT4 version https://www.gogojungle.co.jp/tools/indicators/39150
MT5 version https://www.gogojungle.co.jp/tools/indicators/39159
【My items for sale】


