

[Cryptocurrency] Bitcoin BTC Chart Technical Analysis (Forecast from April 26, 2024 to next week) FX Pro Trader Shota [Crypto Asset]
BTCUSD 4-hour chart
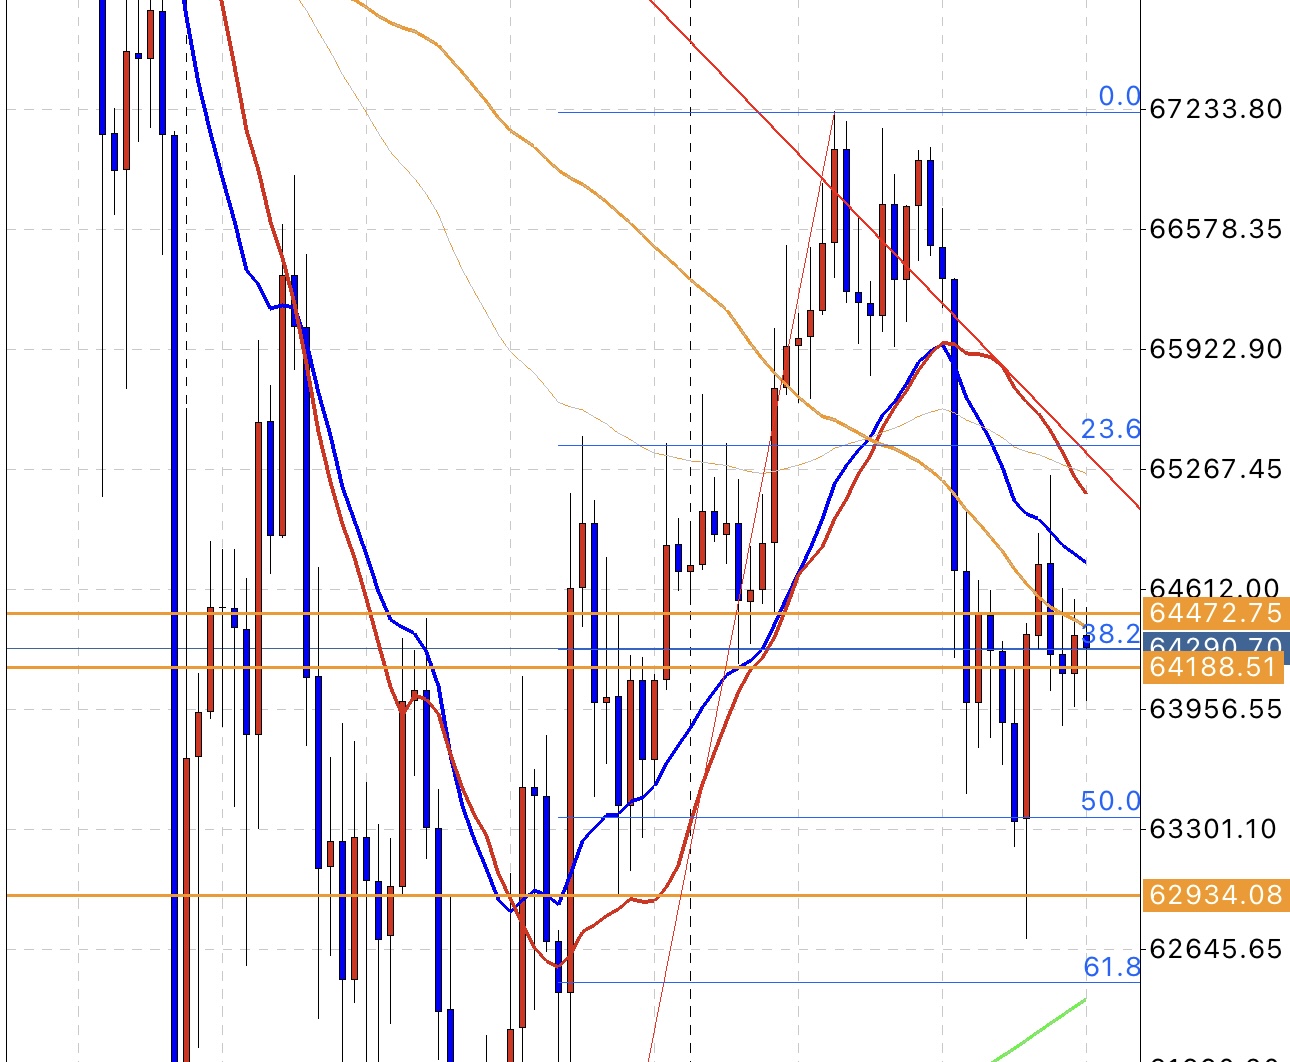
If it breaks above the 80SMA (the thick orange moving average) with momentum, the probability of also breaking above the horizontal line at 64472.75 rises.
If it breaks above the horizontal line at 64472.75, the probability of rising up to the 20EMA (blue moving average) increases.
If the 20EMA is broken to the upside as well, the probability of rising up to the 20SMA (red moving average) increases.
If the 20SMA is also broken to the upside, the upward momentum becomes quite strong, and the likelihood increases that the red resistance trendline drawn on the daily chart will also break upward.
When this red resistance trendline is broken upward, the upward momentum becomes even more enormous, and there is a high probability of reaching the high that is set at the Fibonacci retracement 0% level in not too long a time.
Conversely, if it breaks below 64188.51, the probability of falling to 63956.55 increases.
If 63956.55 is broken to the downside as well, the probability of falling to the Fibonacci retracement 50% level increases.
If the Fibonacci retracement 50% level is broken to the downside, the probability of falling to the horizontal line at 62934.08 increases.
If the horizontal line at 62934.08 is broken to the downside, the probability of falling to the Fibonacci retracement 61.8% level or to the 480SMA (the thick green moving average) increases.
If you seriously want to master trading,
for your reference.
In the Shota-style 12-point Value Pack [The Holy Grail Constant Winning Trading Skill Inheritance Program], the explanation is thatthe genuine technical analysis = the essence of discretionary trading know-how is a universal learning content that can be applied to all trades, including FX, stock investments, binary options, futures trading, and cryptocurrency assets.