

Utilization of the "Visualization Indicator" (Part 143)
“Visualization Indicator” utilization (Part143)”
1. Advance the “28 Currency Pairs List Indicator” into an indicator
“8CP Visualization Indicator to drawGBPAUD
“8CP Visualization Indicator” includesOceania version,London version,NewYork version,AnyCP version. This time, we used theOceania version.
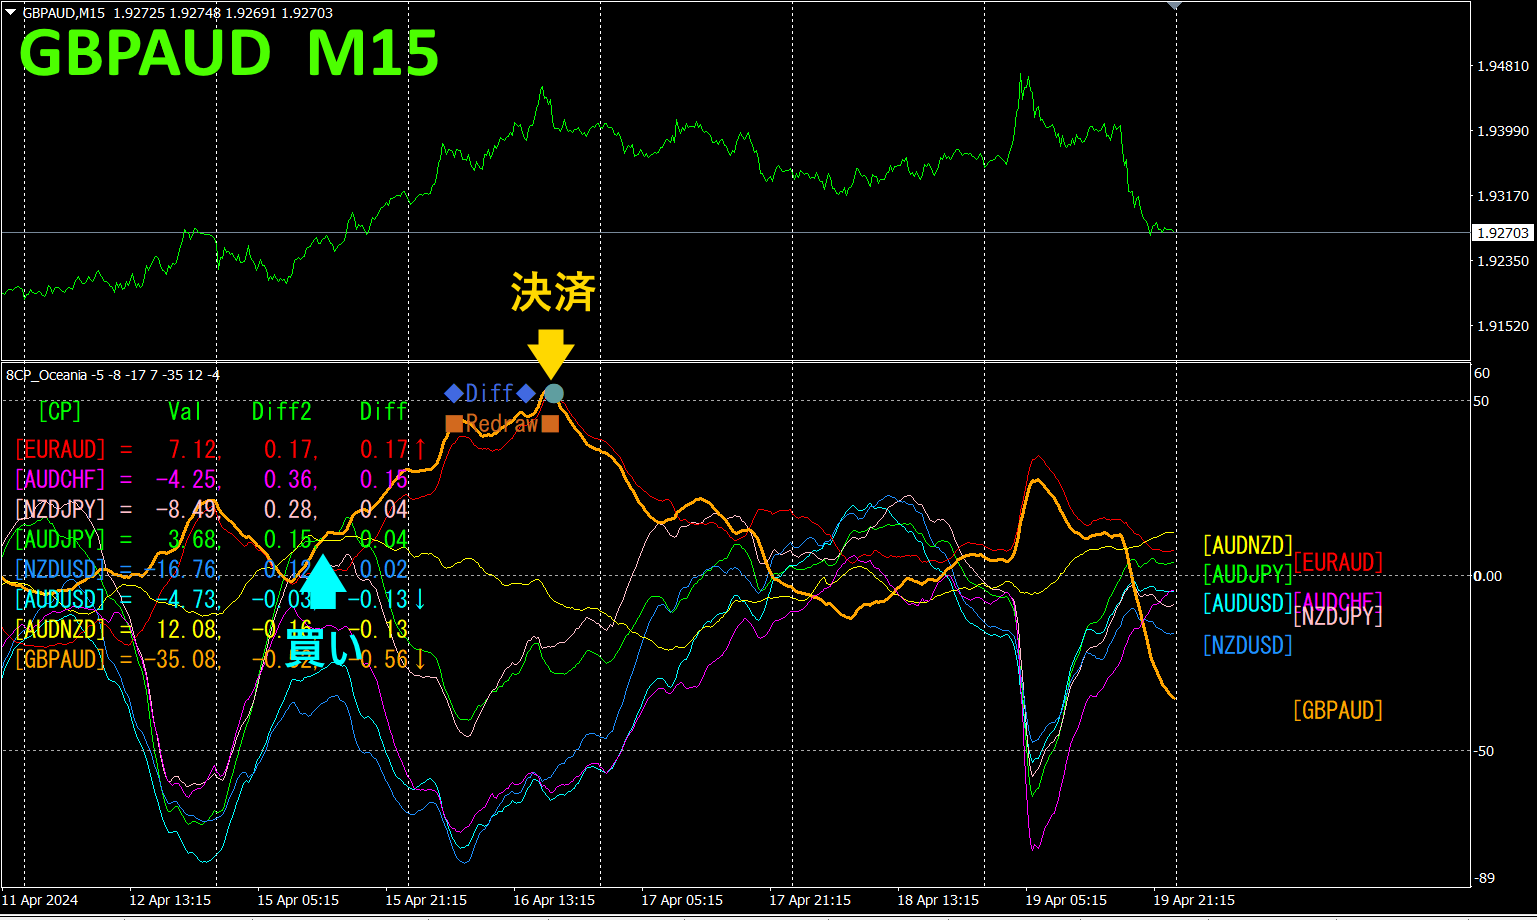
The upper half is theGBPAUD 15-minute chart. The lower half is from the “8CP Visualization Indicator”; the orange thick line graph corresponds toGBPAUD.
On Monday,GBPAUD rose above the other graphs, so we entered a long position. It peaked on Tuesday and we closed for a profit ofapproximately190pips.The profit was obtained.
With the “8CP Visualization Indicator,” you can focus only on the movement of the most volatile currency pair to trade efficiently.
2. Best Select try the indicator
The following is a screenshot fromApril,2024,16,10:40(JST) .
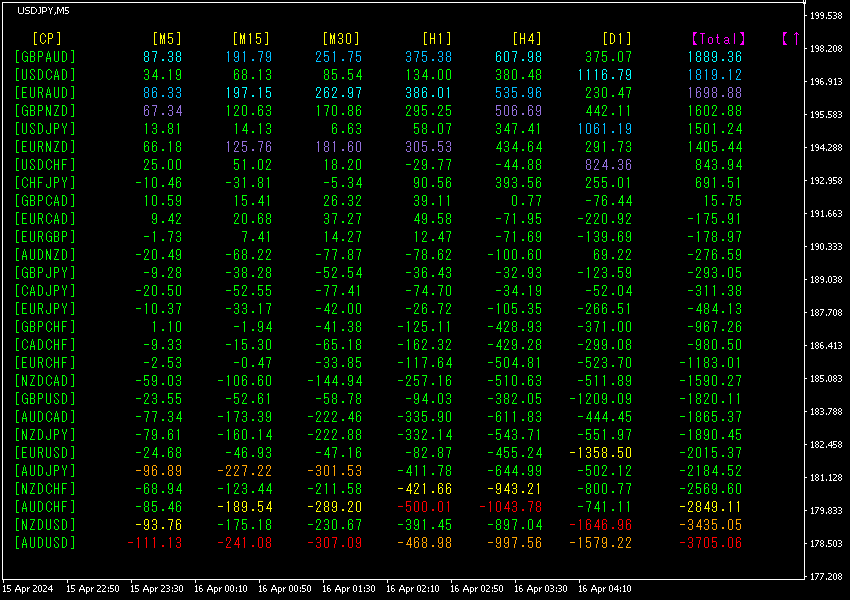
[Total] sorted in descending numerical order.1 line showsAUDUSD in red on all timeframes.Total value is -3705.06, indicating a large negative figure. shows a significant downtrend.
Now, let’s look at theAUDUSD chart.
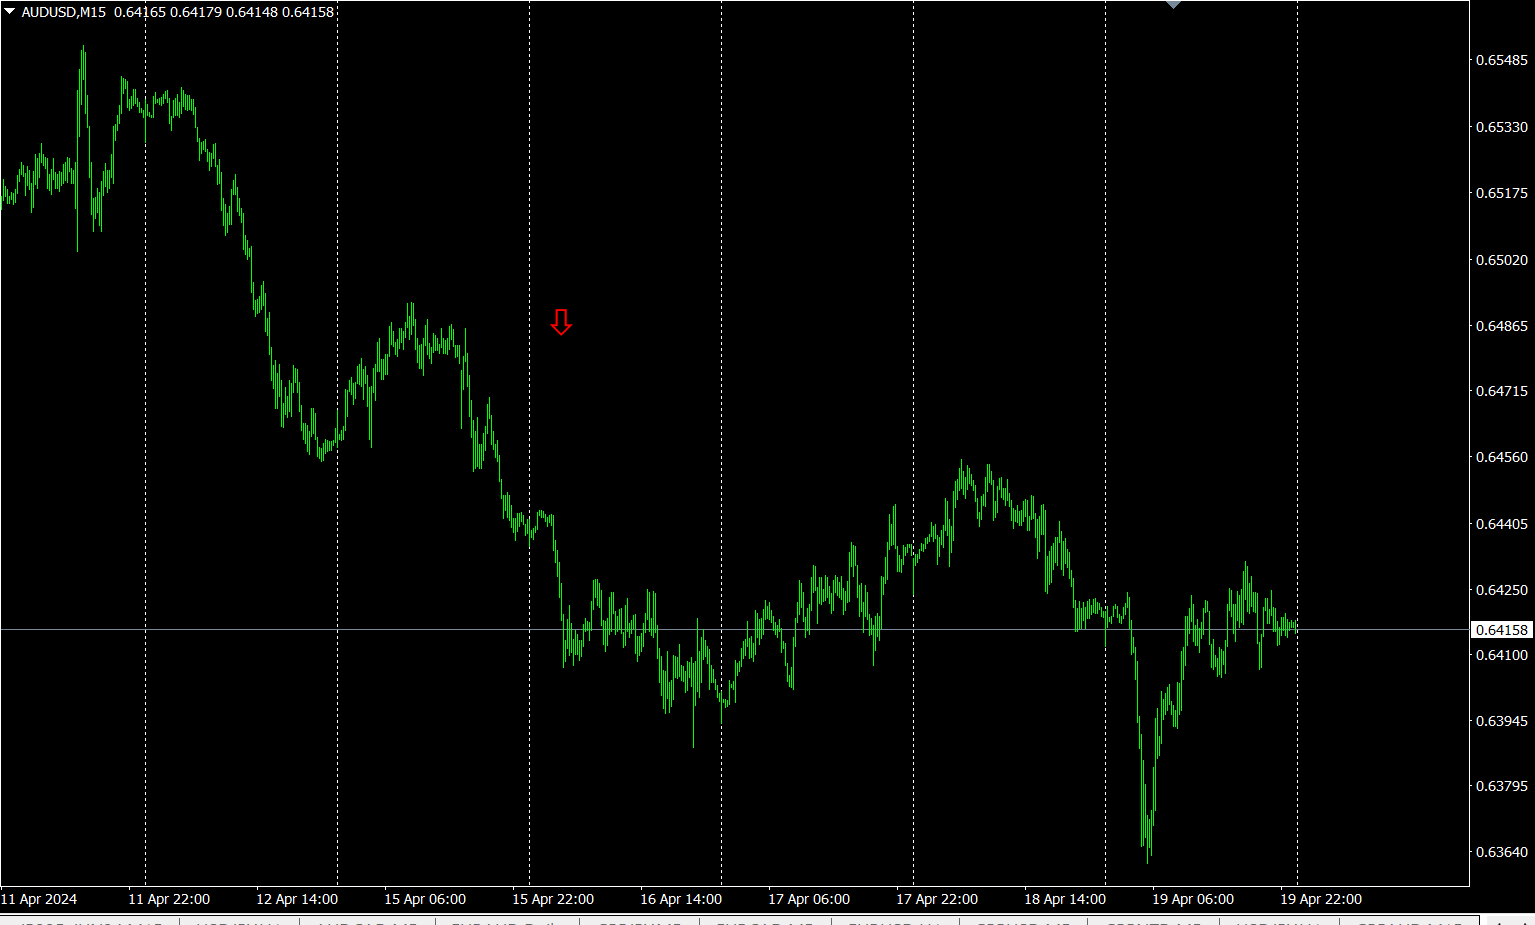
The red arrows indicate the point where the screenshot was taken, capturing the sharp decline.
“28 currency pairs Best Select indicator”
“28 currency pairs Best Select Indicator
https://www.gogojungle.co.jp/tools/indicators/35128

3. 2021 year5 month onward trackingEURJPY
We have been tracking EURJPY since May 2021.
To observe overall movement, we plot about the most recent30 minutes over roughly3 weeks.
Last time, we wrote the following.
In terms of currency strength,JPY > EUR,JPY is weakly rising,EUR is rising more strongly thanJPY, so EURJPY is expected to rise going forward.
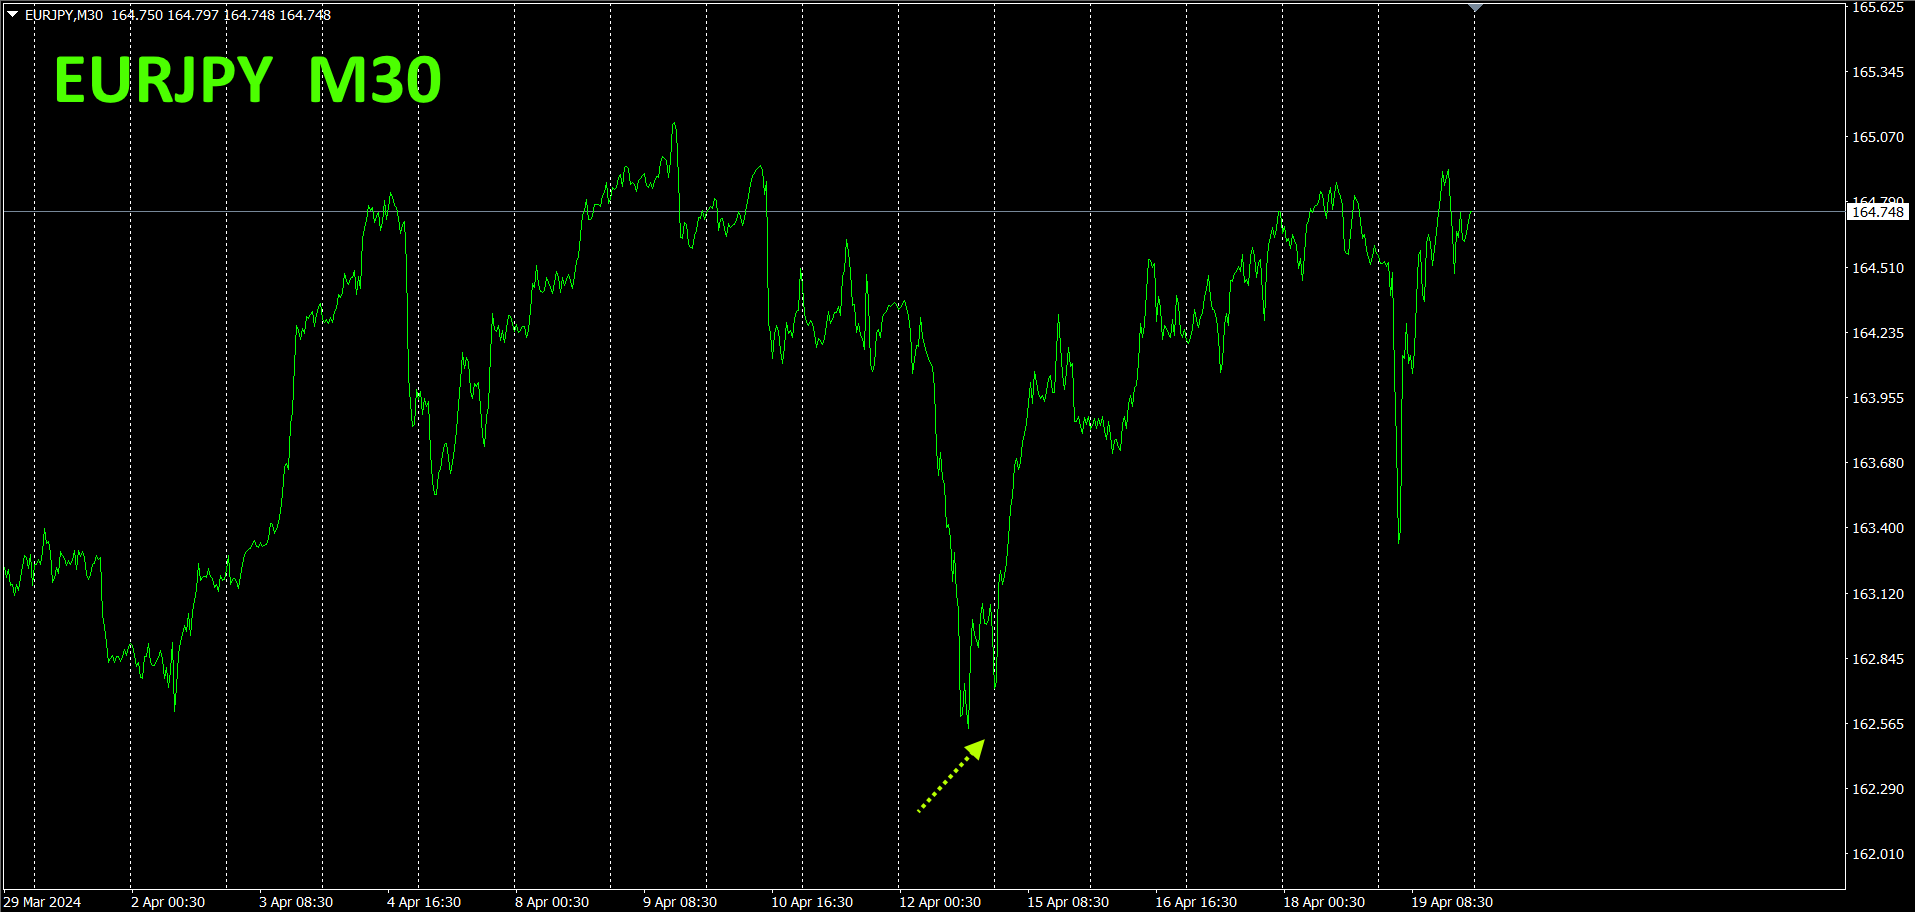
As predicted, it has indeed risen.
30 minute currency-strength chart.
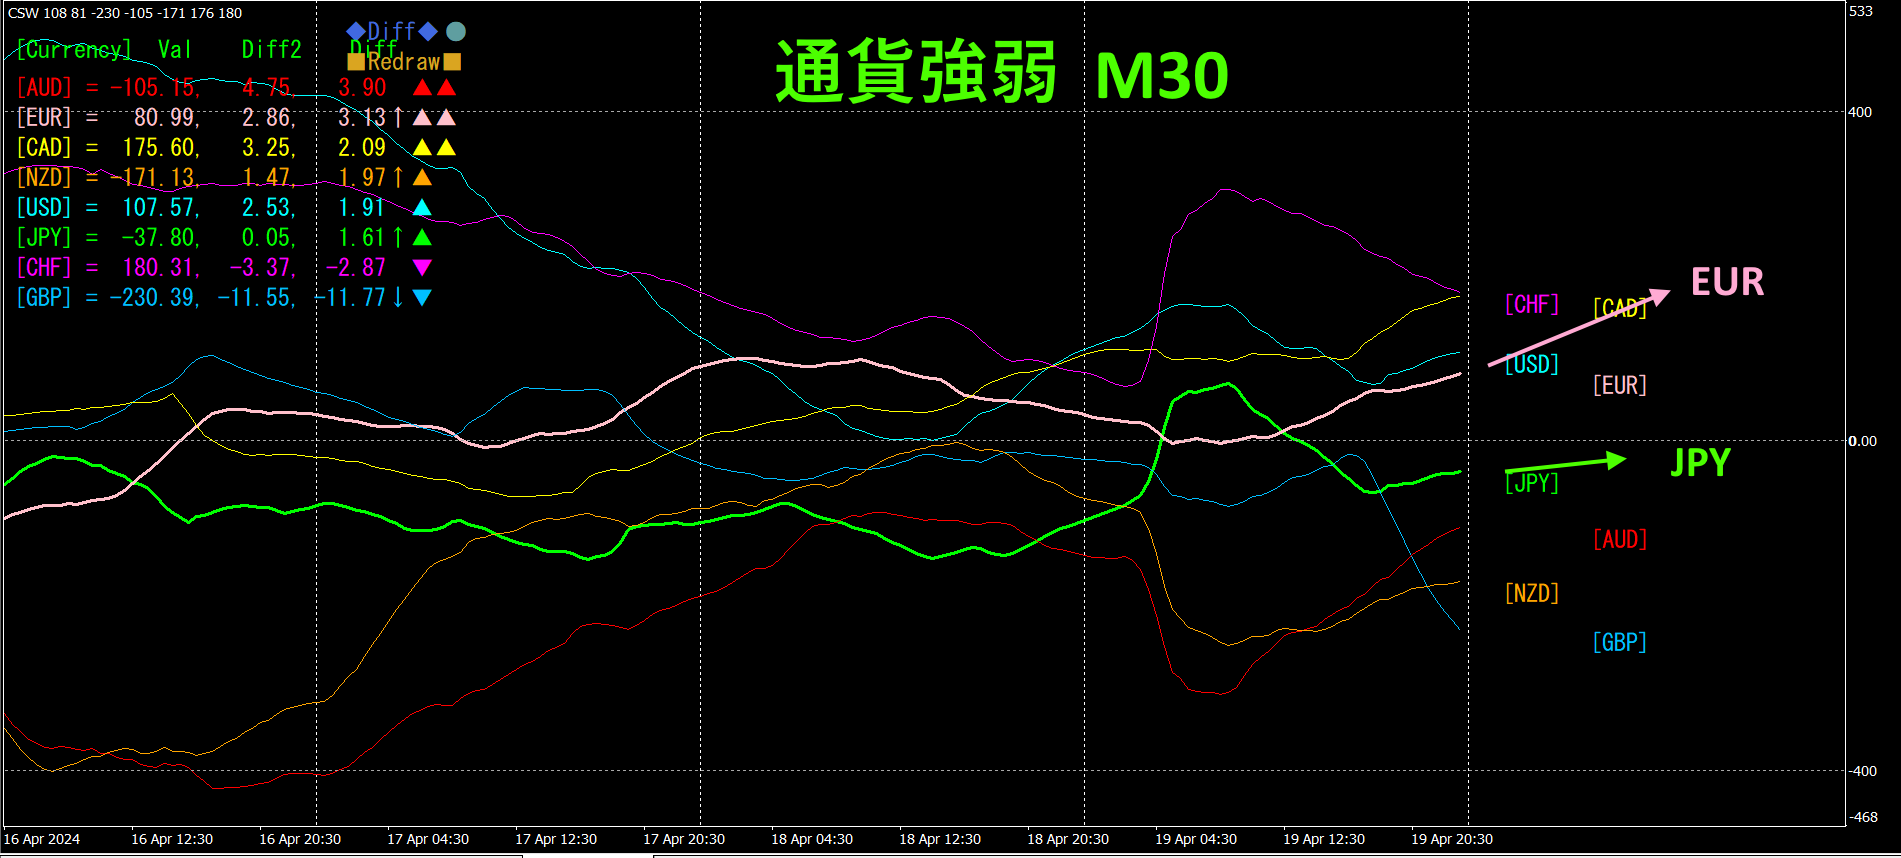
Pink isEUR, green isJPY. In terms of currency strength,EUR > JPY, and both vectors are upward, butJPY is rising weakly, whileEUR is rising more strongly thanJPY, so EURJPY is expected to rise in the future.
4. Two new indicators released.
“Toretore Indicator” and “Toretore 28CP_Select Indicator”.
These were created based on treating the market as waves and trading only when moving from convergence to divergence (not trading at other times).
Please see the product pages below.
“Toretore Indicator”
https://www.gogojungle.co.jp/tools/indicators/50115
“Toretore28CP_Select
https://www.gogojungle.co.jp/tools/indicators/50203
5.
Trade example using the “Toretore Indicator” (GBPAUD)GBPAUD
15 minutes with the “Toretore Indicator.” We introduce the indicator on the 15-minute chart. We wait for the main line to converge sufficiently, then start trading. If the main line is red, it is a sell; if blue, a buy.
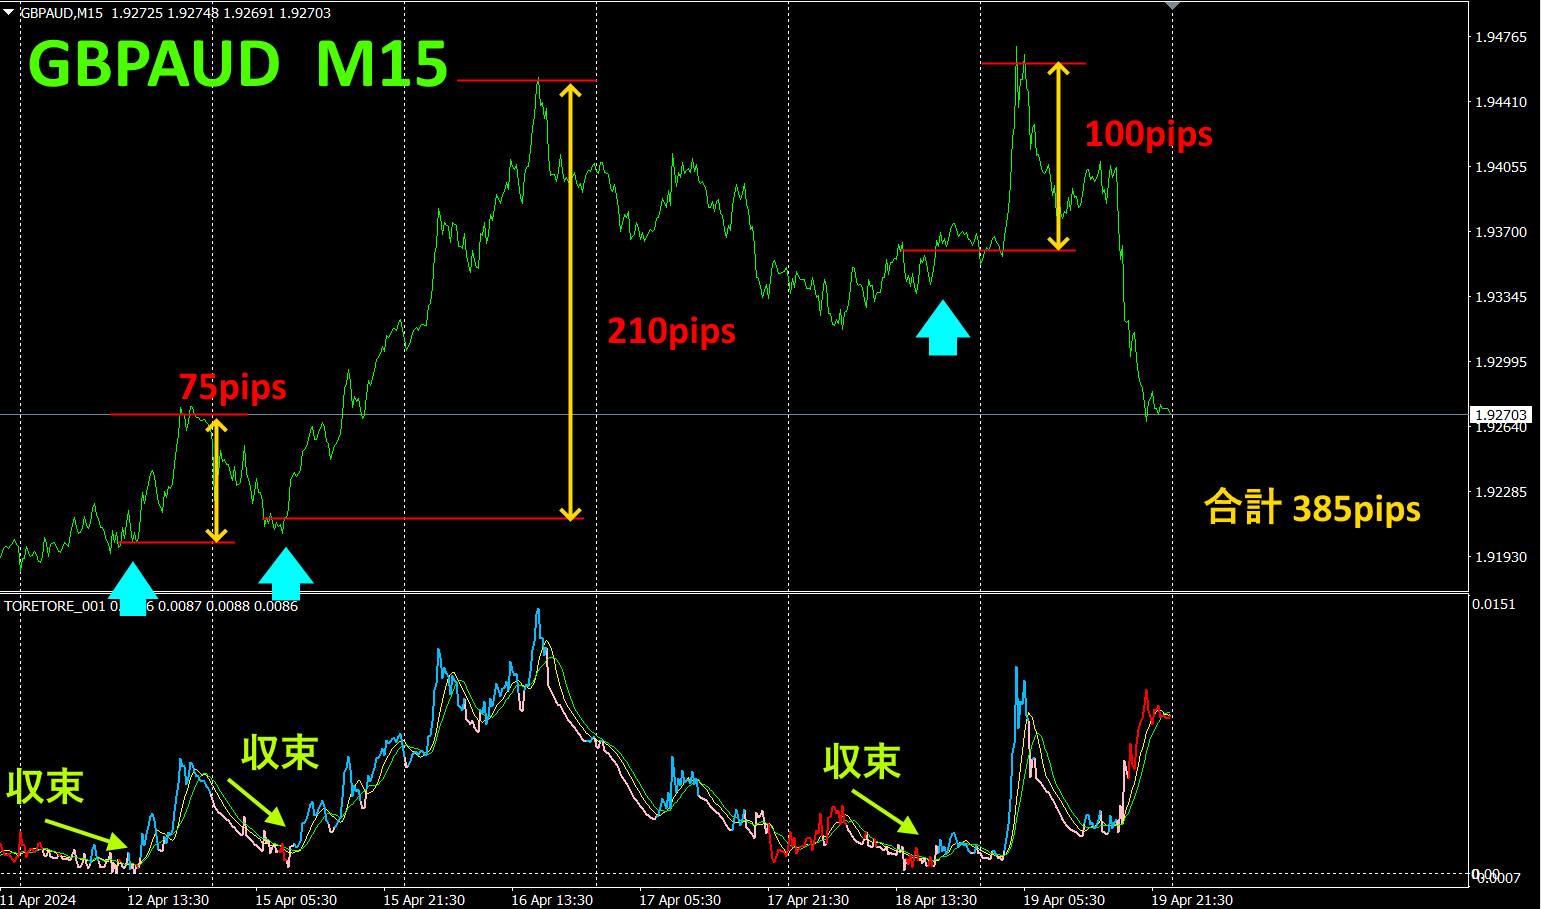
In this example, the main line of the “Toretore Indicator” converged three times. After that, the main line color changed to blue, so we entered a buy from here.
From the first buy,75pips, from the second buy210pips, from the third buy100pips, total385pips
The second buy point is on the5-minute chart
For explanation, vertical red lines ① and ② are drawn.
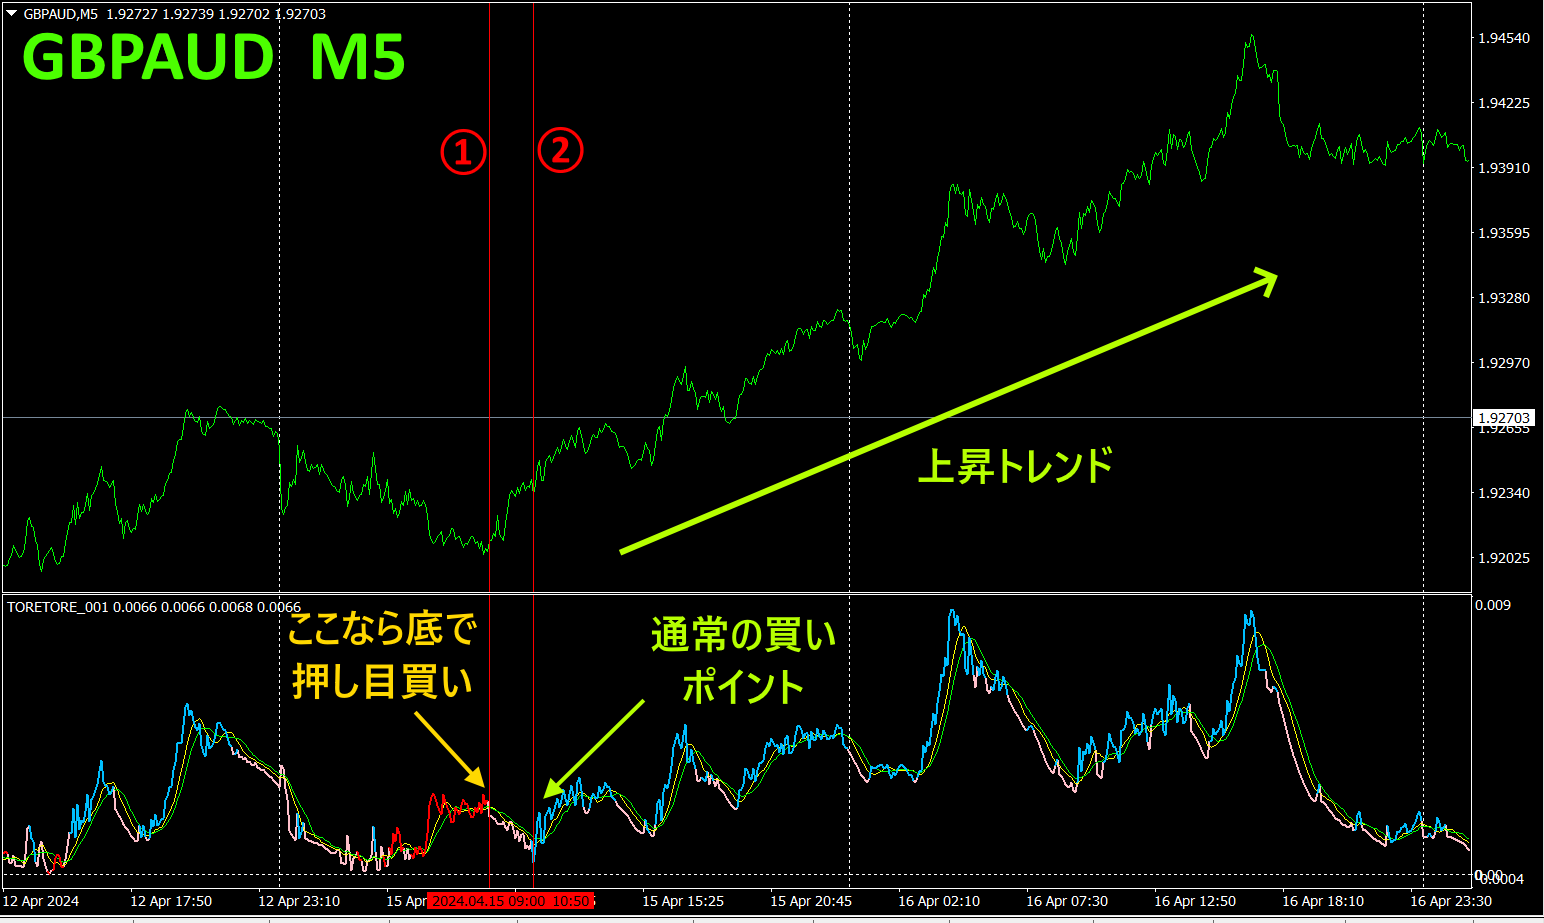
Typically, the buy point is after the main line converges and turns blue (the position of vertical line ②), but since the overall trend is upward, if you buy where the indicator color changes from red to pink (the position of vertical line ①), you can buy at a pullback in the upward trend at the “bottom” position.“Bottom” position for a pullback
We are still developing and exploring how best to use it, but I believe the “Toretore Indicator” holds great potential.
6.
A semi-automaticEATrend Line EX such as “” allows you to draw an oblique downward line; when it is broken above, it automatically buys, and when the rising line is broken, it automatically closes—i.e., a hands-off trading approach.
※“Trend Line EX”

https://www.gogojungle.co.jp/tools/indicators/42257
If you are interested in the “8C Currency Strength Visualization Indicator,” please refer to the following pages.

MT4 version https://www.gogojungle.co.jp/tools/indicators/39150
version https://www.gogojungle.co.jp/tools/indicators/39159


