
Daily Nikkei 225: 2024/4/17 Wednesday
One-word Comment
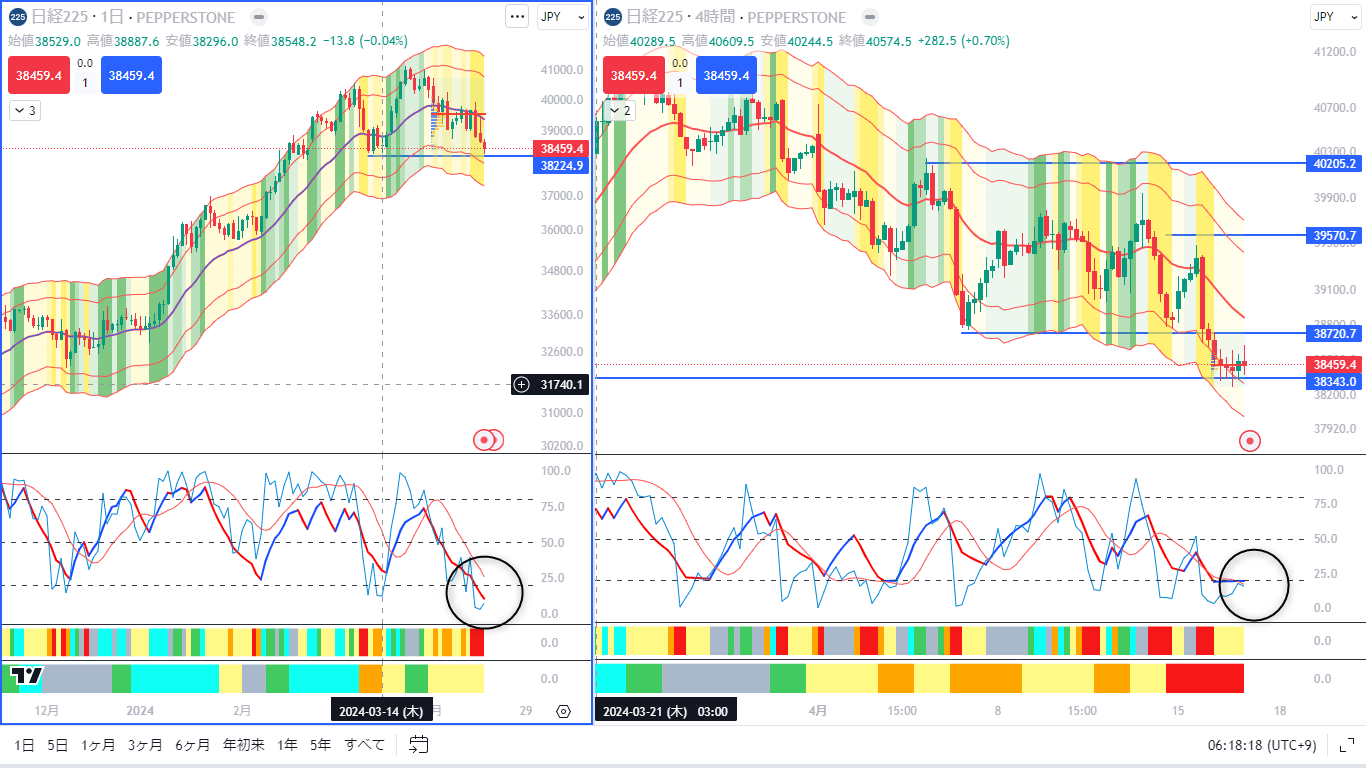
“Under downside advantage,”identify turning points
Daily chart:MAX Oscillator indicates“Strong decline”.
4-hour chart:“Watching and waiting”
Lower bound of the range: around 38225 — will it break below or rebound to the upside?
Staying barely in place. If the line breaks below, the uptrend is temporarily completely negated
※However, the daily MAX Oscillatorhas entered a reversal warning zone.
We should clearly determine. Based on the weekly state, it is unlikely to form an uptrend suddenly, but if it holds here, at least it may retrace somewhat and form a range again.
However, if the line is broken with momentum, the decline will continue.
※Personally, with sufficient capital management, it might be okay to buy in small lots, but proceed with caution.

Notes
This is an analysis comment based on original indicators and does not constitute trading advice or guarantee future movements.
Analysis tools details
■ MAX Oscillator – MT4/5 version
https://www.gogojungle.co.jp/tools/indicators/50340
■ The same – Treviso version
https://www.gogojungle.co.jp/tools/ebooks/50353
■ Ultimate Syncro Band
https://www.gogojungle.co.jp/tools/indicators/42606
■ A monthly bundle of 5 indicators including the above indicators
“天下無双” Syncro System
Treviso version & Ultimate Syncro System