

Utilization of the "Visualization Indicator" (Part 142)
Utilization of the "Visualization Indicator" (Part142)
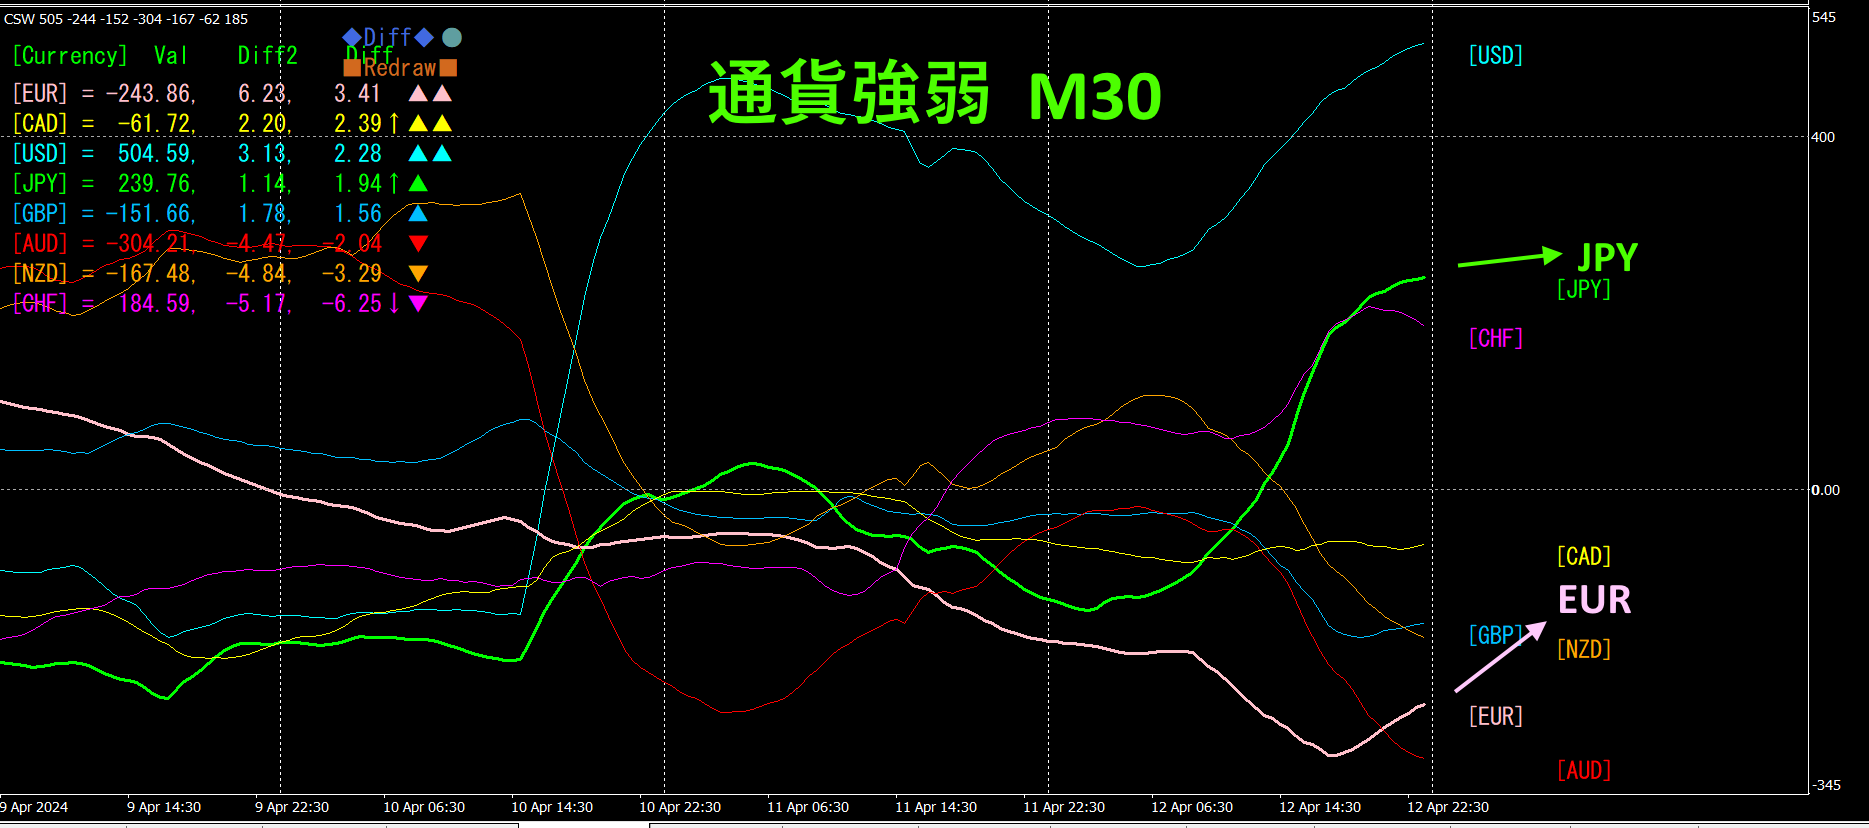
1. Further evolve the "28 Currency Pair List Indicator" into an indicator
“8CPVisualization Indicator” to drawAUDUSD.
The “8CPVisualization Indicator” includesOceania version,London version,NewYork version,AnyCP version. This time, I used theOceania version.
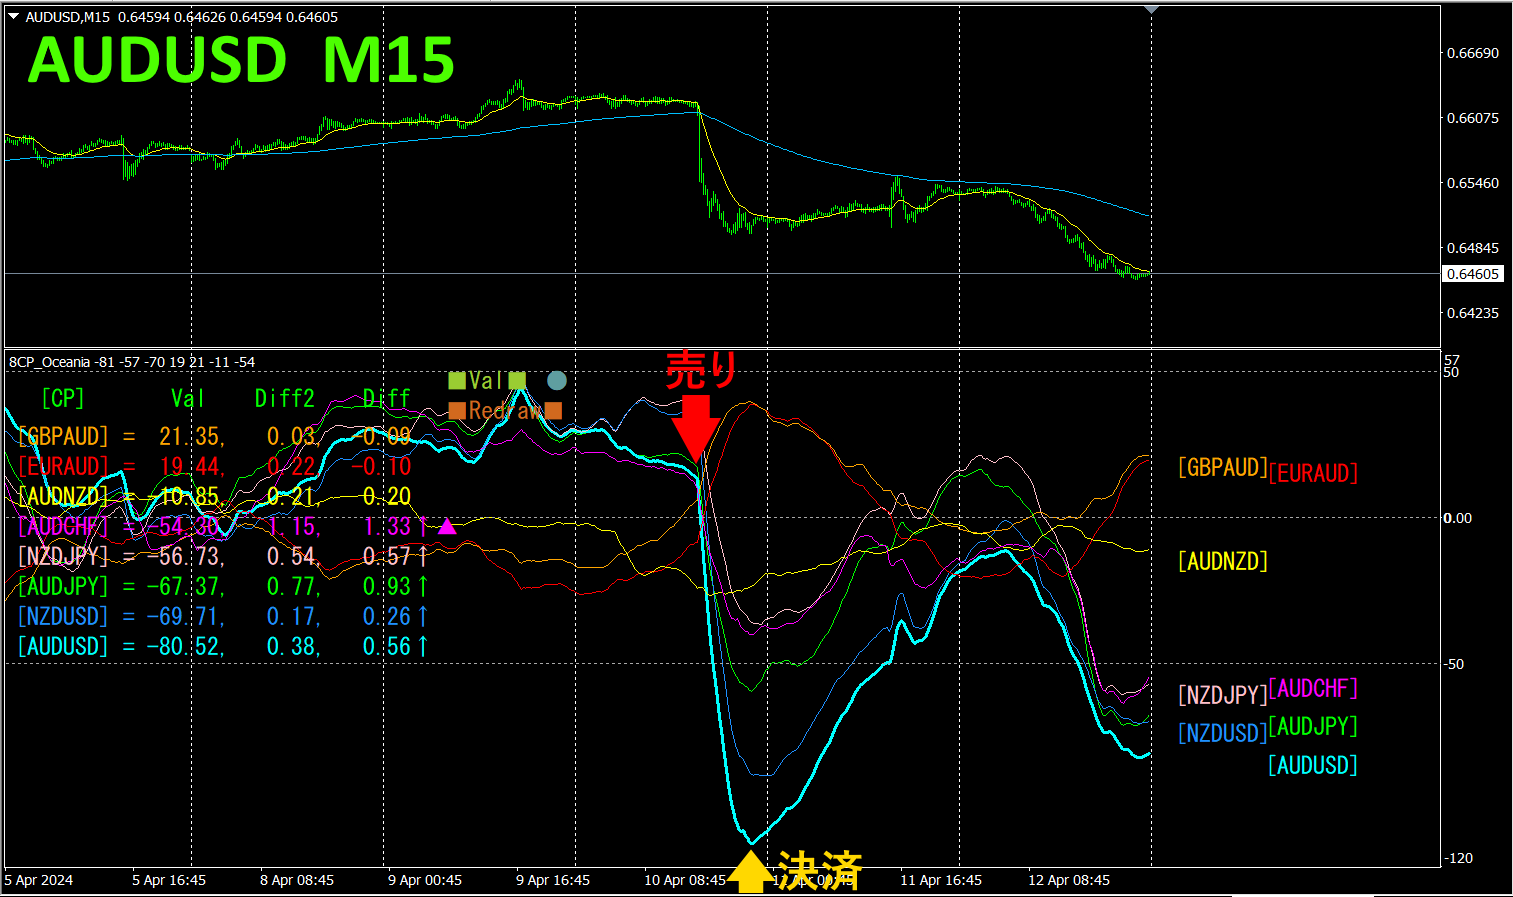
The top half is anAUDUSD 15-minute chart. The bottom half shows the results from the “8CP Visualization Indicator”; the cyan thick line graph corresponds toAUDUSD.
On Wednesday,AUDUSD fell below other graphs, so I entered a short trade. It settled the same day, yielding approximately110pips in profit.
With the “8CPVisualization Indicator”, simply focusing on the currency pair with the most movement allows for efficient trading.
2. Best Select Indicator to try
The following figure is a screenshot fromApril,2024 , (JST)
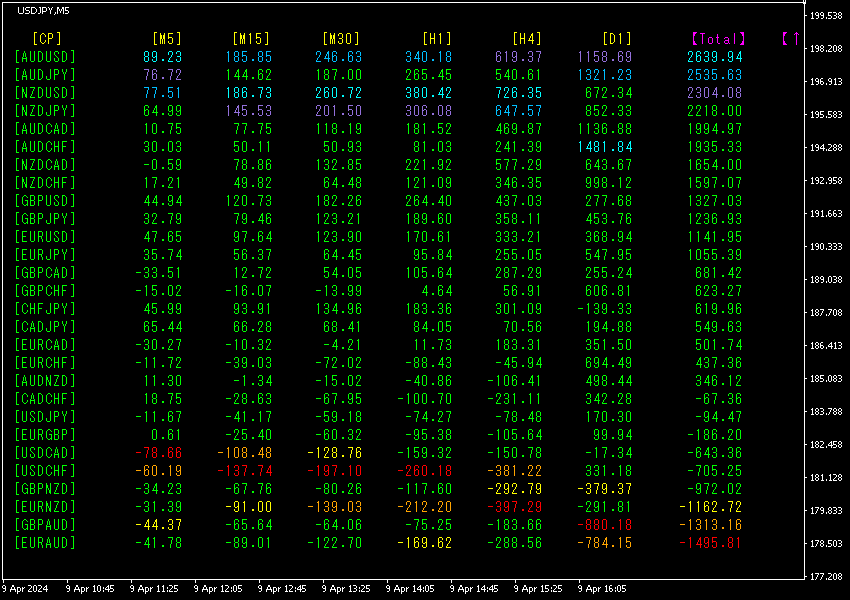
[Total]The figures are arranged in descending order.1st line'sAUDUSD shows blue tones across all timeframes.Total value is2639.94, indicating a large positive number.AUDUSD shows a significant downtrend.
Now, let’s look at theAUDUSD chart.
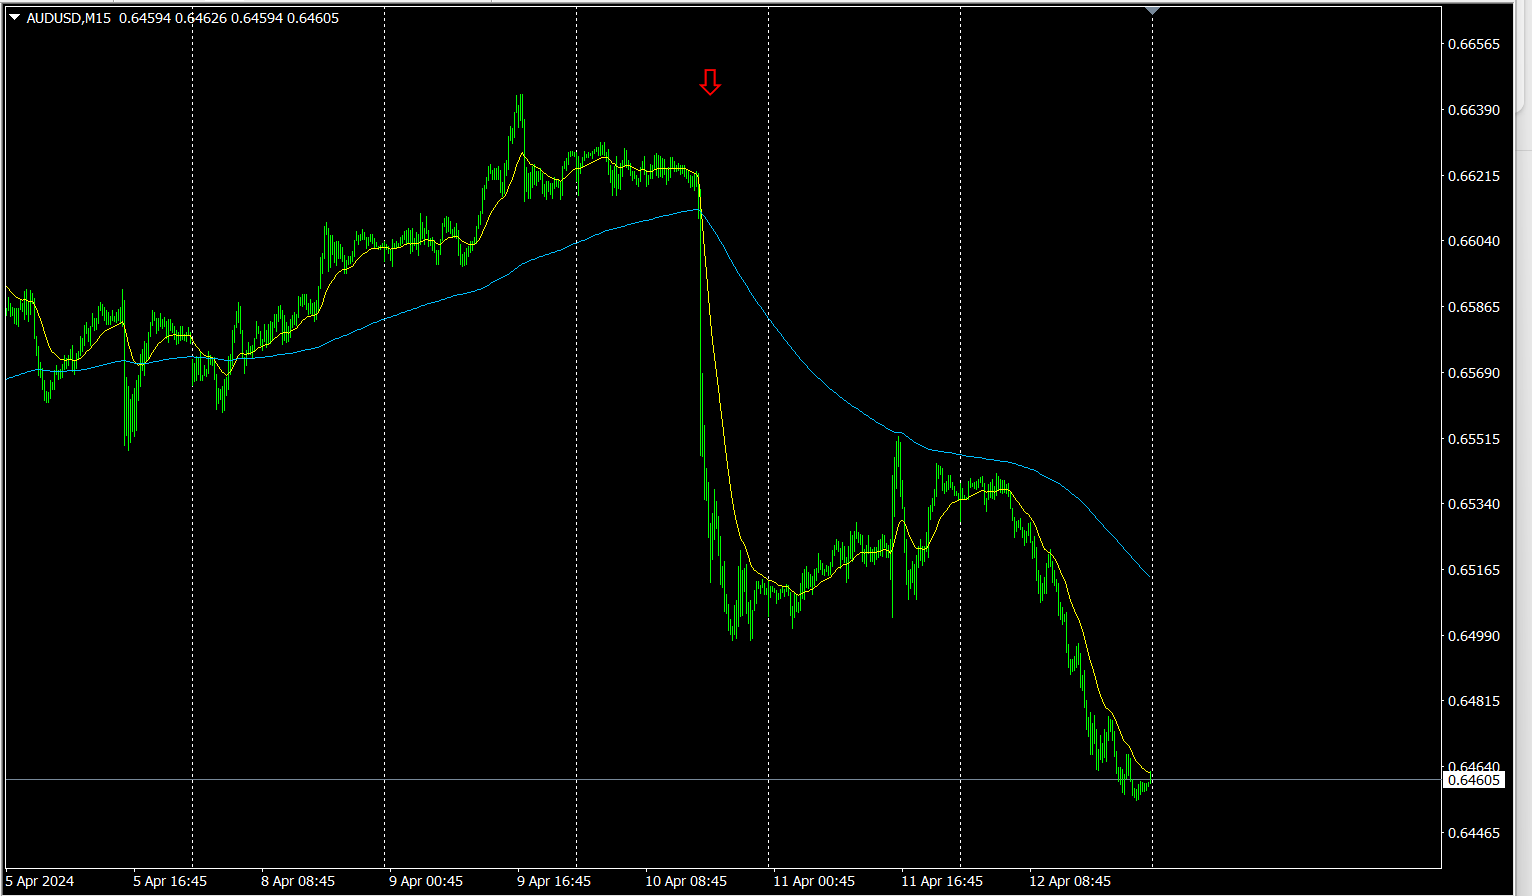
The red arrow marks the shot of the screenshot, capturing a sharp drop.
“28 Currency Pairs Best Select Indicatorshows currency pairs, with the strongest trend identified for easy recognition. It also indicates whether now is the right time to trade using numeric and color cues. It provides a quick overview of all currencies’ movements.
“28 Currency Pairs Best Select Indicator”
https://www.gogojungle.co.jp/tools/indicators/35128

3. 2021 year5 month
Since2021 EURJPY movements have been tracked.
To view overall trends, I’ve drawn around the most recent about3 weeks on a 30-minute chart.
Last time, I wrote the following.
JPY is downward, is upward, and currency strength also shows >, so is expected to rise further.
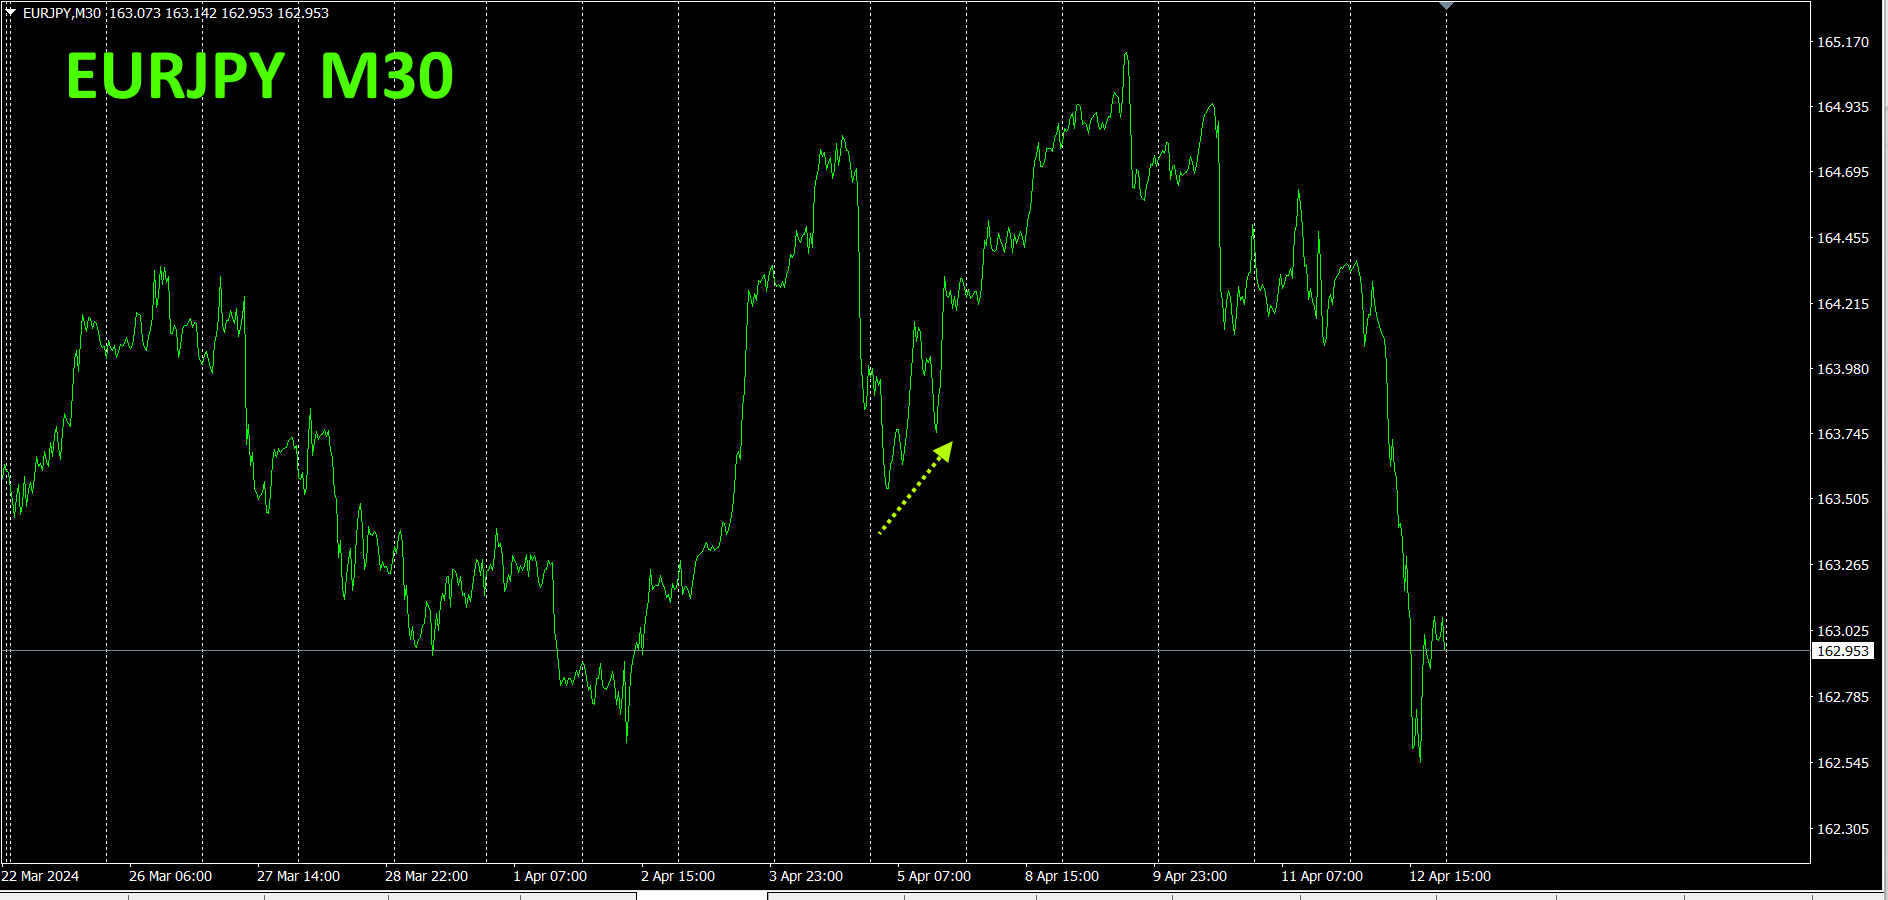
As forecast, it rose on Monday and Tuesday, then declined afterward.
30 minutes currency strength chart.
Pink isEUR, green is. In terms of currency strength, >, however, is on a weak upward trend, while shows a stronger upward movement than, so EURJPY is expected to rise further.
4. Two new indicators released.
“To-re to-re Indicator” and “To-re to-re28CP_Select
These are built on the concept of considering market movements as waves, trading only in directions that move from convergence to divergence (and not trading at other times).
Product pages are below.
“To-re to-re Indicator”
https://www.gogojungle.co.jp/tools/indicators/50115
“To-re to-re28CP_Select Indicator”
https://www.gogojungle.co.jp/tools/indicators/50203
5.
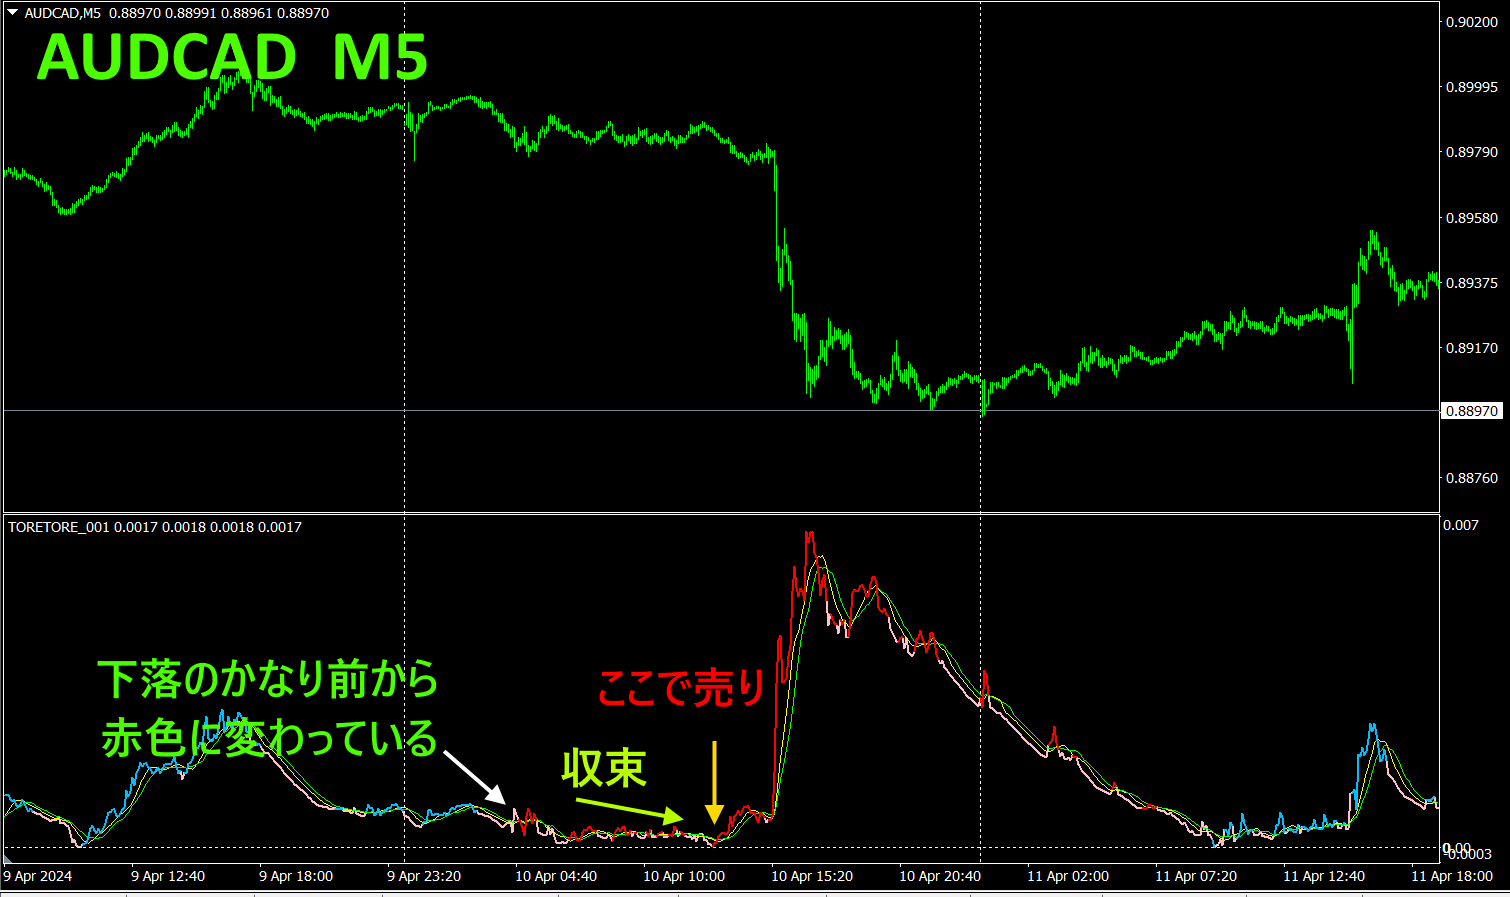
Trade example using the “To-re to-re Indicator” (AUDCAD))
AUDCAD’s minute chart with the “To-re to-re Indicator.” The main line of the indicator waits for sufficient convergence before trading. If the main line’s color is red, it’s a sell; if blue, it’s a buy.
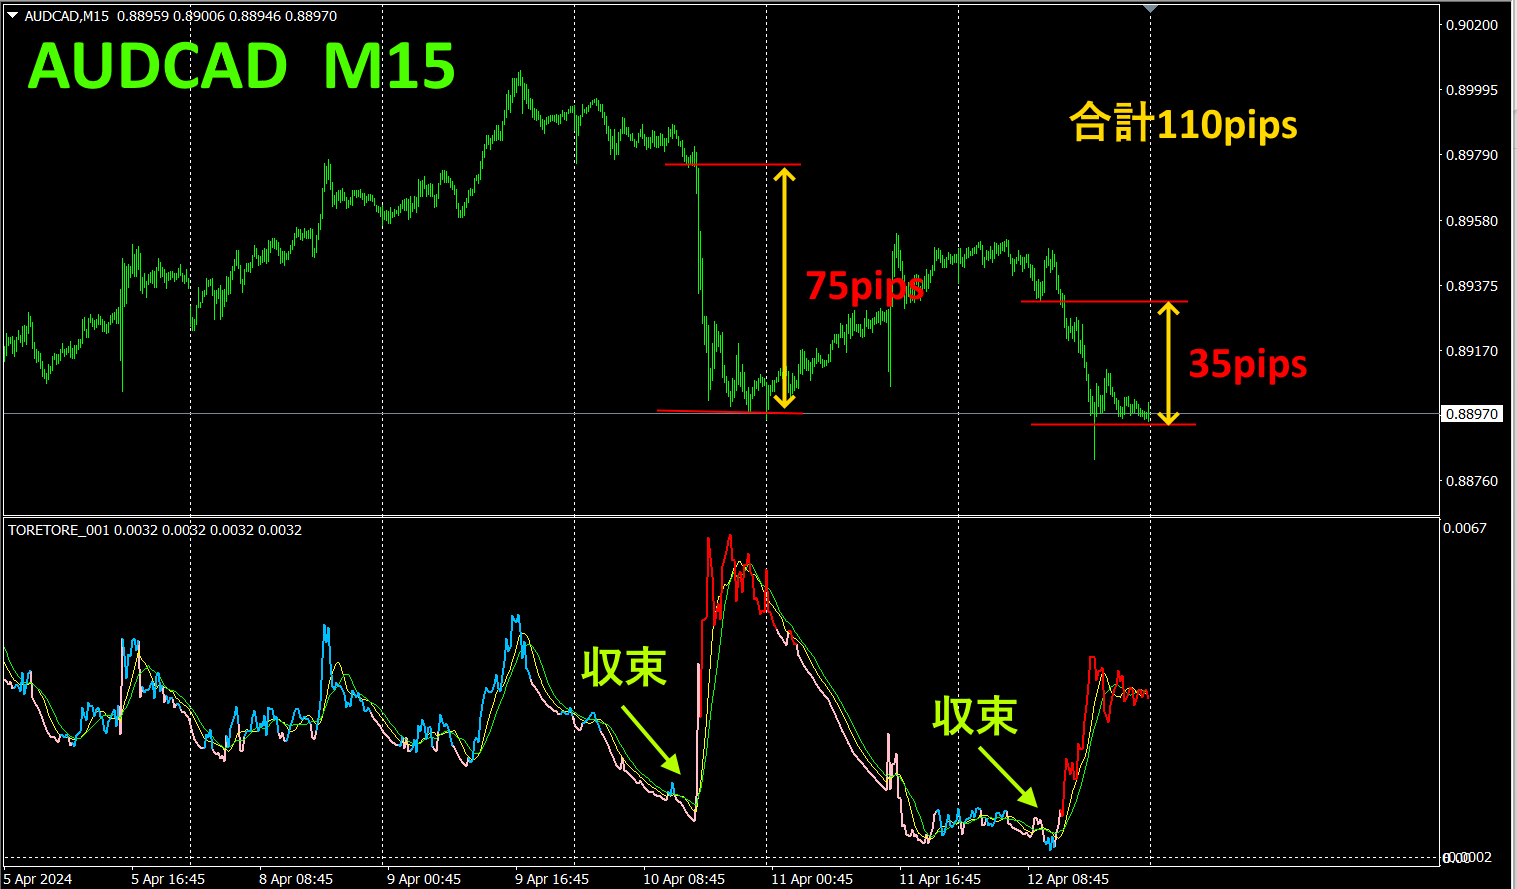
In this example, the uptrend ended and a down move from a trend reversal was targeted. Wait for the main line of the “To-re to-re Indicator” to converge sufficiently, then enter a sell when the color turns red. When convergence occurs again and the color turns red, perform a second (pullback) sell to accumulate more profit. The first sell yielded75pips, the second sell35pips, totaling110pips in profit.
The first sell point is on the5-minute chart.
The indicator colors appear well before the downward move. Waiting for full convergence and then entering a sell position yields obvious profits. Moreover, you can achieve high risk-reward trades with small losses and large profits, and profits appear as soon as you enter a position, making for a pleasant “wow” trade.
Key usage point: wait for full convergence. Then trade according to color. Keep selling while the color remains red.
Exits occur when the main line turns downward and the color is no longer red.
I find the indicator visually intuitive.
6.
Recommended indicators
Semi-automaticEA “” enables, with an inclined down-sloping line drawn, automatic buy when price breaks above it and automatic exit when it breaks above the rising line, enabling hands-off trading.Trend Line EX
※“Trend Line EX”

https://www.gogojungle.co.jp/tools/indicators/42257
If you are interested in the “8C Currency Strength Visualization Indicator,” please refer to the following pages.

MT4 version https://www.gogojungle.co.jp/tools/indicators/39150
MT5 version https://www.gogojungle.co.jp/tools/indicators/39159
【My products for sale】


