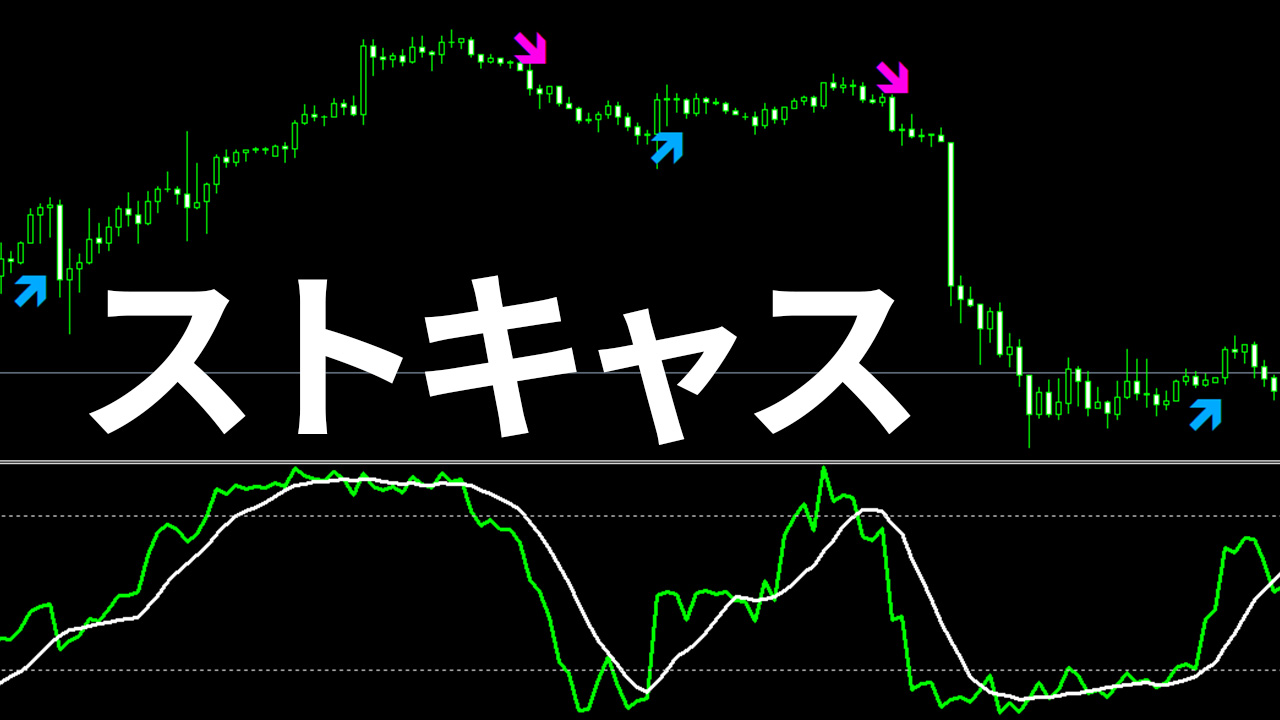

Stochastics can be used for trend-following as well!
In the previous article, I explained the definition of Stochastics and the common misconceptions about buy/sell signals.
“Stochastics cannot be used”: is that true?
In the last article, I explained the three lines of the Stochastics.
About the three lines of Stochastics
Now, I will discuss trading strategies using Stochastics.
%K is 26 days
%D uses a 9-day average.
26 days and 9 days are values used in Ichimoku, MACD, and other indicators.
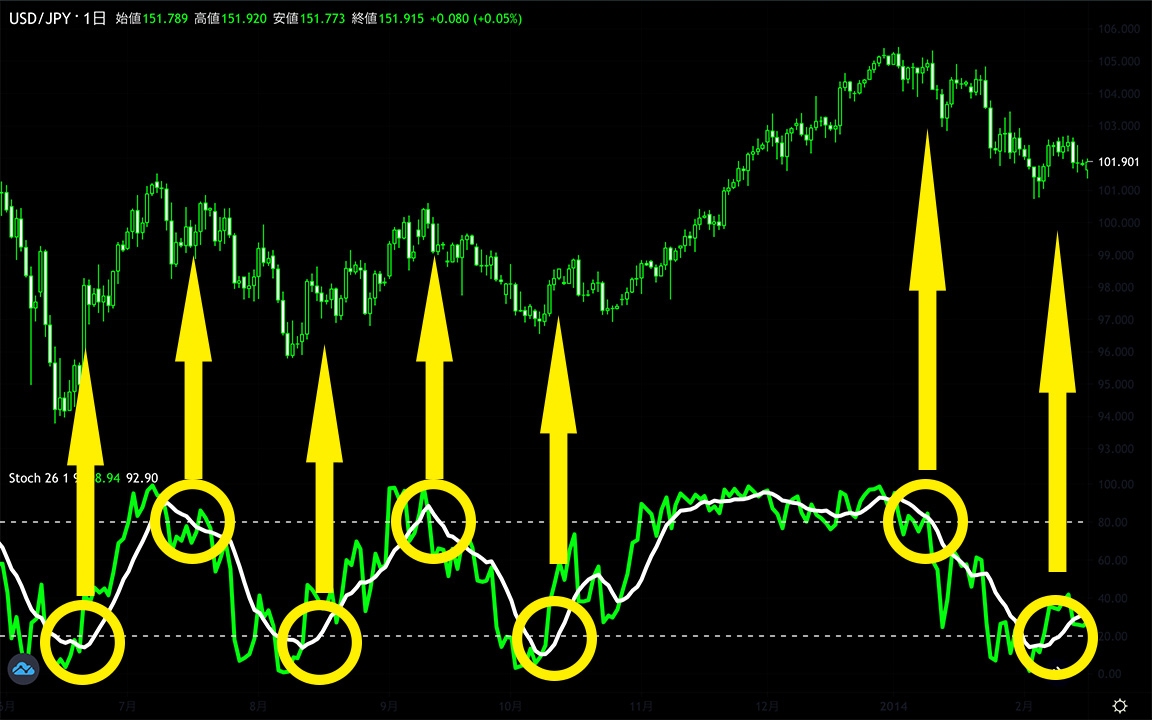
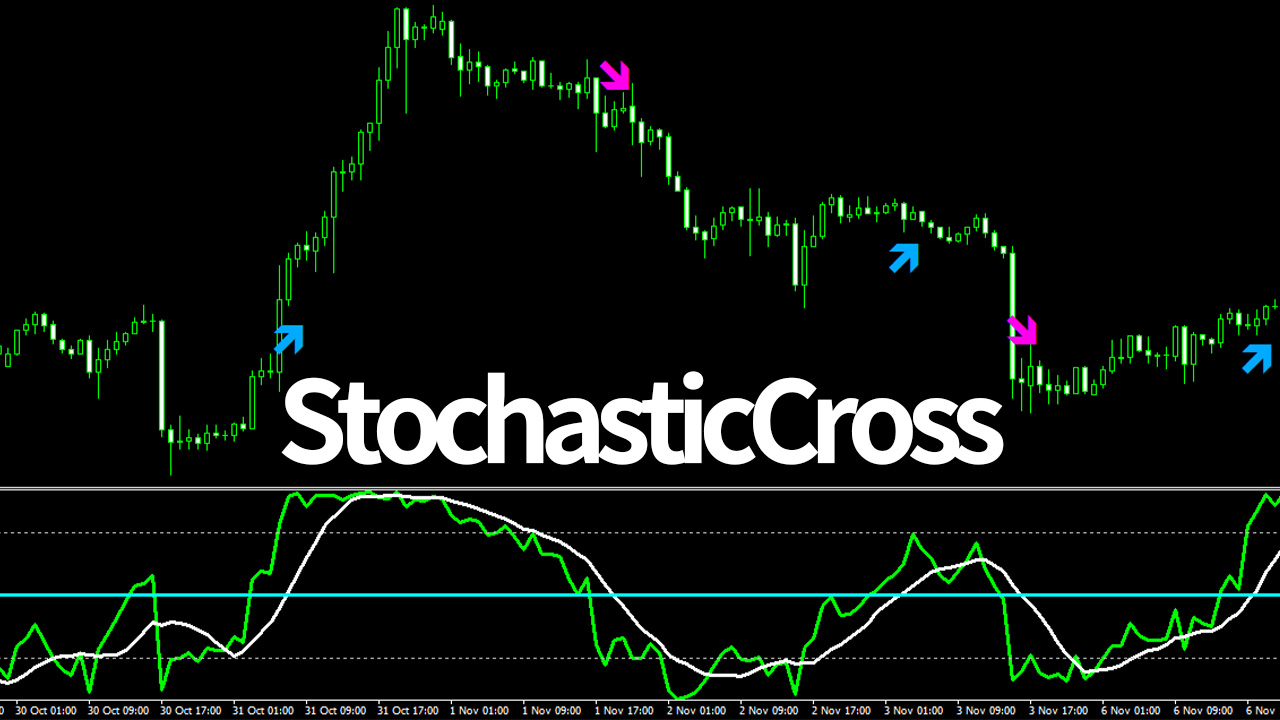
【When using for counter-trend trading】
%K crossing above 20% and %D crossing above 20% → buy.
%K crossing below 80% and %D crossing below 80% → sell.
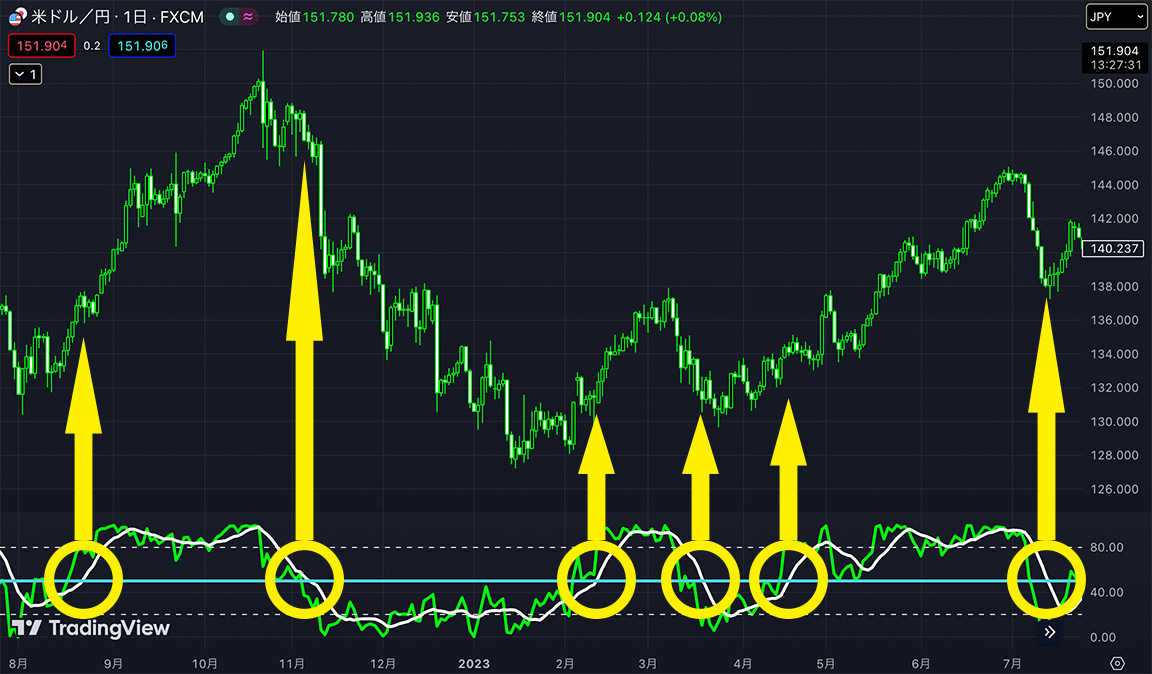
【When using for trend-following trading】
%K crossing above 50% and %D crossing above 50% → buy.
%K crossing below 50% and %D crossing below 50% → sell.
Doing so, it should be quite useful, don’t you think?
However, any technical indicator can have false signals.
To avoid them, understand the indicator’s definition and calculation, adjust parameters, and master its proper use.

Three steps to study technical analysis
① Understand the meaning of the definitions and formulas
② Explore the information that can be read from the indicators
③ Consider the correct buy/sell timing
If we consider the Stochastics in this example,
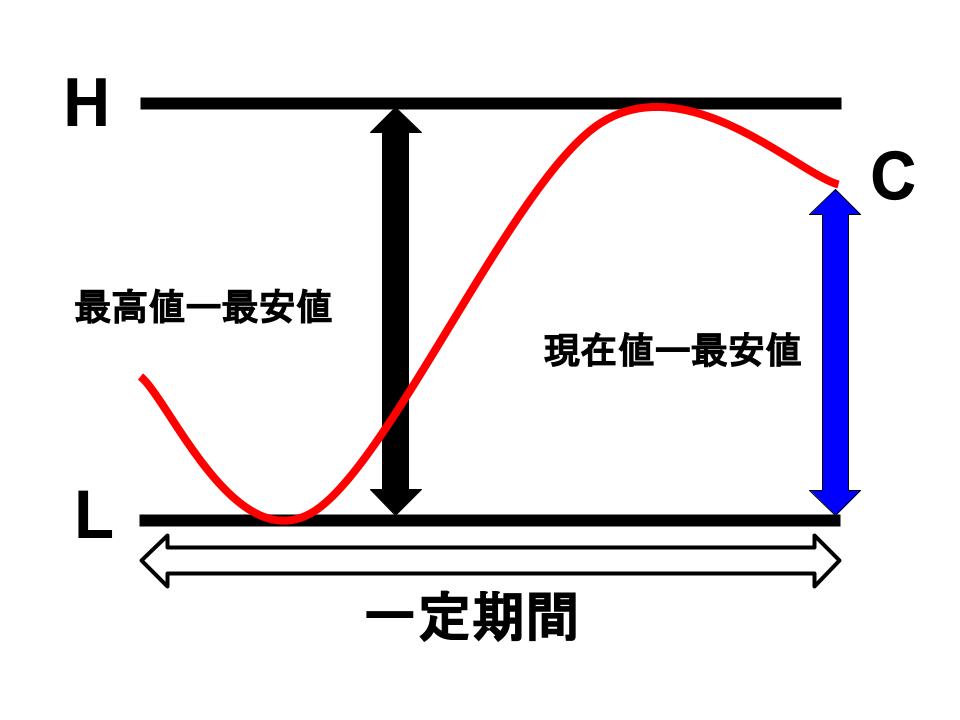
① The definition of Stochastics is
%K = (Current Value − Lowest Value) ÷ (Highest Value − Lowest Value)
%D = 3-day average of %K
Slow %D = 3-day average of %D
② When the range of the high and low over a fixed period is treated as 1, it shows what percentage position the price is at relative to the lowest point.
③ When price is rising steadily, %K tends to stay above 80%. When price is falling steadily, it tends to stay below 20%.
From this, when %K stays at or above 80%, it indicates an uptrend, so it is not a selling signal due to being overbought. The same applies for 20% or below.
If the period length is too short, %K can easily hit 0 or 100, making it hard to use. A moderate length is necessary.
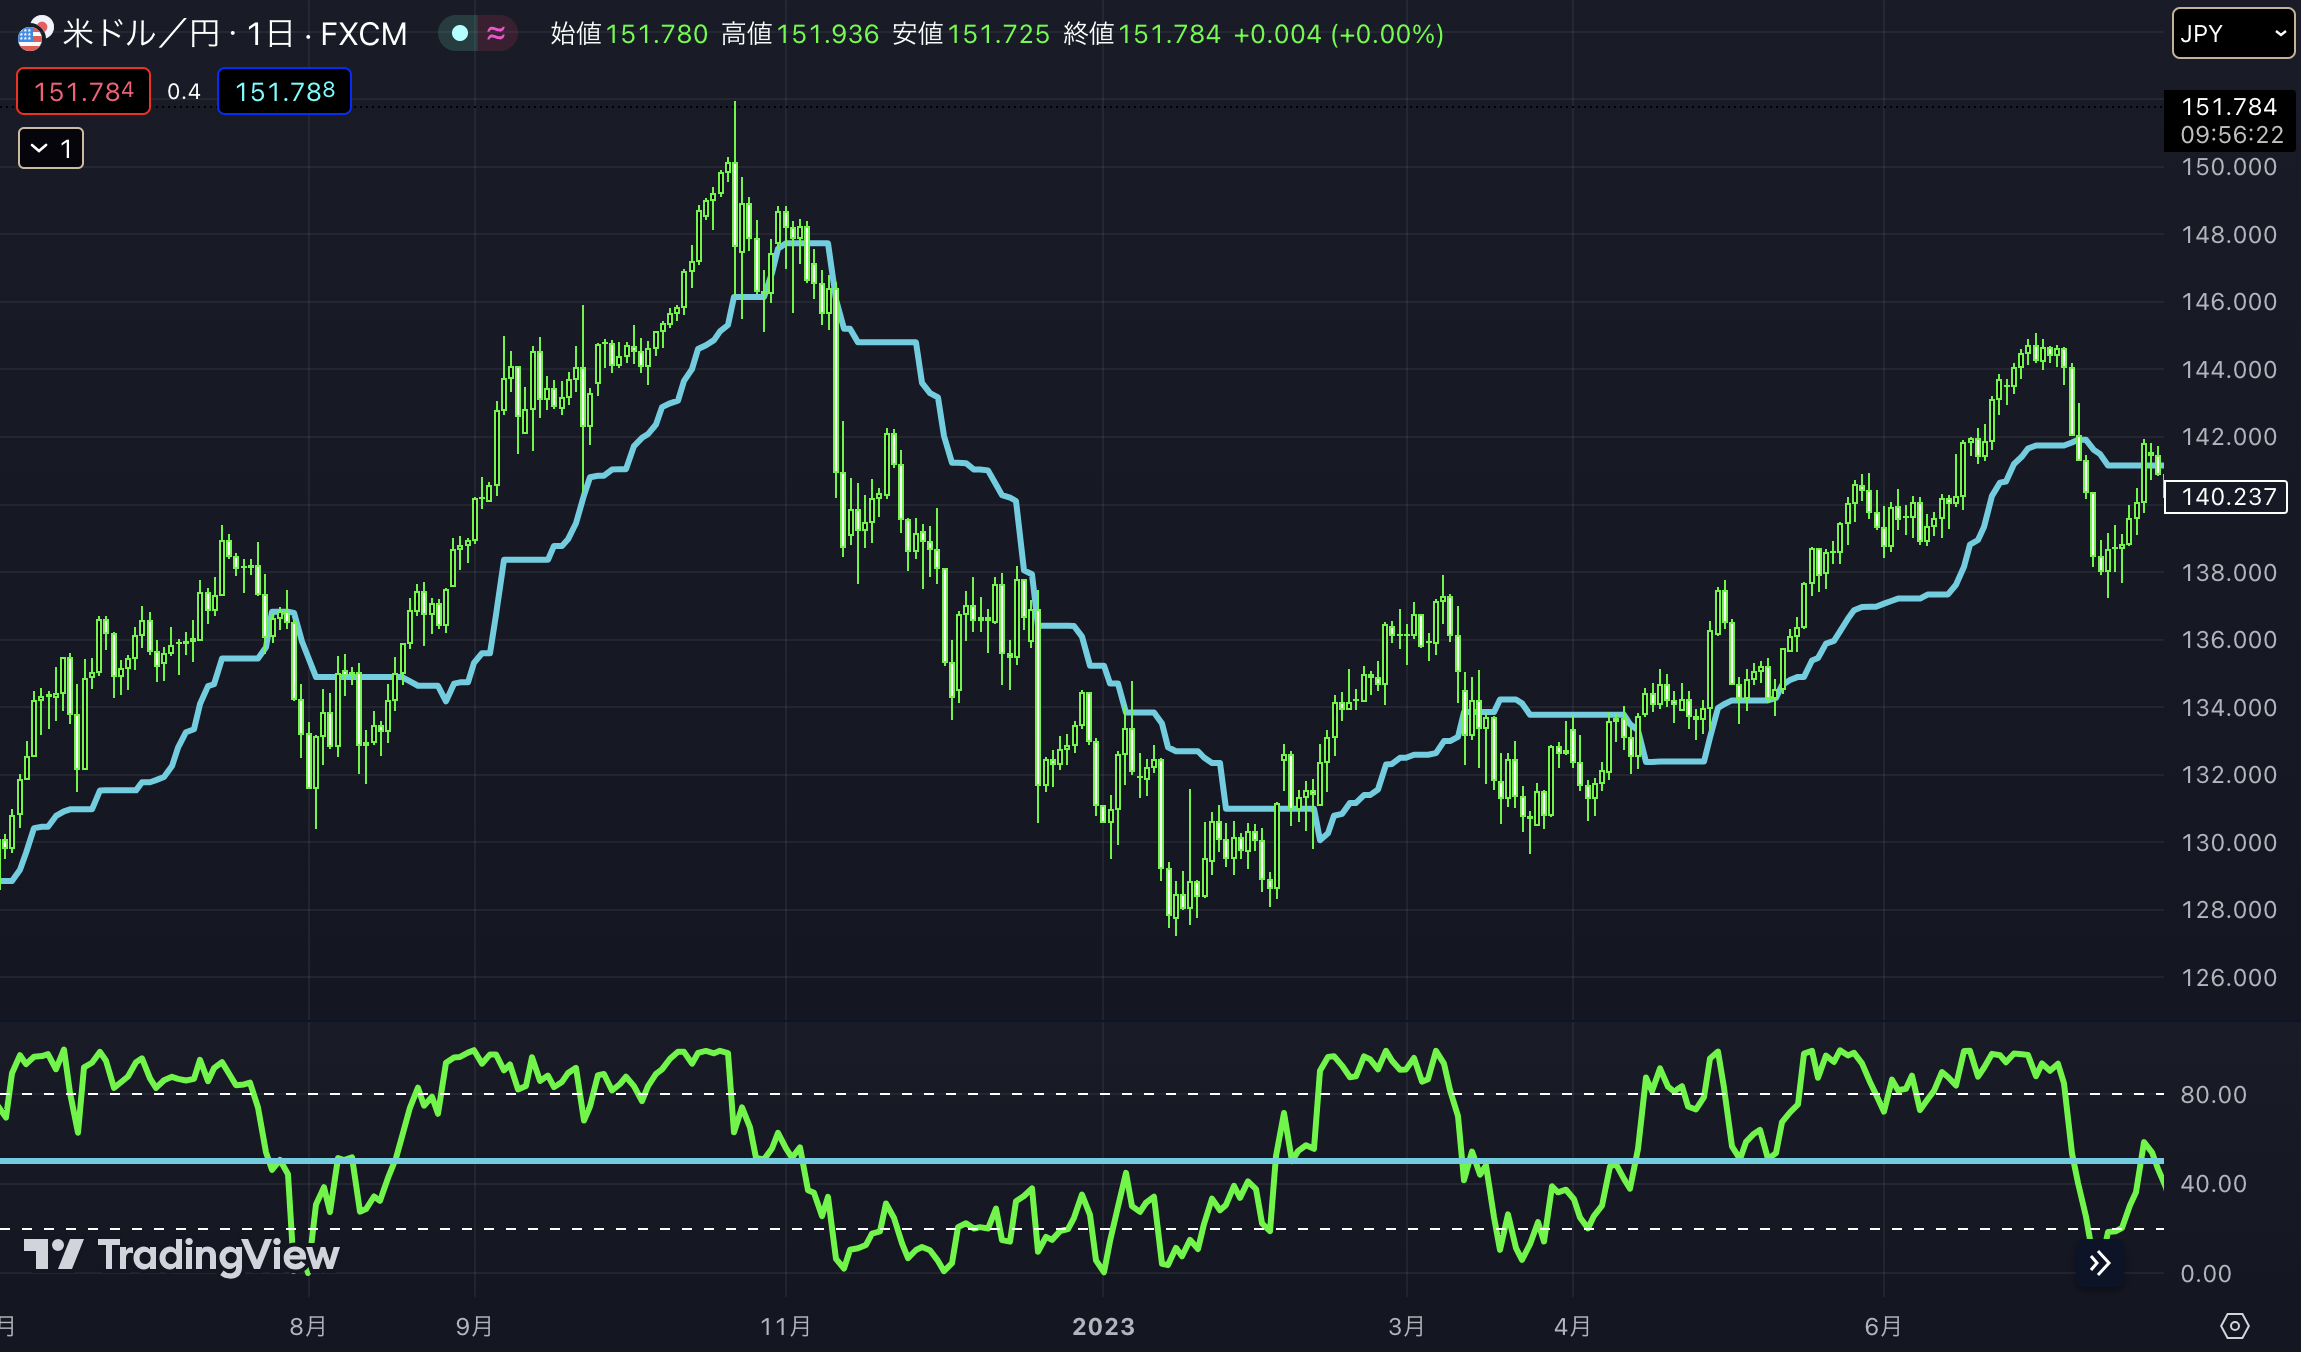
Finally, I encourage you to display only the Ichimoku base line on the chart and observe the changes in %K.
%K set to 26 days means that when %K is at 50%, the price is exactly at the base line position.
Oscillator-type indicators are best used together with compatible trend indicators.
For example, together with two EMAs and MACD. Using concepts that share the same underlying idea is beneficial.
Sigan tools available for MT4 for sale!
Trend-following signal tool 6-item set “Moving average cross signals displayed as arrows”