

Utilization of the "Visualization Indicator" (Part 141)
“Visualization Indicator” usage (part141)”
1. Further evolve the “28 Currency Pairs List Indicator” into an indicator
“8 CP Visualization Indicator” for GBPAUD GBPAUD to drawdraw
The “8 CP Visualization Indicator” includes Oceania edition, London edition, NewYork edition, AnyCP edition. This time, the Oceania edition was used.
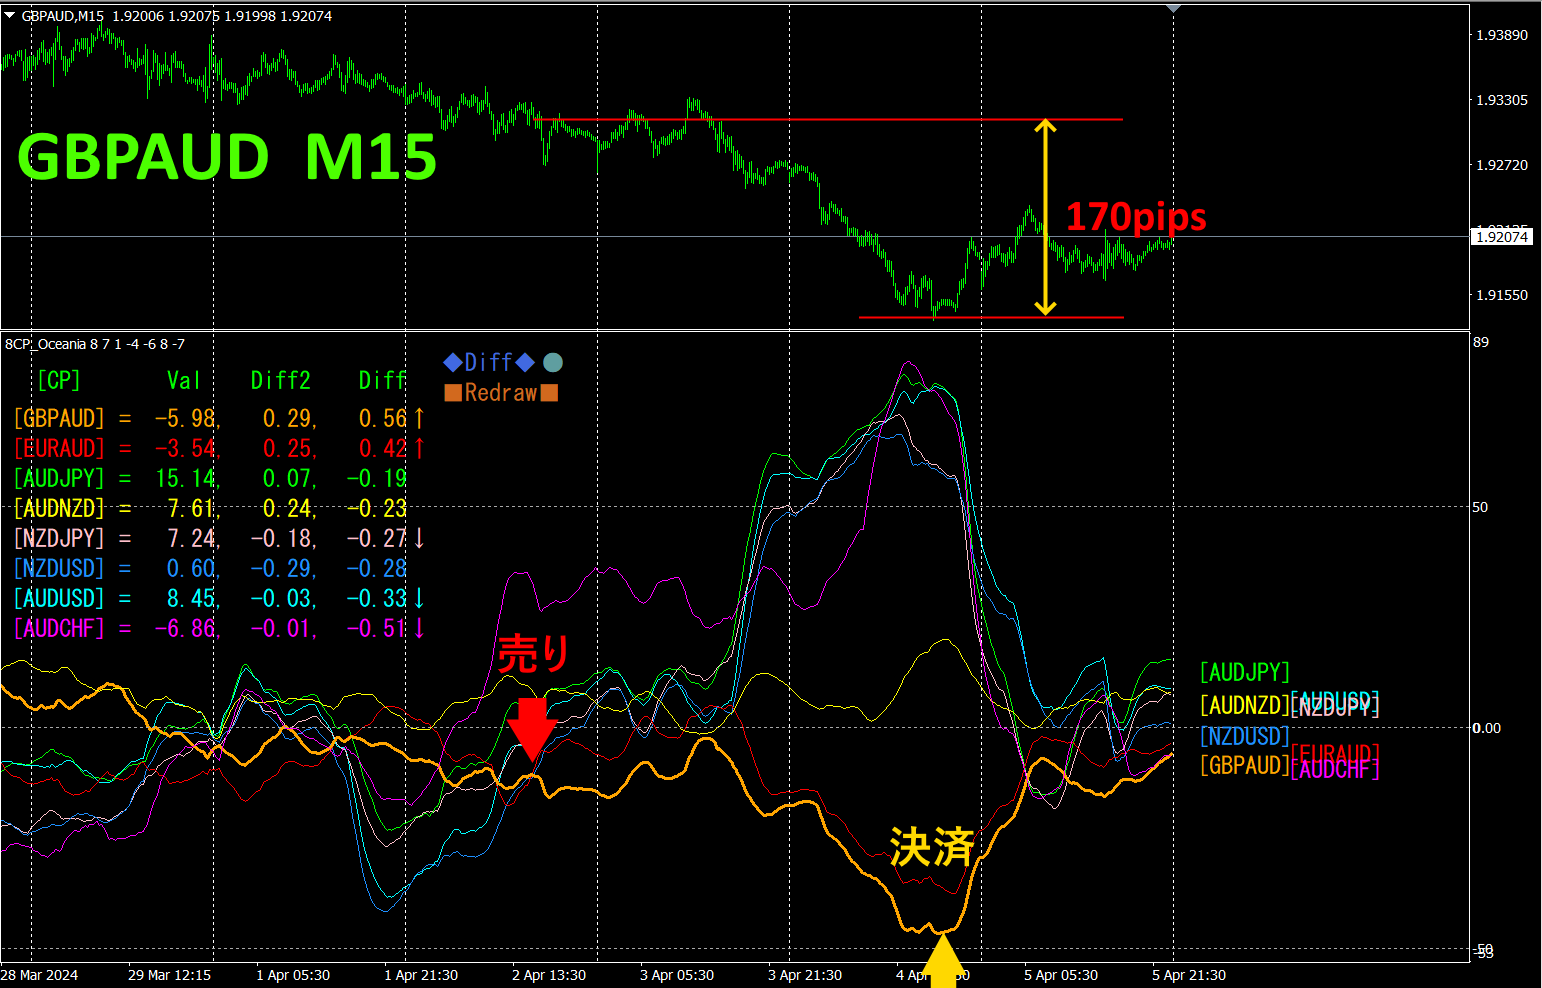
The top half is GBPAUD’s 15-minute chart. The bottom half is from the “8 CP Visualization Indicator,” with the orange thick line graph corresponding to.
On Tuesday, GBPAUD fell below the other charts, so I entered a sell. I closed on Thursday, achieving about170 pips profit.
With the “8 CP Visualization Indicator,” by simply watching the most volatile currency pair, you can trade efficiently.
2. Best Select Indicator trial
The following chart is a screencap from April 2024 year 4 19:39 )
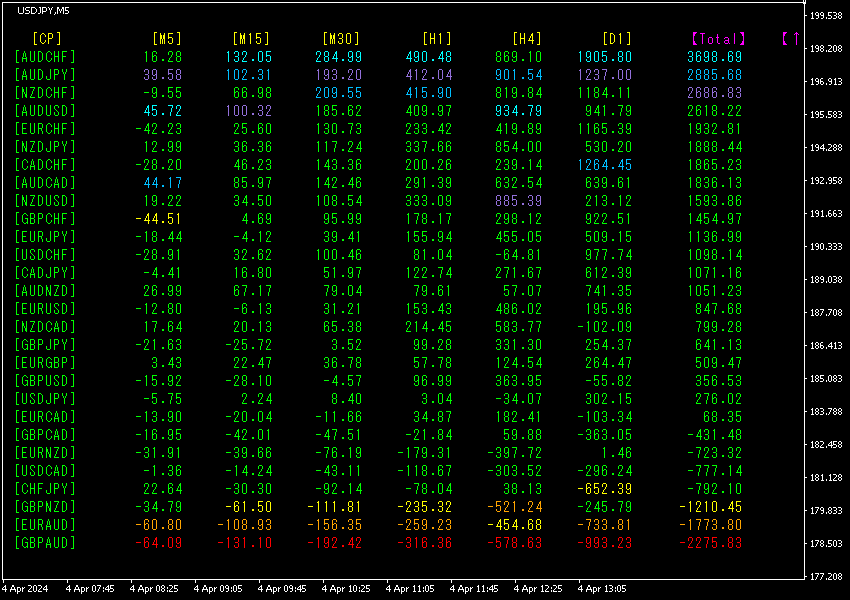
[Total] Values are arranged in descending order. The last line in position 1 GBPAUD shows red across all time frames, and the Total value is -2275.83, a large negative number, indicating a significant downtrend for GBPAUD. GBPAUD shows a clear downtrend.
Now, let’s look at GBPAUD’s chart.
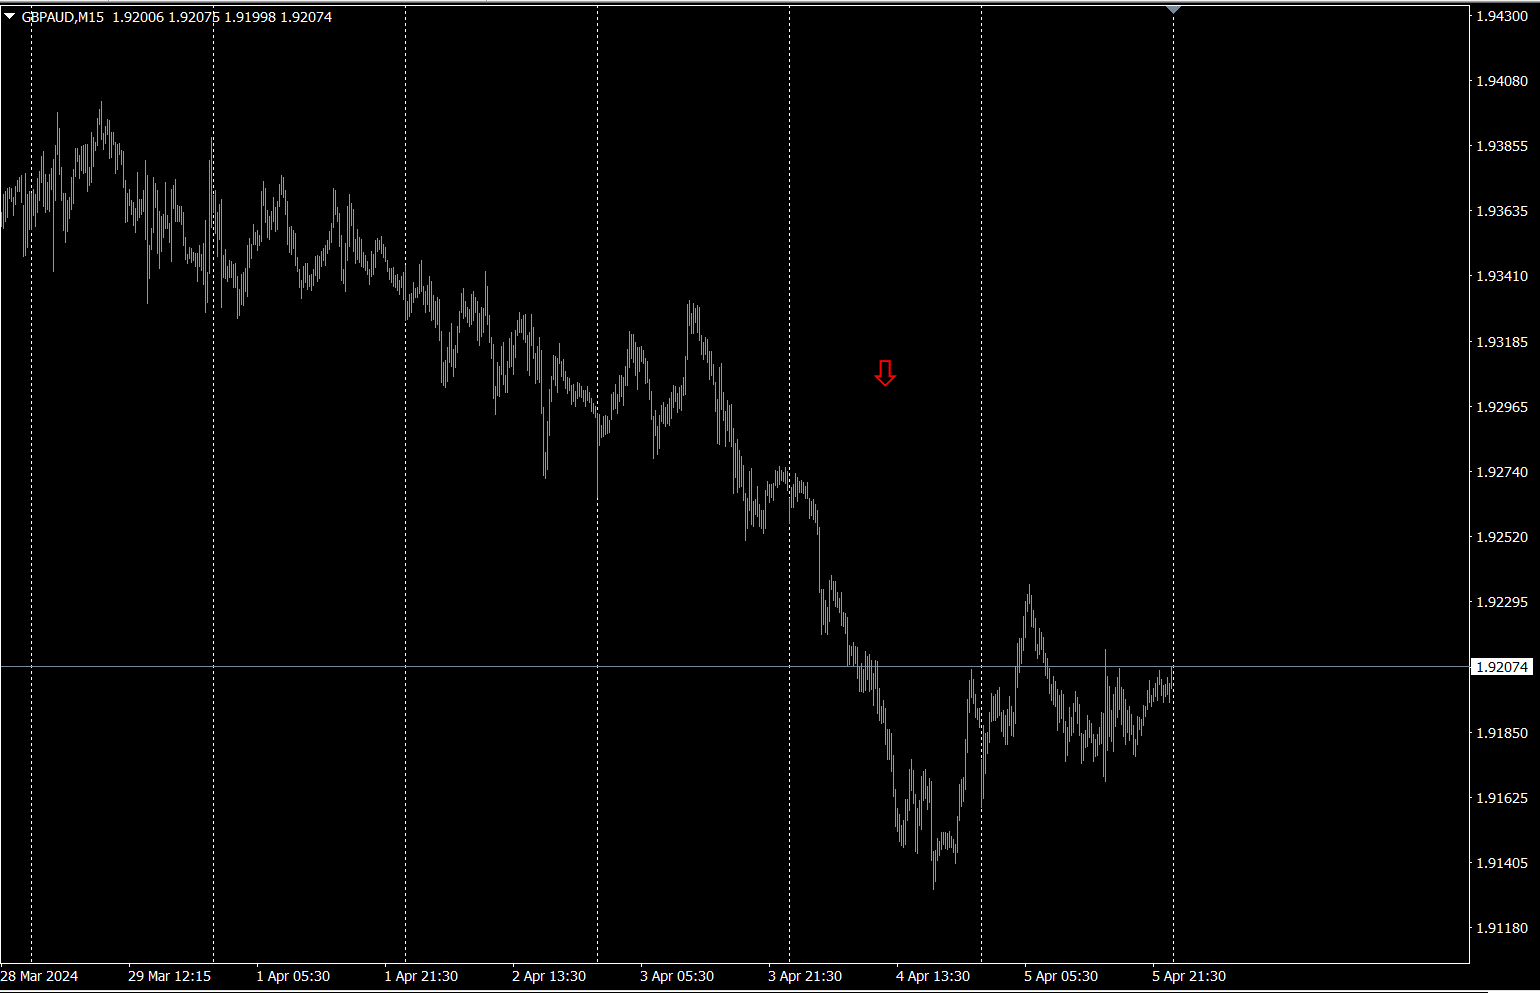
The red arrows mark the point where the screenshot was taken, catching a sharp drop.
“28 Currency Pairs Best Select
“28 Currency Pairs Best Select Indicator”
https://www.gogojungle.co.jp/tools/indicators/35128

3. 2021 Year 5 5 Month?
2021 Year Month movements tracked.
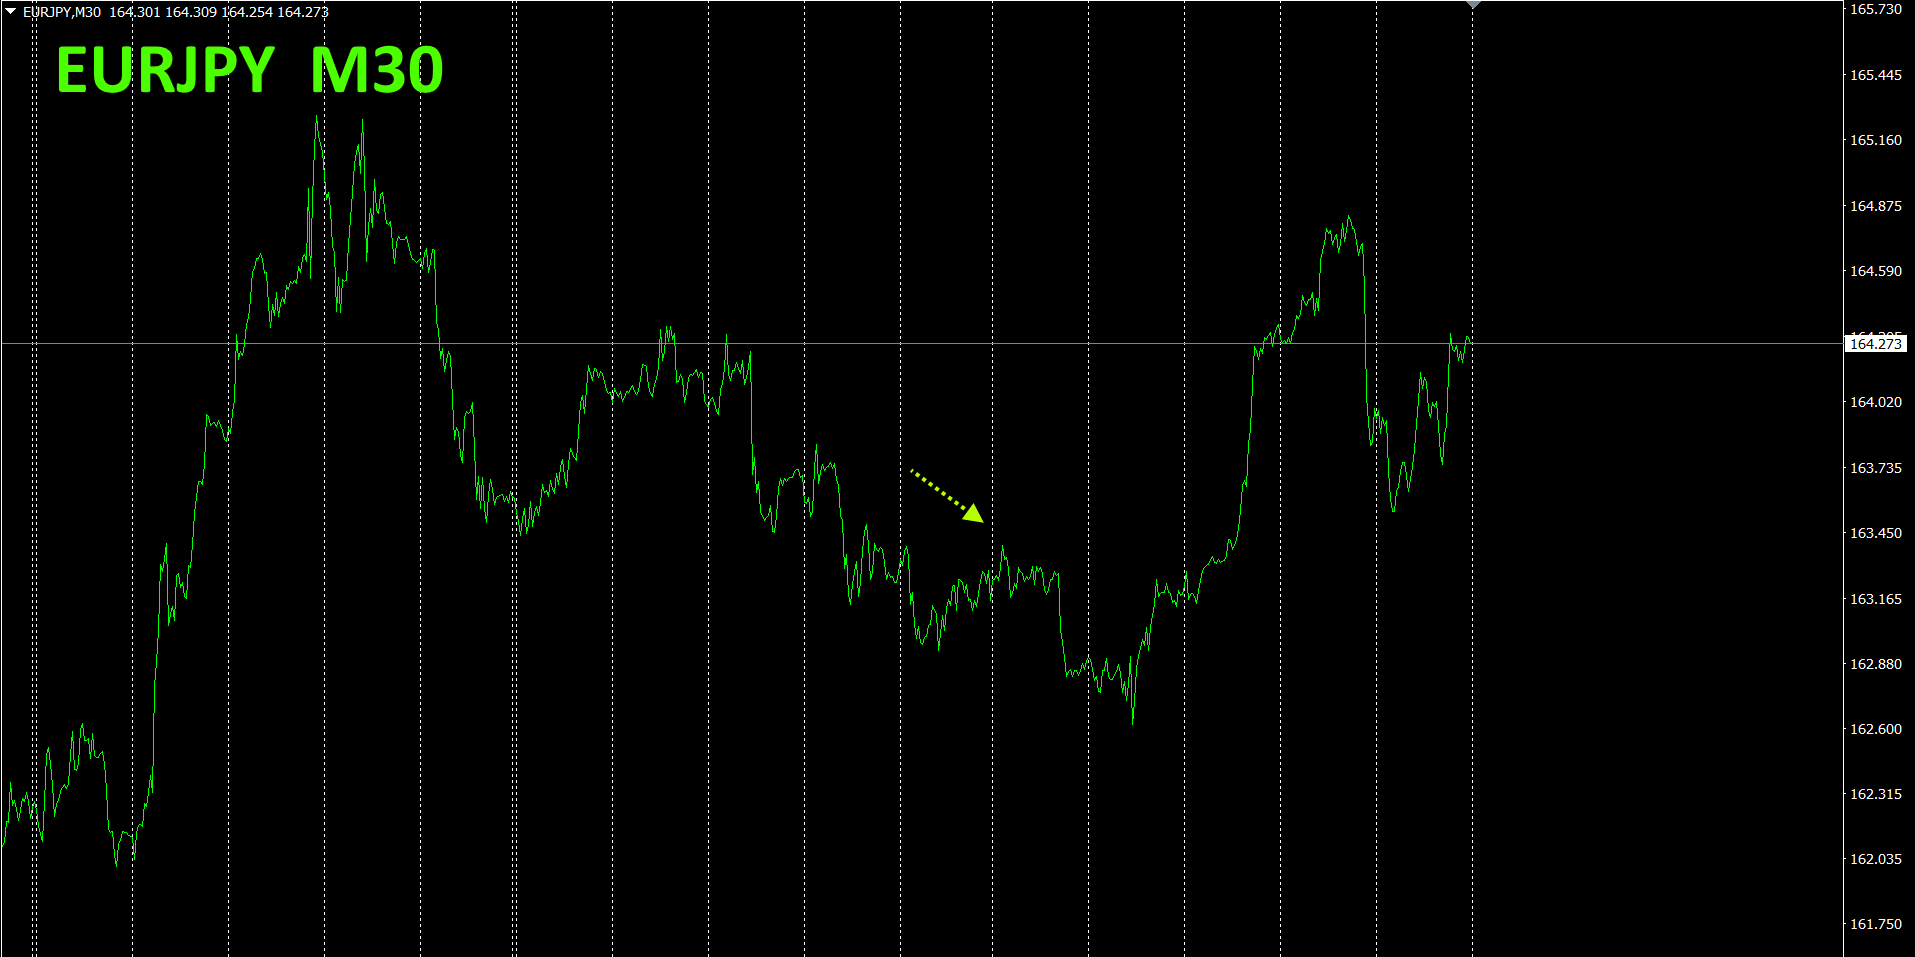
To view the overall trend, a30-minute chart showing roughly the last3 weeks is drawn.
Previously, I wrote the following.
Both JPY and EUR appear to move largely horizontally. In terms of currency strength,, EUR is slightly weaker than JPY, so EURJPY tends to decline slightly.
Monday and Tuesday saw some decline. Since then, it has risen.
30-minute currency strength chart.
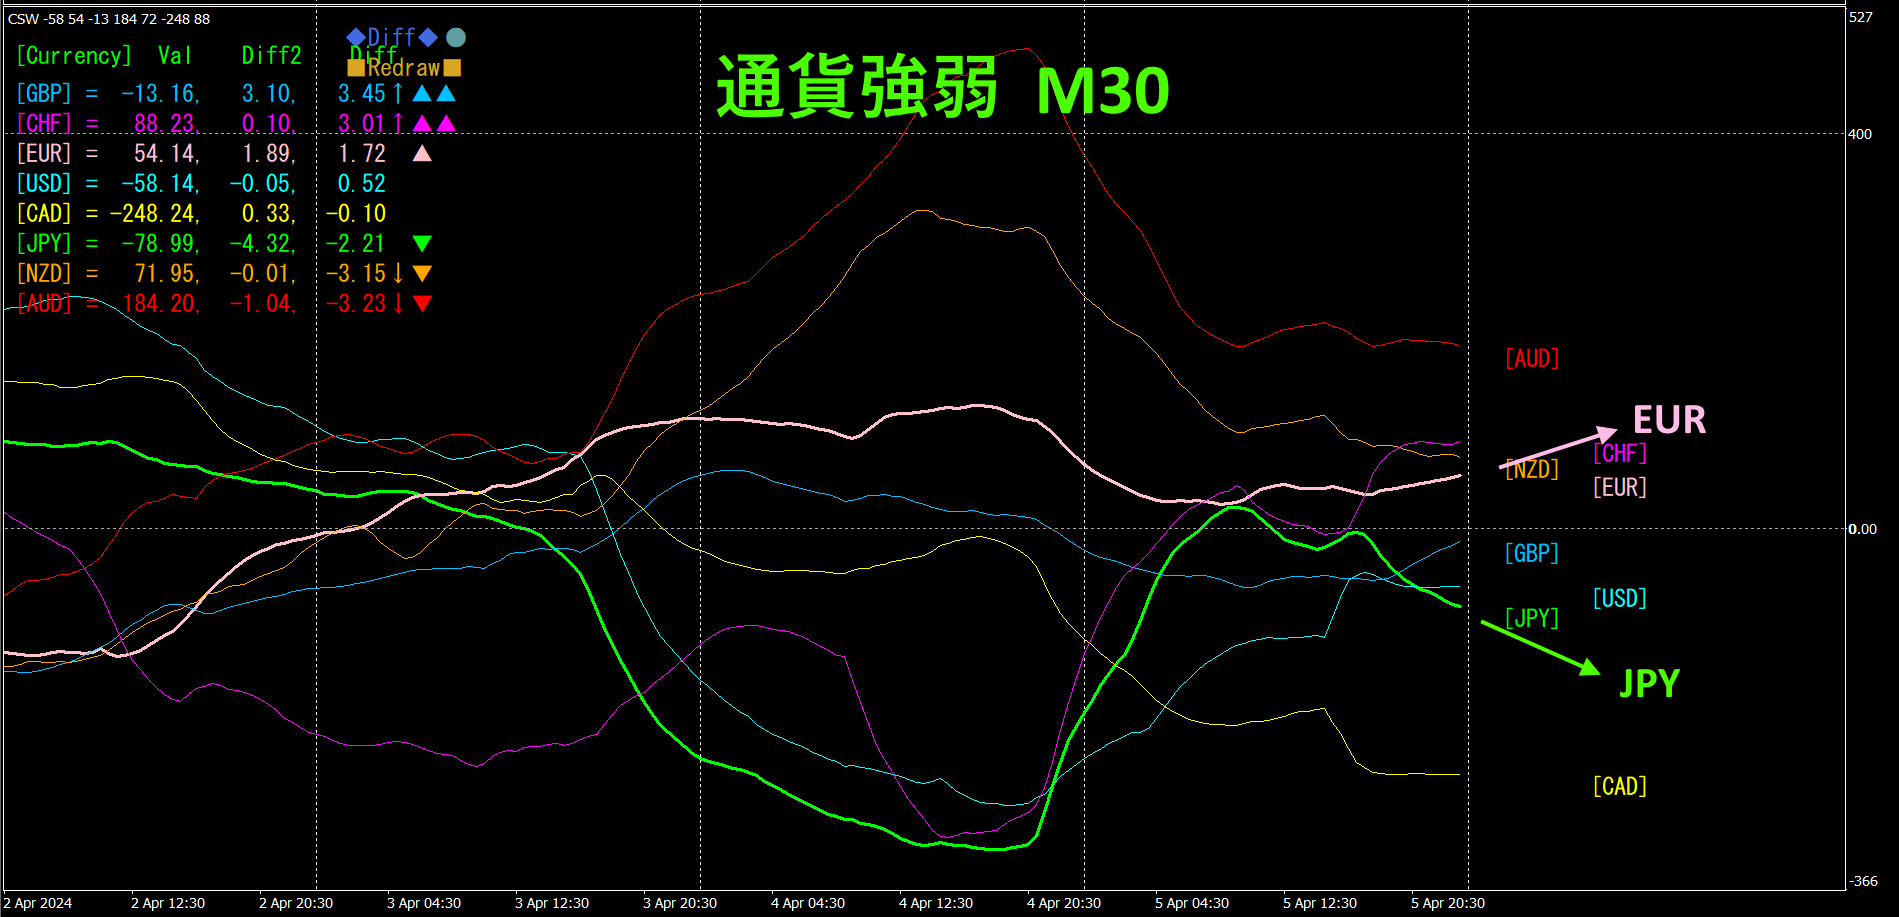
Pink is EUR, green is. JPY is downward, EUR is upward, so the currency strength indicates > , hence EURJPY is expected to rise further.
4. Two new indicators have been released.
“Tore Tore Indicator” and “Tore Tore 28CP_Select Indicator.”
These were created on the premise of viewing the market as waves of convergence/divergence, trading only in the direction from convergence to divergence (and not trading at other times).
Please see the product pages below.
“Tore Tore Indicator”
https://www.gogojungle.co.jp/tools/indicators/50115
“Tore Tore28CP_Select Indicator”
https://www.gogojungle.co.jp/tools/indicators/50203
5.
Trade example using the “Tore Tore Indicator” (AUDJPY)
AUDJPY movement shows 15-minute chart with the “Tore Tore Indicator” added. Wait for the main line to sufficiently converge before trading. If the main line is red, sell; if blue, buy.
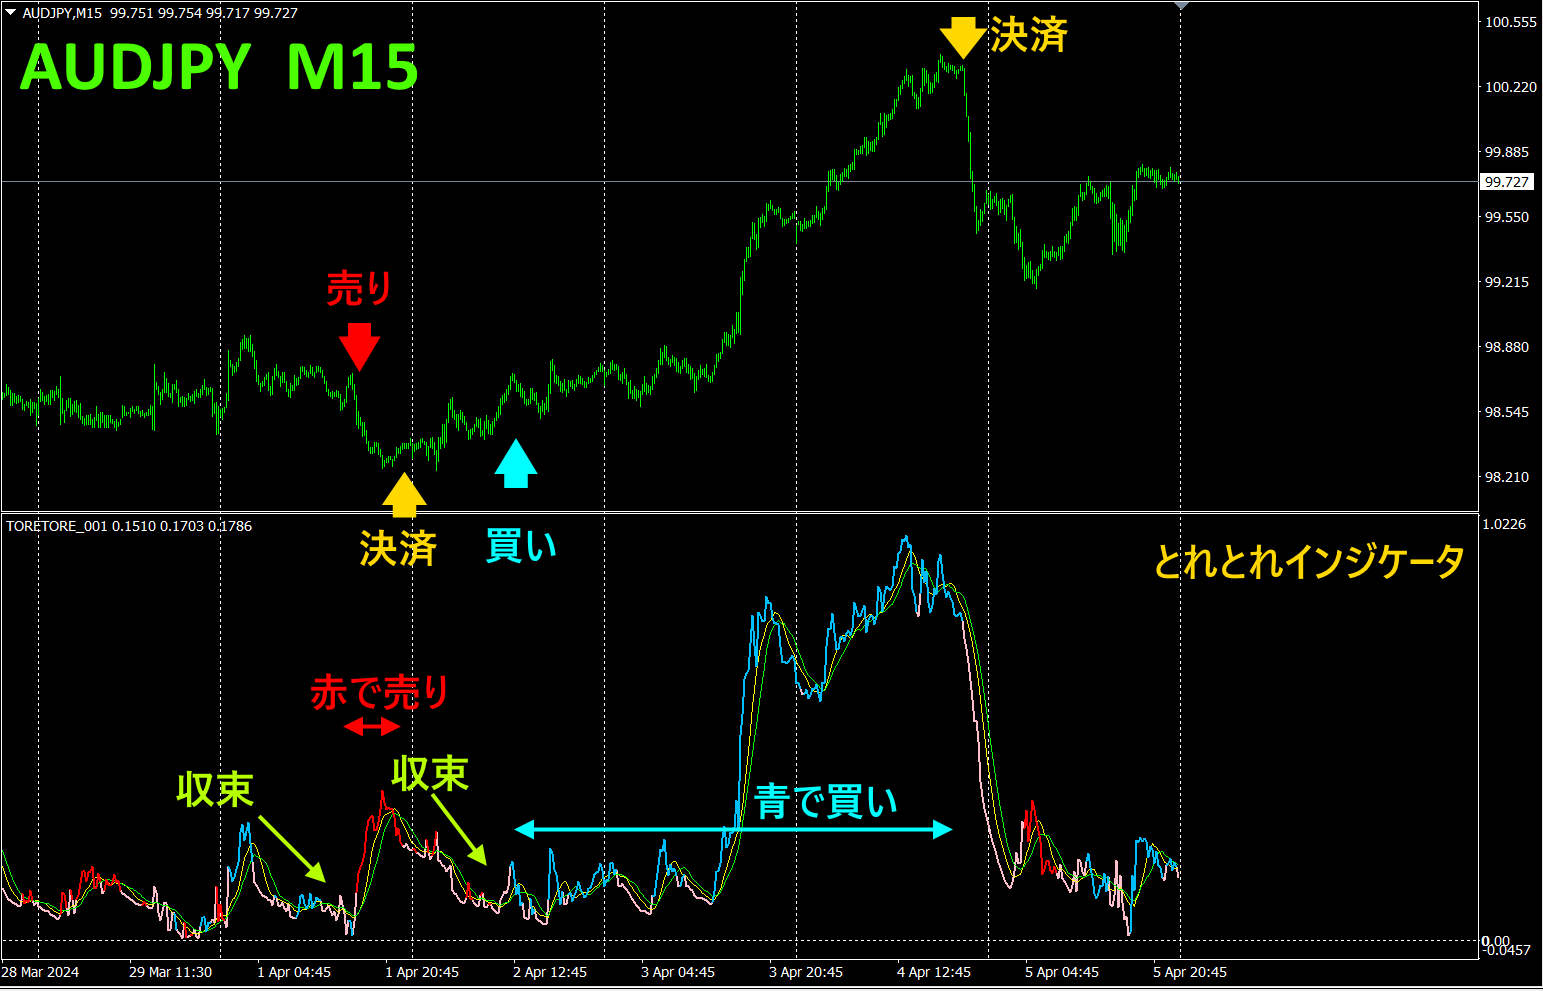
In this example, selling yielded, totaling40 pips, buying yielded170 pips210 pips
The key to using it is waiting for full convergence. After that, simply trade according to the color. While blue remains, hold long positions.
Close when the main line turns downward and the color is no longer blue.
I find this indicator visually easy to understand.
6.
Recommended indicators
Semi-automaticEA“Trend Line EX” allows, with a slanted downward line drawn in advance, automatic buying when it breaks above, and automatic closing when it breaks above the rising line, enabling a passive trading style.
※“Trend Line EX”
https://www.gogojungle.co.jp/tools/indicators/42257

If you are interested in the8C Currency Strength Visualization Indicator, please refer to the following page.

MT4 version https://www.gogojungle.co.jp/tools/indicators/39150
MT5 version https://www.gogojungle.co.jp/tools/indicators/39159
【My current listings】


