
Translation: Indicator using the extended Fibonacci ratio with the Tribonacci ratio
About the Tribonacci Ratio Sign Tool

The “Tribonacci Ratio” is an discretionary-support indicator expanded from an already successful existing EA logic. It has been uniquely extended for discretionary trading.
This indicator automatically draws a Tribonacci Retracement on the chart and displays signals when the major lines are reached and multiple conditions are satisfied.For use, please read the “Product Page Description” and the “FAQ” at the bottom of the page, and be sure to verify operation with Strategy Tester (Visual Mode) before use.
After watching the video below and obtaining the password, you can obtain the Tribonacci Ratio (Gift) from Gogojungle (usable until October 31st)!!!
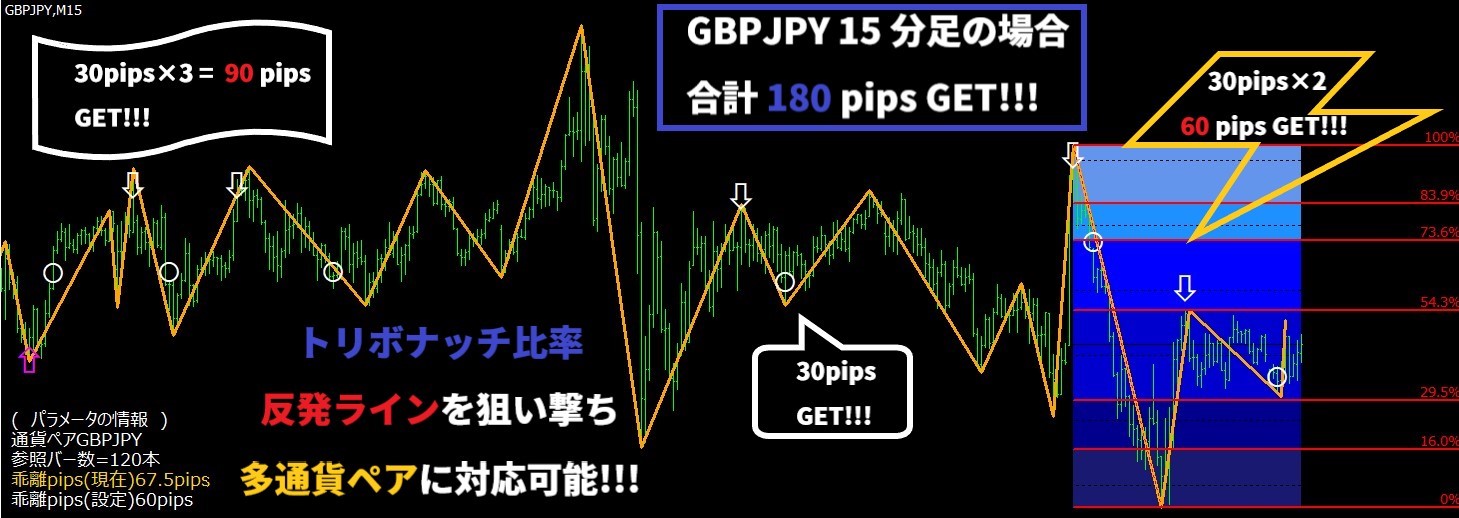
Actual entry examples
About Tribonacci RetracementThe Tribonacci Ratio is an extension of Fibonacci ratios.
Recommended time frame: 15 minutes
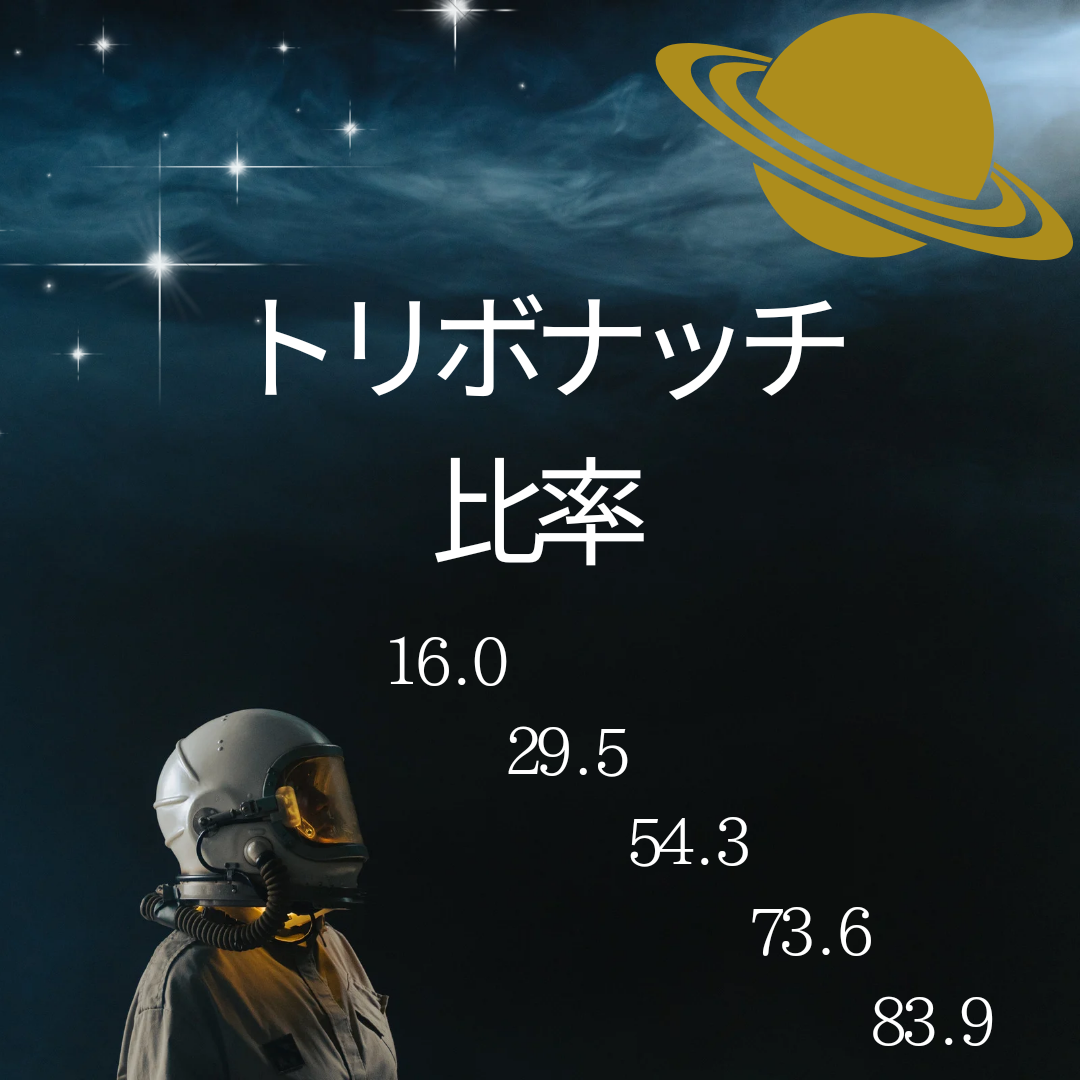
Custom ratios:(①16.0%②29.5%③54.3%④73.6%⑤83.9%)
Purpose: Assist in trend pullbacks & reversals
Support: No restriction on currency pair or time frame (major pairs × 15-min recommended)
History: This indicator clears all sign labels on the chart during startup, restart, timeframe or currency changes (design spec).
For past displays, please use Strategy Tester (Visual Mode).
Main features
Visualization of the Tribonacci ratios: five main lines(①16.0%②29.5%③54.3%④73.6%⑤83.9%) automatically drawn. Hierarchical color-coding improves visibility.
Signals generated via a composite logic: do not enter on a single line touch; signals appear only when multiple conditions are met.
• Downtrend
• Uptrend

TribonacciRetracement is drawn automatically based on the lowest and highest values within the set reference bars.Tribonacci Retracement is drawn accordingly.
About ZigZag
Tribonacci Ratio automatically draws ZigZag.
ZigZag × Tribonacci Ratio to view the “waves” at a glance: intuitively grasp downturn/upturn flow and pullback candidates.
Tribonacci Zone, Stochastics
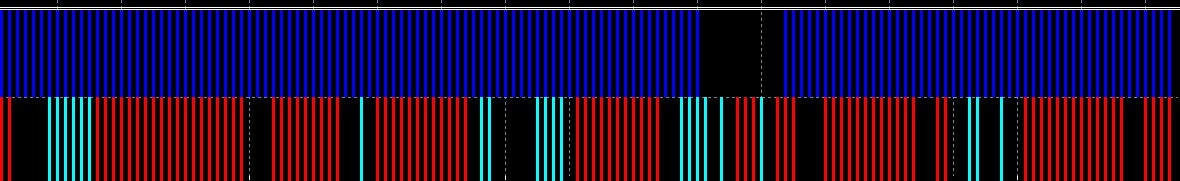
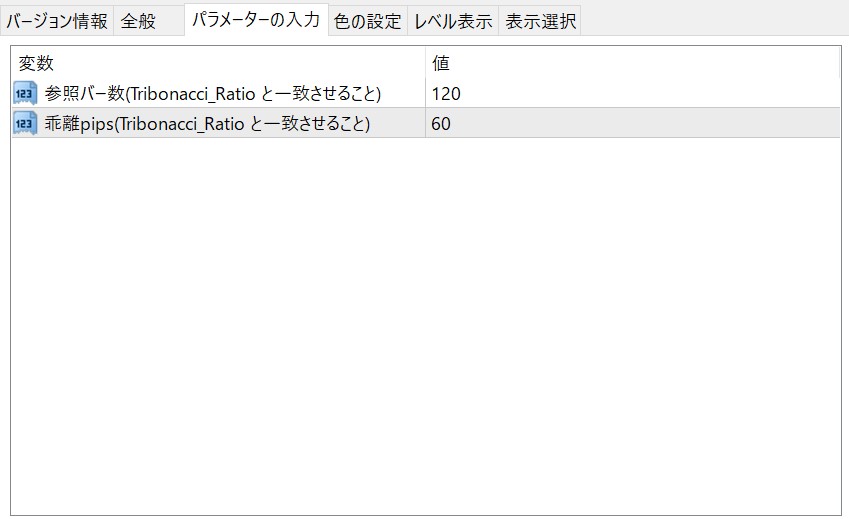
In a sub-window, add an auxiliary indicator (optional) “Histogram(Tribonacci_Ratio).ex4” to visualize stochastics more clearly.
In the lower limit zone (0-30%), histogram is light blue; in the upper zone (70-100%), histogram is red.
When Tribonacci 0% to 50% diverges beyond the specified pips, a blue-violet histogram is shown.
How it works
(1) Automatic reference-bar detection
Generate the main five lines using the highest/lowest within the set reference bars as the basis.
(2) Simple confidence evaluation
Within the set reference bars, the highest and lowest values set the Tribonacci lines automatically. If the distance from 0% to 50% (in pips) is above the configured threshold, the lines are considered highly reliable; if not, entries are avoided.
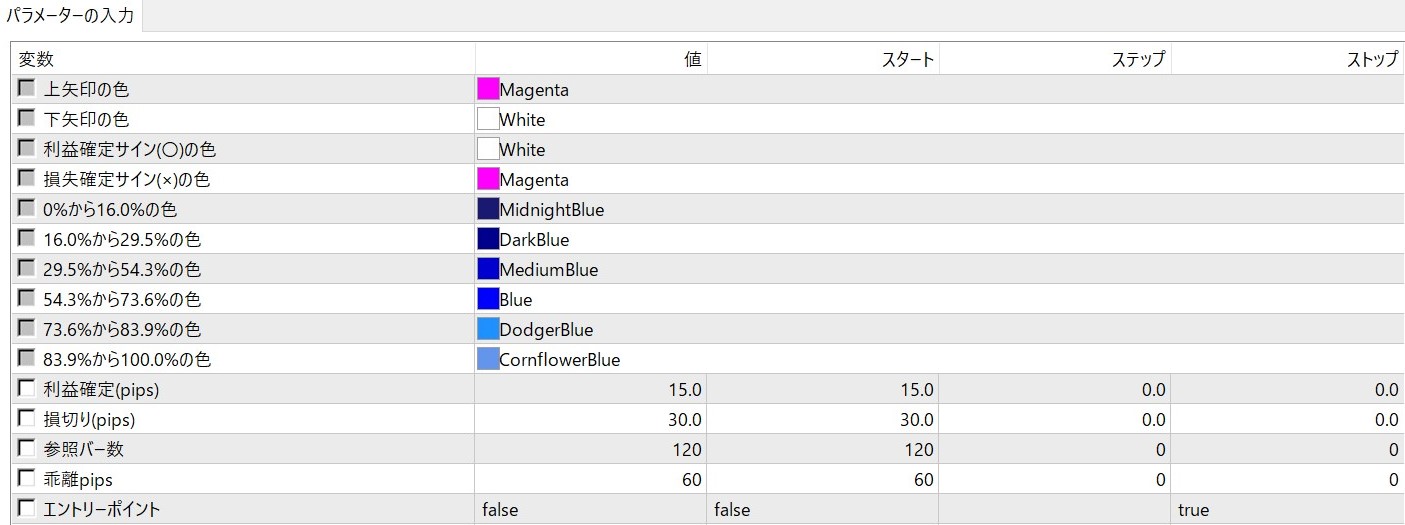
Reference bars and distance (0% to 50% in pips) are parameters you can freely set, along with colors for each Tribonacci level, arrow colors, take-profit and stop-loss signals, take-profit/stop-loss pips, entry point ratio display, etc., all configurable.
(1)Tribonacci_Ratio.ex4
(2)Histogram(Tribonacci_Ratio).ex4

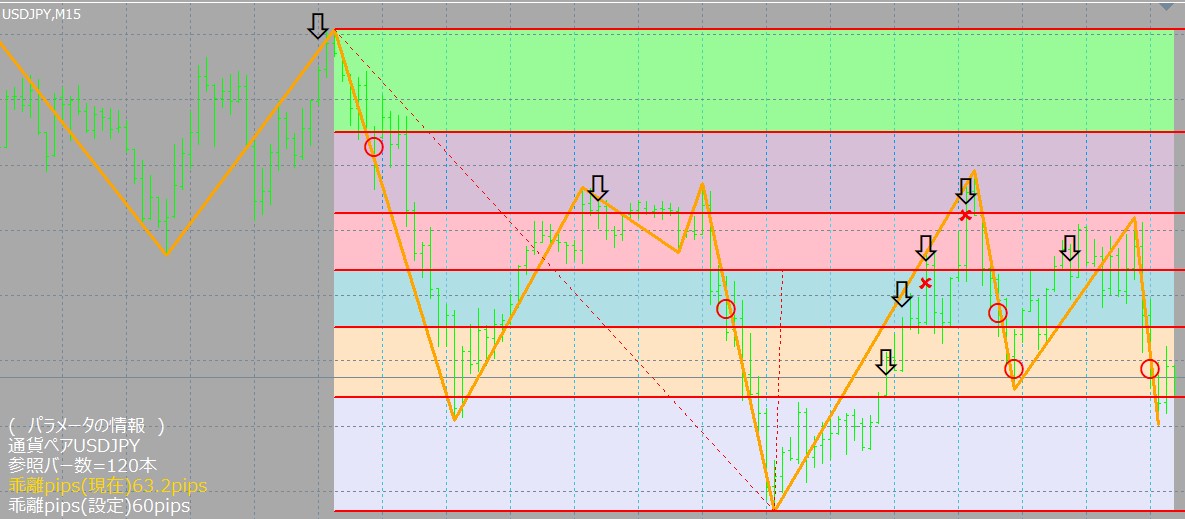
Only when the major lines are reached and composite conditions are met, an arrow sign is displayed. Take-profit sign = “〇”, stop-loss sign = “×”. If an upward arrow is displayed, buy entry.
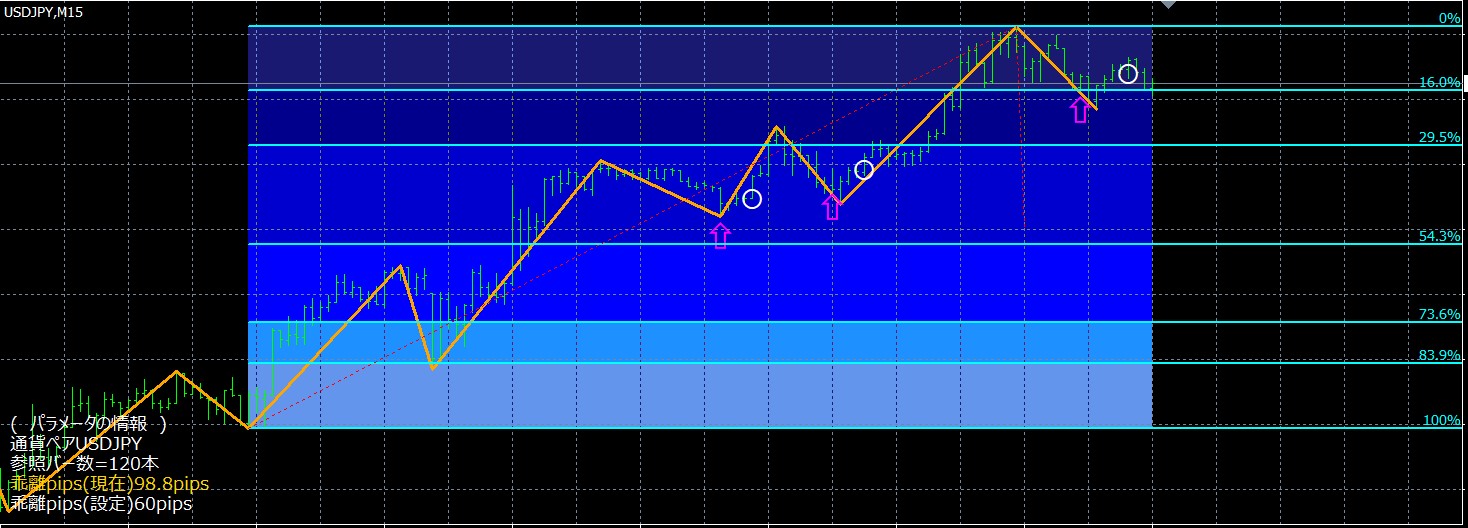
This is an actual example of up-trend display. It shows entries accurately catching pullbacks.

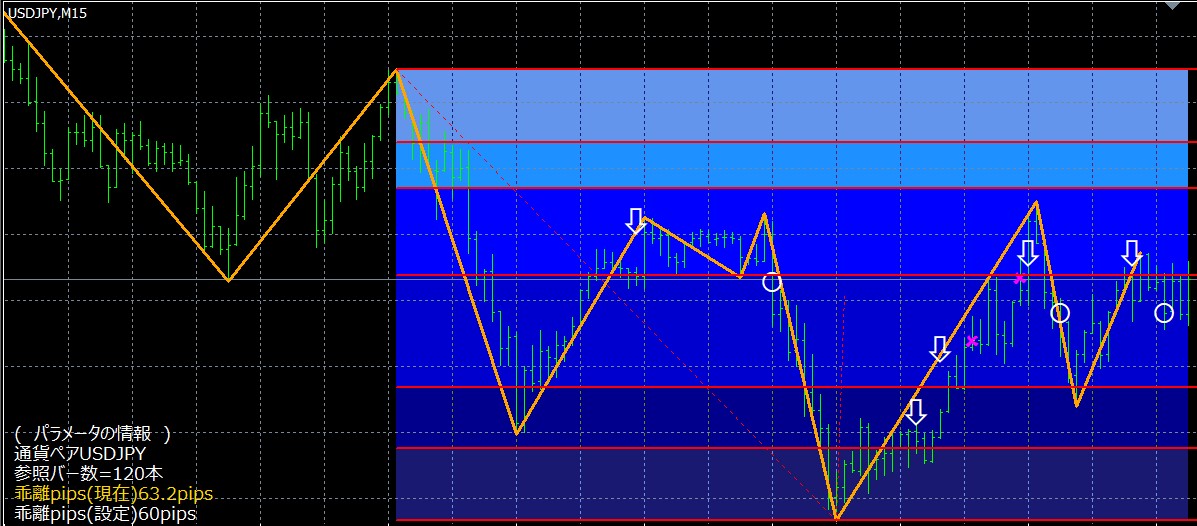
This is an actual example in a down-trend.
You can see prices reacting to Tribonacci lines. There are relatively many trades, steadily earning profits.
(4)Risk example
Take-profit 15–30 pips, stop-loss about 30 pips (adjustable to market conditions).
Note: multiple ratio signals may appear on the same bar. This results from simultaneous multiple ratio conditions being met; there is no double-signaling or duplicate orders for the same ratio.
(5) Automatically displays the latest parameters at the bottom left of the screen
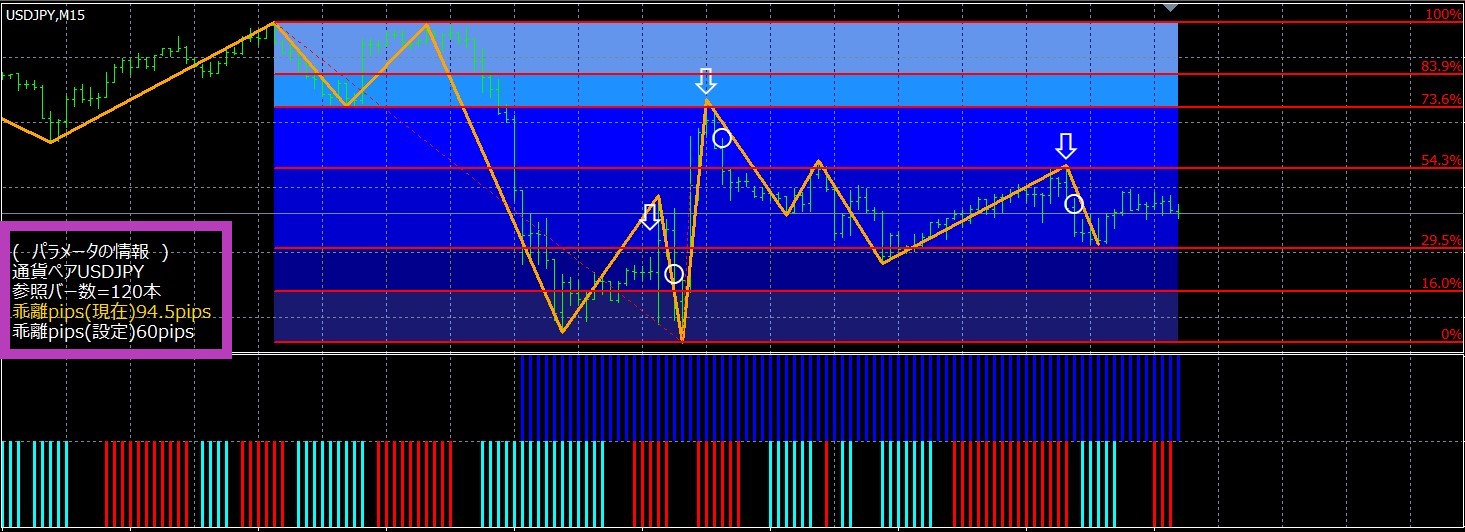
Bottom-left displays (1) current currency pair (2) reference bar count (3) current divergence in pips (4) real-time updated divergence pips setting.
(3) If the current divergence pips exceed the configured divergence pips, the text turns gold!!!
Recommended usage
(1)Verify behavior in Visual Mode
First, check display and timing with Strategy Tester (Visual).
(2)Begin operating on a 15-minute chart
Start with major currency pairs (USDJPY / EURUSD / EURJPY / GBPUSD / GBPJPY).
Example recommended initial parameters
Reference bars: 120
0%–50% divergence threshold: 60pips
Take-profit/stop-loss: 15.0 pips / 30.0 pips
(3) Entry point (optional)
Entry point display (ratio label): false (set to true if needed)
An evolved indicator from existing EAs
“Tribonacci Ratio” is an indicator that takes the performance of successful existing EAs and makes it usable for discretionary trading.
Differences from existing EAs
By turning into an indicator, you can apply the logic to discretionary trading. It offers greater param flexibility and is suitable for multi-currency and multi-timeframe deployment (note: it will not be an exact match to an EA).
Main reasons it does not match the EA
• Data granularity (backtest history vs actual tick differences)
• Evaluation timing (EA may reference uncertain bars, while this indicator displays stable signals on closed bars)
• Processing order differences (internal update order can cause signals to light up or not)
EURUSD M15 (2010–2025) 1.29 about 81% 3.48%
USDJPY M15 (2010–2025) 1.24 about 81% about 3.00%
Broker/spread/history may cause variation. Please verify on your own before live operation.
The EA does not have discretion!! But with this indicator you can freely adjust and customize!!!
Trade example: Day trading
By changing parameters, this indicator can support your trading style, including① scalping ② day trading ③ swing trading to fit your lifestyle.
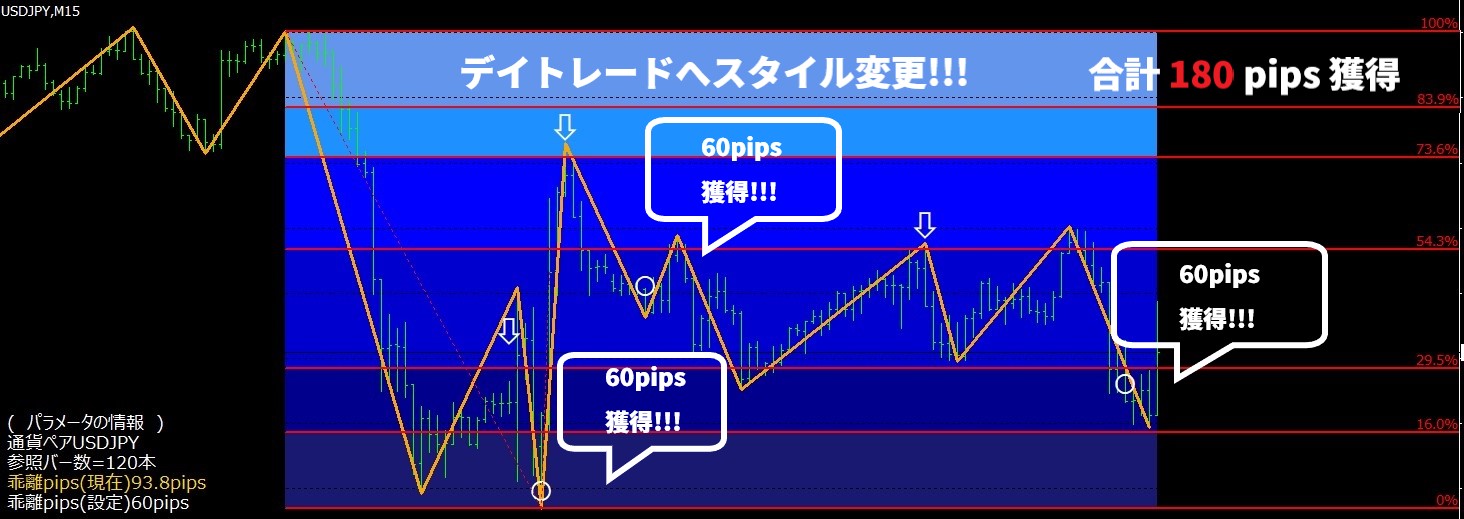
Increasing take-profit from default values can make trading closer to day trading. It takes longer, but the better return (pips gained) will be larger.Time is required, but the return increases accordingly.
Currency pairs and timeframes can be freely chosen.

Many indicators and system traders restrict use to a single currency pair and timeframe, but
the Tribonacci Ratio has no limitations on currency pairs or timeframes, and its customization is highly flexible, allowing validation across various currency pairs and timeframes.
By analyzing the chart, you can create your own original indicator!!!
Tribonacci Ratio is recommended for people who

・Want to grasp the market globally using Tribonacci and ZigZag・Are beginners who have never used a signal tool
Frequently Asked Questions

Q.1 Is it operating normally?
Backtest (BT) vs Real Time (RT) signals differ. (Details below)
A.4-1
BT = recalculation over past data.
RT = updates with each price tick and bar close.
A.4-2 The order of events within a bar cannot be perfectly reproduced
Within the same bar, whether it goes up or down can affect results. A.4-3
Note: The above are intrinsic characteristics of the system, not indicator defects. This indicator prioritizes stable display based on closed bars.
Q.5 How do the arrows (entry) and the circles/x (exit) correspond?
A.5 Double-click the object → right-click → check the name in Properties.
Buy: UpArrow_Ratio
Sell: DownArrow_Ratio
Buy exit: Buy_RikakuSign_Ratio or Buy_SongiriSign_Ratio
Sell exit: Sell_RikakuSign_Ratio or Sell_SongiriSign_Ratio
Q.6 No signals appear.
A.6 Main causes and remedies
• Divergence pips not reached (0%–50% distance below threshold → lower divergence pips / increase reference bars)• Composite conditions not met (Line touch alone does not enter → wait for conditions)
Q.7 Multiple signals on the same bar.
A.7 When multiple ratios are satisfied simultaneously, multiple signals appear on the same bar. This is display behavior; the indicator itself does not place orders.
To aid verification, the indicator includes an “Entry Point” parameter. Default is [false], so set to [true] to display the ratio under the entry arrow.
(Supplement) Reasons the display differs between backtest and real-time
Reason for difference in entry (arrow)
Backtest (BT)
Recalculates a series of confirmed past bars all at once (evaluates consecutive bars in one go). Real-time (RT)
Evaluates tick-by-tick or bar-close in order
Because of this difference, even if conditions are met just before confirmation, they may not be accepted in a confirmation-based design. The finer data granularity (pseudo-ticks vs real ticks) can cause divergence position relative to Tribonacci Ratio boundary interactions.Boundary situations are prone to flip due to ordering.
Exit reasons (◯ / ✕)
Within the same bar, RT may not perfectly reproduce whether the price touched up or down first.
Bid/Ask & spreads differ; RT uses real Bid/Ask, BT uses fixed or simplified values, so reach conditions can swap.
Q.1A.1 Around boundaries, BT tends to display more signals. Clear-cut cases generally align.
Q.2 Is it a defect that circles and crosses reversed?
A.2 This is a design characteristic. The order of bars and Bid/Ask (spread) handling can swap which signal is shown.
This indicator displays on a confirmed-bar basis. Since backtests use batch recalculation and pseudo-ticks, signals (and circles) near boundaries may flip. This is not a defect but a design feature.
DisclaimerForex trading involves significant risk, including potential loss of principal. Tribonacci Ratio analyzes past price movements to assist aiming for profits in actual markets, but does not guarantee future profits.
We check for issues as much as possible, but we cannot compensate for losses due to glitches or misoperations, so please understand in advance.Investing should be done at your own risk