Third session: What about the moving average line?

↓↓↓ Commemorative 第3回!↓↓↓

From the previousCandlestickwe studied,
this time, to make the chart trends easier to see, let’s study moving averages!
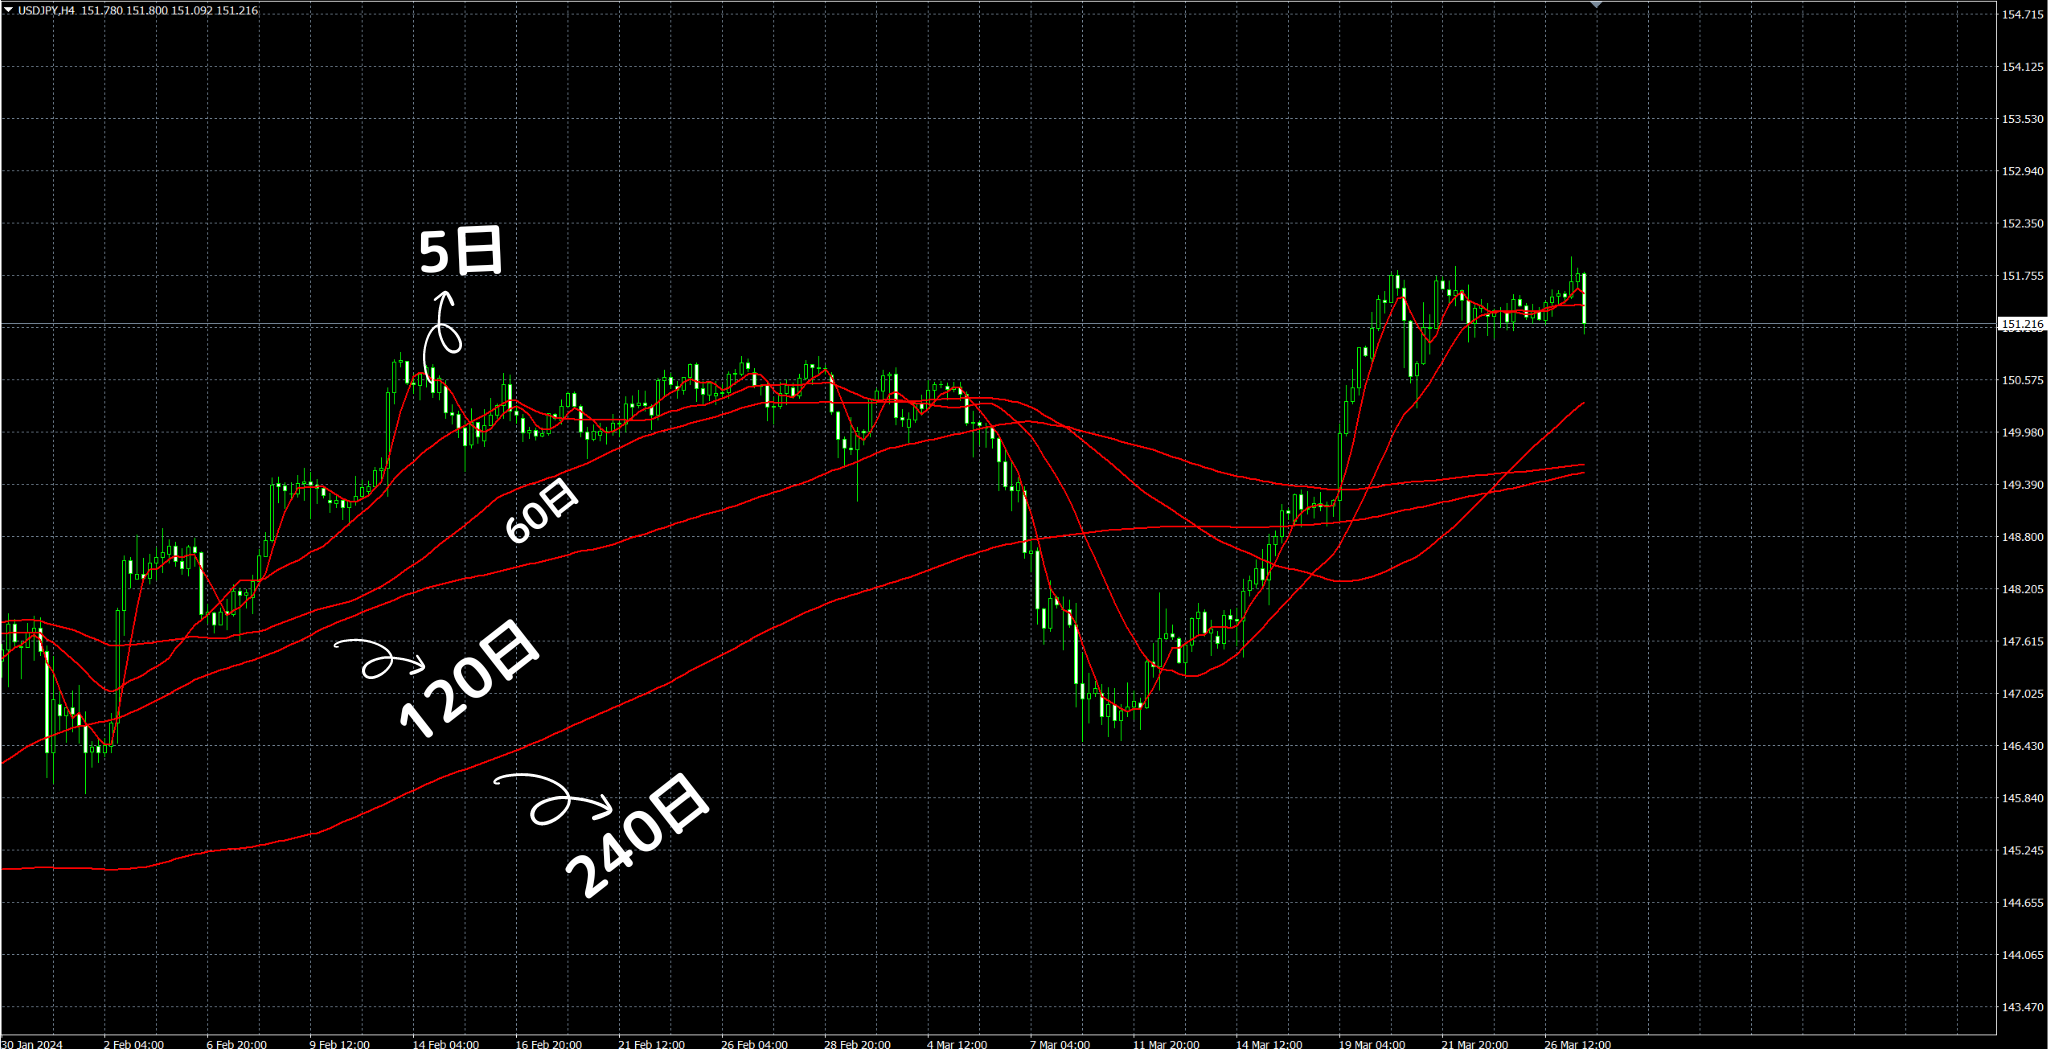
Moving Average-Moving Average (abbreviation: MA): the average price over a fixed period, represented as a line chart
Common interpretations:
5-day line, 25-day line, etc. (short-term)
13-week moving average, 26-week moving average, etc. (mid-term)
120-day line, 240-day line (long-term)
As an image for reference, please imagine it ♪
That’s all!
× ![]()