

Capture only the profitable pattern and enter! (March 27)
Today (3/27)
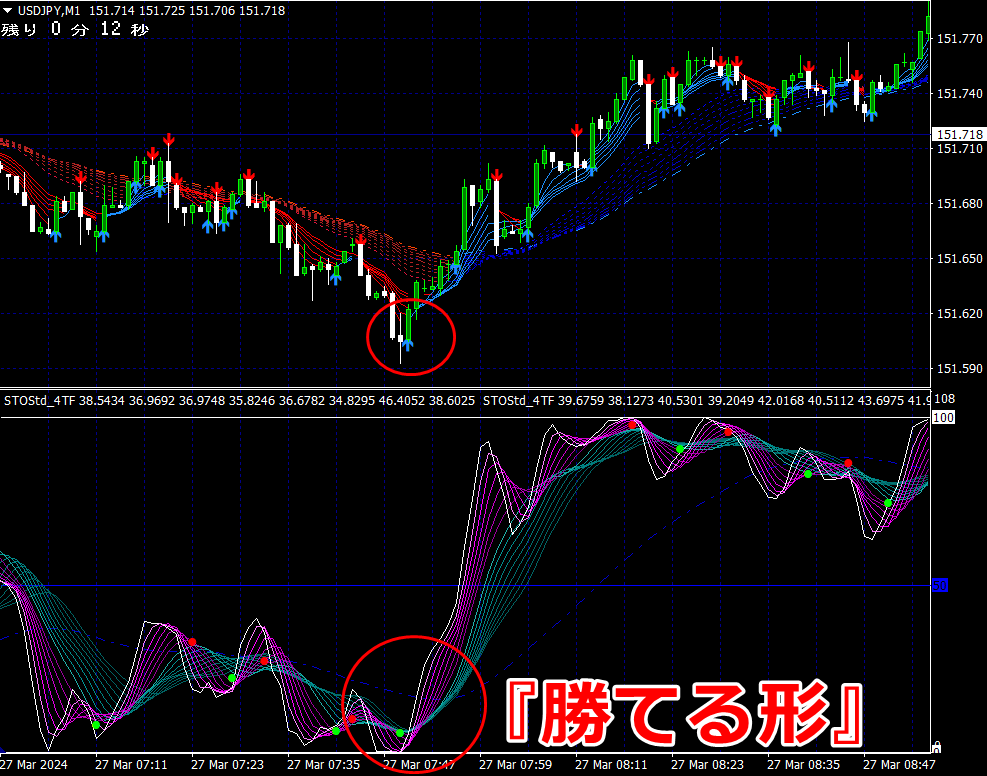
【Winning Pattern】Capture it and enter!
(USDJPY 1-minute chart)
【Winning Pattern】Capture it and enter!
(USDJPY 1-minute chart)
★After the signal lights up, a pink band rises to the green band shape to a guaranteed entry!
(Click image to enlarge)
What is the【Winning Pattern】?
An indicator that lets you visually “learn” the entry point
Specialized for short-term trading in binary options or FXWe disclose a rock-solid entry method using the “1-minute chart indicator.”
<The entry steps are①② simple!>
In an upward trend,

①With the arrow sign lit, prepare to enter.
②With the arrow sign lit,if the indicator’s pink band rises from below to cover the green bandfrom belowin a scooping shape,enter high (buy) on a 1-minute or 3-minute decision just before or just after the current candle closes.
※Signal lit does not equal entry, so if the indicator does not form a scooping shape of the green band, do not enter (frequency of entries at signal light is about once every few times).
※On a 1-minute chart, the daily entry opportunities are several dozen to 100 times
“Capture only the Winning Pattern and enter!”
< Shape that Scoops Up the Green Band=What is the Winning Pattern? >
Points where similar entries are possible are the indicator shapes shown in the image below.
What is the【Winning Pattern】?
An indicator that lets you visually “learn” the entry point
Specialized for short-term trading in binary options or FX
We disclose a rock-solid entry method using the “1-minute chart indicator.”
<The entry steps are①② simple!>
In an upward trend,
①With the arrow sign lit, prepare to enter.
②With the arrow sign lit,if the indicator’s pink band rises from below to cover the green bandfrom belowin a scooping shape,enter high (buy) on a 1-minute or 3-minute decision just before or just after the current candle closes.
※Signal lit does not equal entry, so if the indicator does not form a scooping shape of the green band, do not enter (frequency of entries at signal light is about once every few times).
※On a 1-minute chart, the daily entry opportunities are several dozen to 100 times
“Capture only the Winning Pattern and enter!”
< Shape that Scoops Up the Green Band=What is the Winning Pattern? >
Points where similar entries are possible are the indicator shapes shown in the image below.
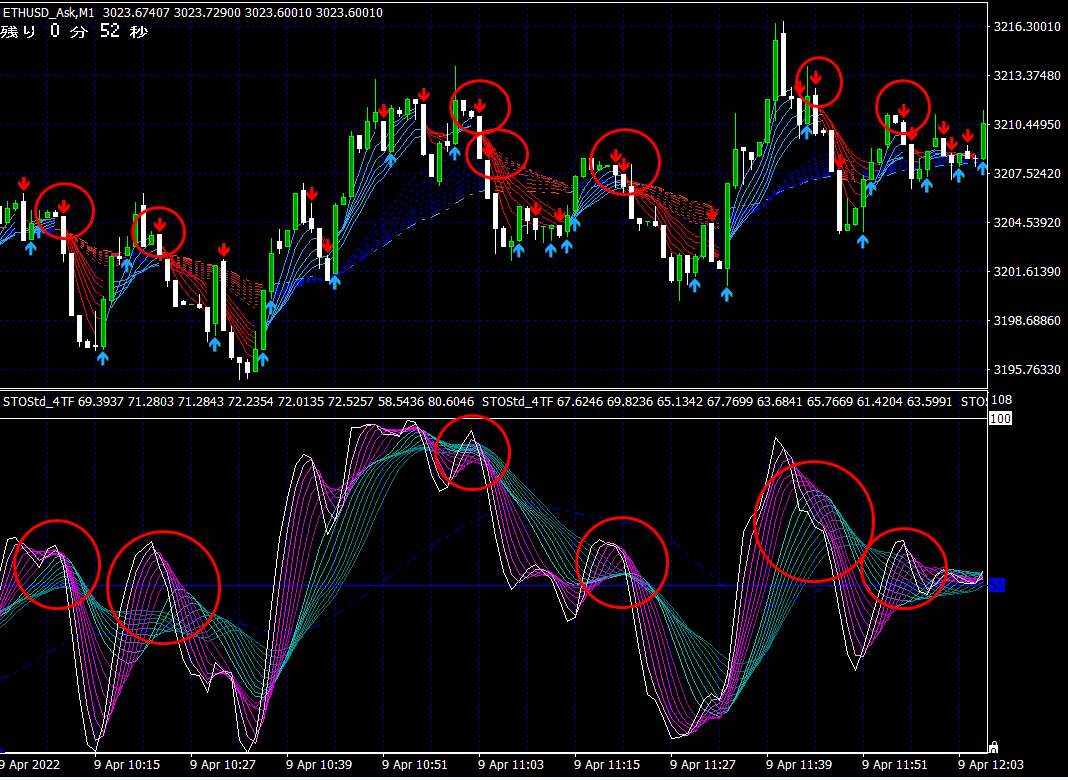
In a downward trend,
①With the arrow sign lit, prepare to enter.
②With the arrow sign lit,the indicator’s pink band covers the green bandfrom abovein a sweeping shape,then enter low (sell) on a 1-minute or 3-minute decision just before or just after the current candle closes.
※Signal lit does not equal entry, so if the indicator does not form a covering shape by the green band, do not enter (frequency of entries at signal light is about once every few times).
※On a 1-minute chart, daily entry opportunities are several dozen to 100 times
“Capture only the Winning Pattern and enter!”
< Shape that covers the green band =What is the Winning Pattern?>
Points where similar entries are possible are the indicator shapes shown in the image below.
× ![]()


