

[March 26, 2024] Historical verification using the Heaven and Earth Indicator (Pondole)
This is a validation of Pontor. A good pattern appeared on the 4-hour chart, so I will introduce entry points on the 15-minute chart.

・This article primarily covers backtesting using “Heaven and Earth Indicator.”“Heaven and Earth Indicator”.
・This content is based on the use of the most accurate tool“15-minute + 4-hour simultaneous monitoring method”.
・This tool is a revolutionary trading tool that can be used even without understanding traditional FX theories (Elliott Wave, Dow Theory, Garvil’s law, cycle theory, price action, Fibonacci, support/resistance, channels, etc.).
・The articles at the links below showcase valuable DMs, reviews, and posts from users. We curate winning reports and other useful messages, so we believe they will be helpful to everyone.
【Daily Updates】 Real user impressions (Review version) who actually used Heaven and Earth Indicator
【Daily Updates】 Real user impressions (DM version) who actually used Heaven and Earth Indicator
【Daily Updates】 “#Heaven and Earth Indicator” search results

Heaven and Earth Indicator is a trading method using the original indicator developed by me, Abusan, released in February 2022. Thanks to everyone’s support,「GogoJungle Award 2022, 2023 has been awarded twice in a row.
■ Heaven and Earth Indicator
https://www.gogojungle.co.jp/tools/indicators/35780
■ Heaven and Earth Indicator【MT5 Version】
https://www.gogojungle.co.jp/tools/indicators/47523
■ Heaven and Earth Mountain
https://www.gogojungle.co.jp/tools/indicators/37744
■ Heaven and Earth EA ~ Semi-automatic Trading System ~
https://www.gogojungle.co.jp/tools/indicators/43213
■ Heaven and Earth Dashboard
https://www.gogojungle.co.jp/tools/indicators/46257
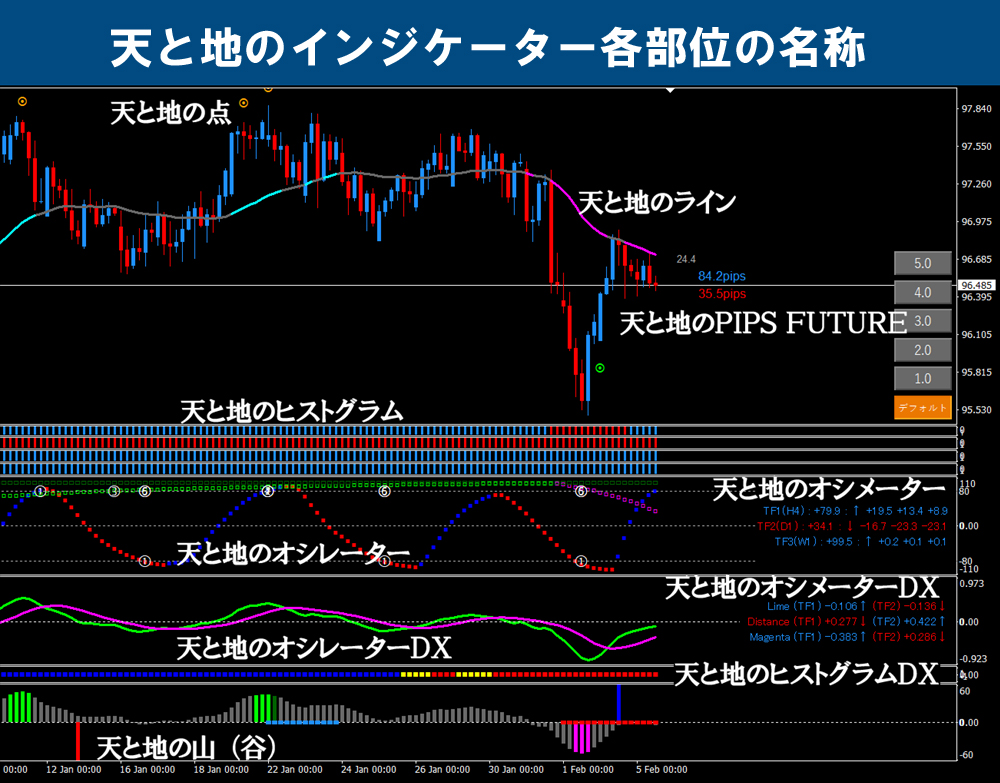
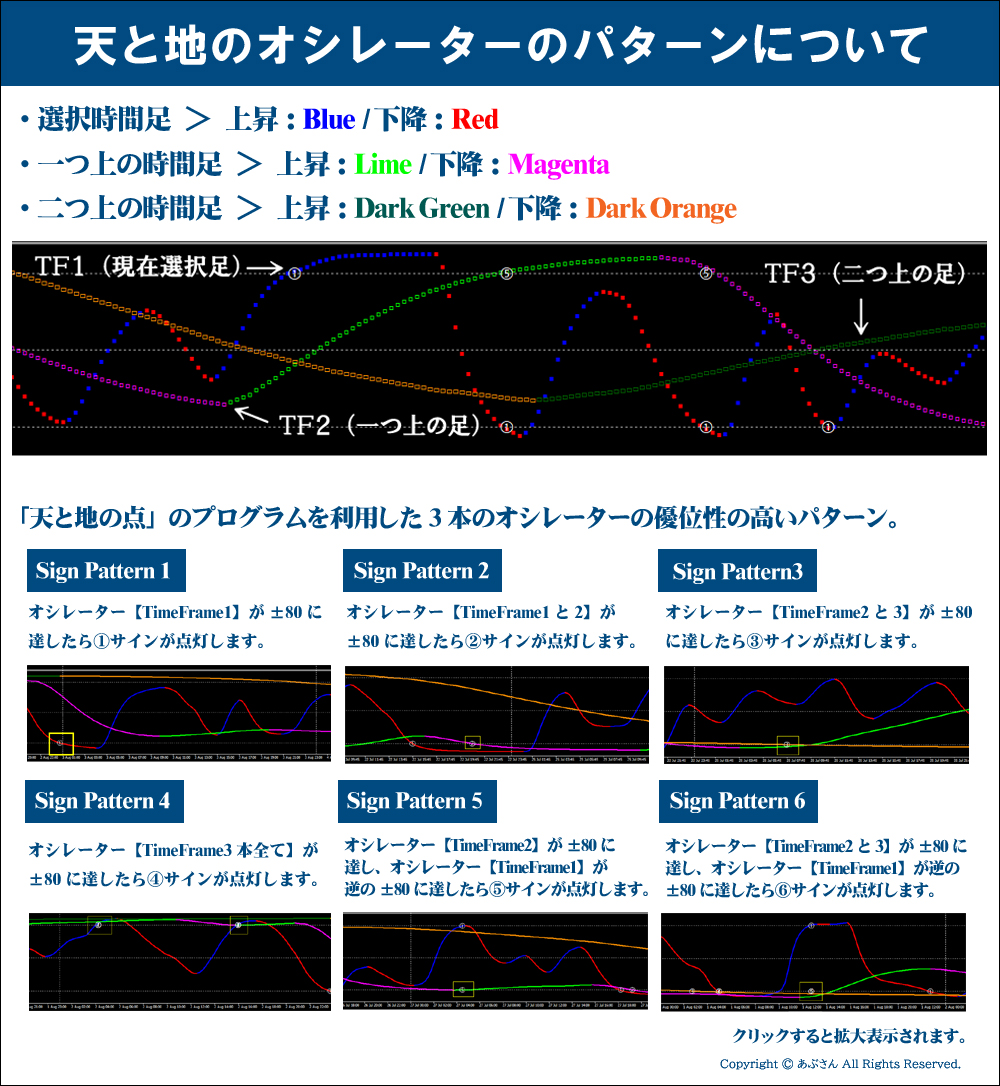
※ For specialized terms used in this blog, please refer to the following: “Names of the components of Heaven and Earth Indicator” and “Patterns of Heaven and Earth Oscillator.” If you have any other questions, please refer to the Heaven and Earth Indicator sales page Users who are already using it can simply read the user manual.
Now, let’s move on to the validation.
Thank you in advance!
※ All images enlarge when clicked.

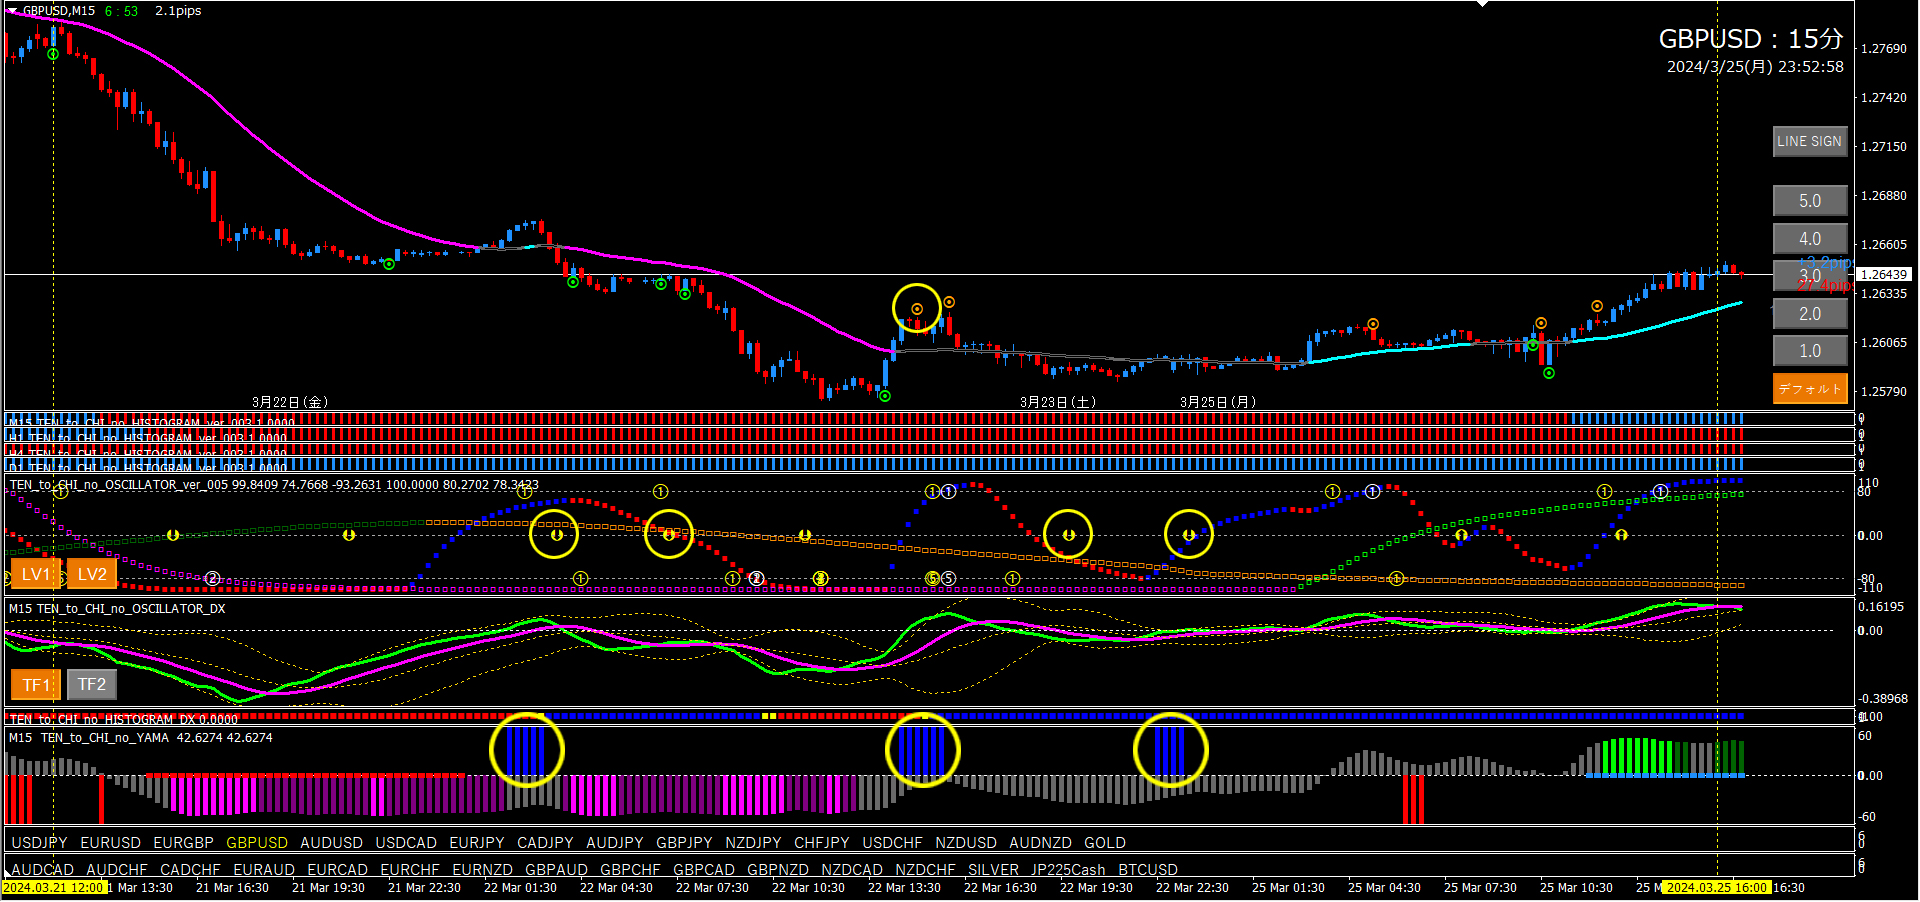
Pontor 15-minute chart + 4-hour chartBacktesting(March 21, 2024 ~March 25)
※ Please look at the yellow vertical line. There is a yellow vertical line at the same location on the 15-minute chart as well. (Using LINK LINE)
■ 4-hour chart (environment recognition)
The left vertical line marks the place judged as bearish. The right vertical line marks the place where bearish view ended based on the long entry signal.
Oscillator TF2 is signaling a short entry while declining from +80. The histogram and histogram DX are red as well. All good reasons align. At this point, we judged the trend as bearish. Later, a long entry signal lit up, so we ended the bearish stance.
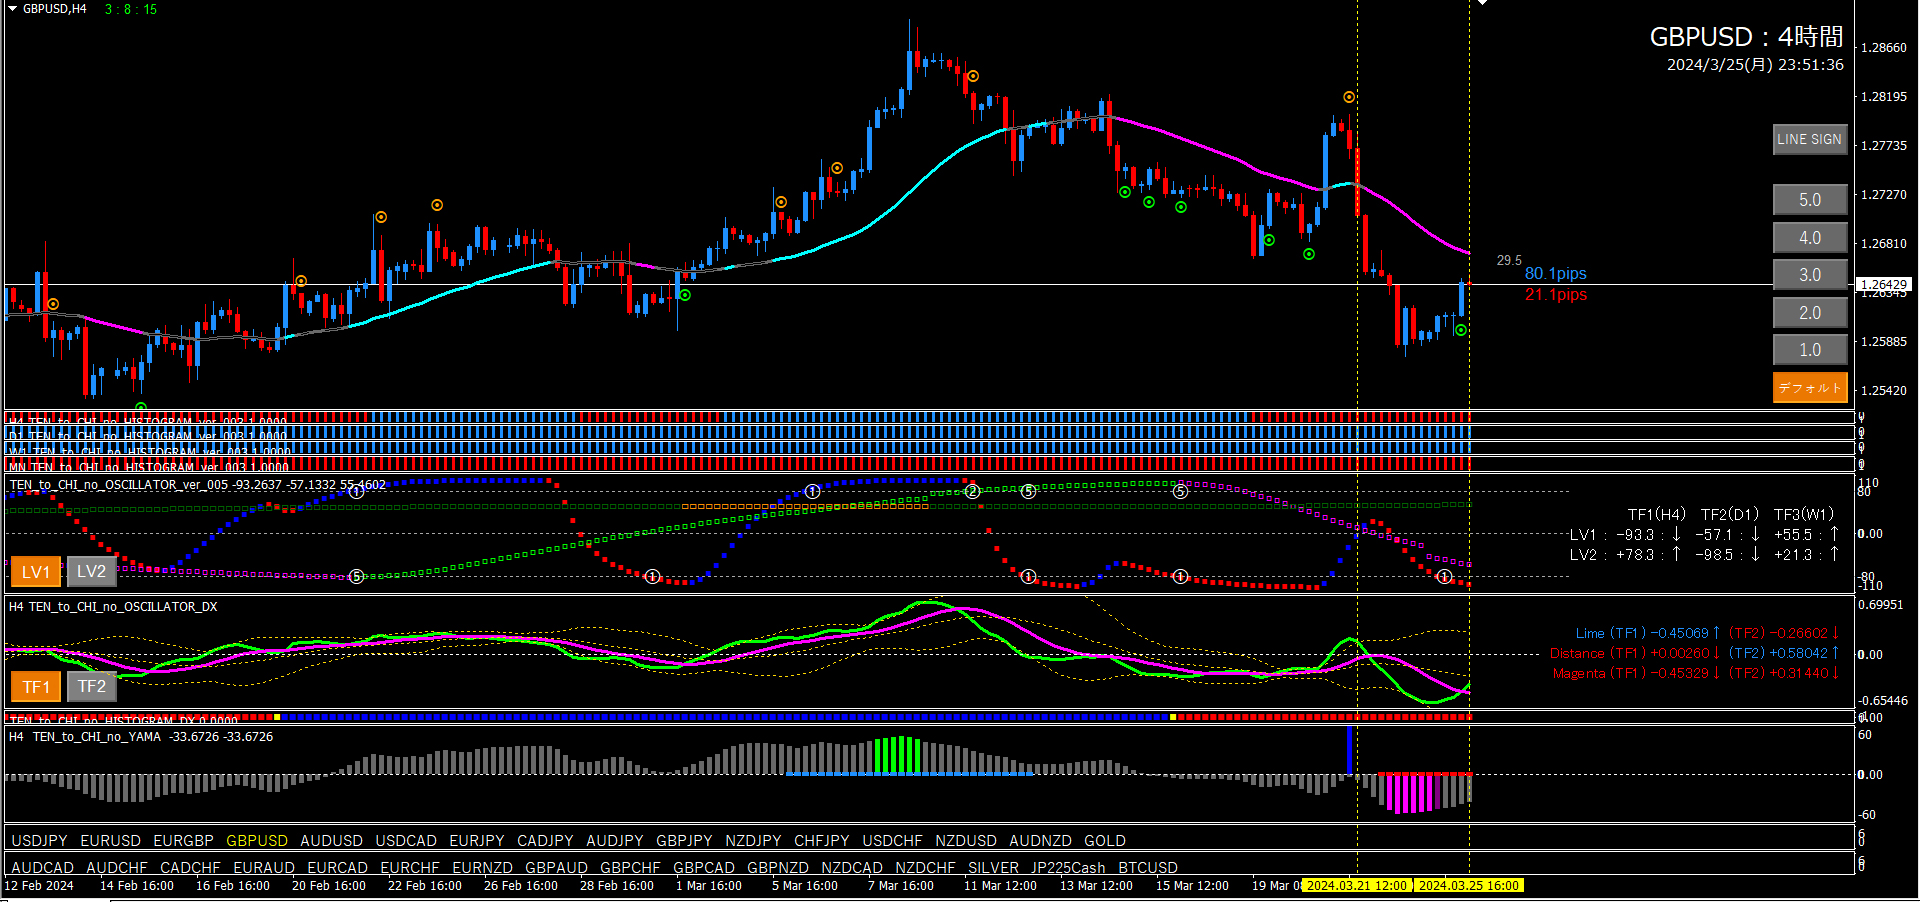
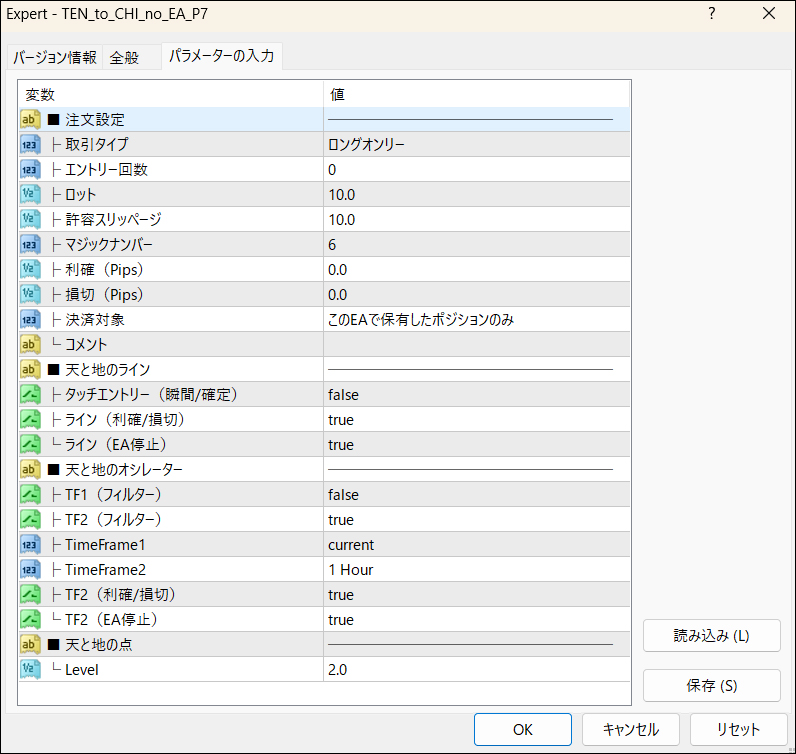
When you can determine bearish on the 4-hour chart, you can set EA Pattern ⑦. If the histogram (Current) turns downward (red), it yields good results. EA Pattern ⑦ and Trade Pattern ③ Reverse version perform strongly in strong trends. The histogram (Current) is very useful for these judgments. Of course, checking other indicators to increase your basis improves victory stability.

That is all.
We hope this at least helps everyone a little.
