

Is it true that you can’t use Stochastic?
Issues regarding Stochastics
“Generally, when the numerical value of the Stochastic is 80% or higher, it is said to be overbought and a sell signal, but this is wrong. Explain why.”
Explanations of technical analysis found in books or on the internet often list definitions or formulas, and especially for oscillator-type indicators,
“If it is above XX%, it is overbought and a sell signal; if below XX%, it is oversold and a buy signal.”
They typically show a price chart of a market where the indicator is functioning to some extent and finish the explanation in a few pages.
As a result, readers end up believing it and conclude that technical indicators cannot be used, and studying technical analysis is meaningless.
I want readers of this article to understand the definitions and formulas properly and learn to apply them to the market effectively.
Answer
“Stochastics is a numerical representation of the relative height of the current price, and if it consistently stays above 80%, the market is in an uptrend.”
Explanation
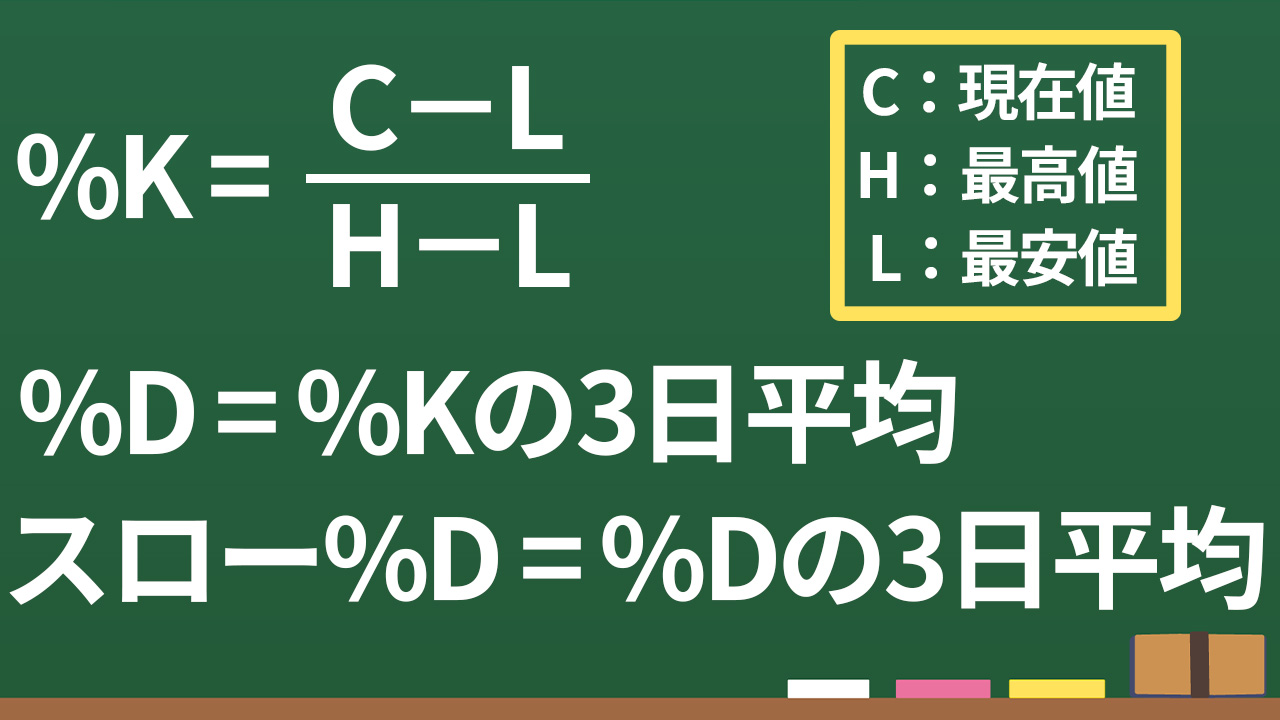
The definition of Stochastics is,
%K=(current price − lowest price) ÷ (highest price − lowest price)
%D=%K’s 3-day moving average
Slow %D=%D’s 3-day moving average
If you look closely at the definitions, both %D and Slow %D use %K as the baseline.
In Stochastics, %K is the most important, so this time we will focus only on %K.
In a previous article about MACD, we also focused only on the MACD line.
MACD is something that looks ahead to XX
For some technical indicators, with multiple lines or values, it can be hard to interpret, so first make sure you understand the basics before moving on.
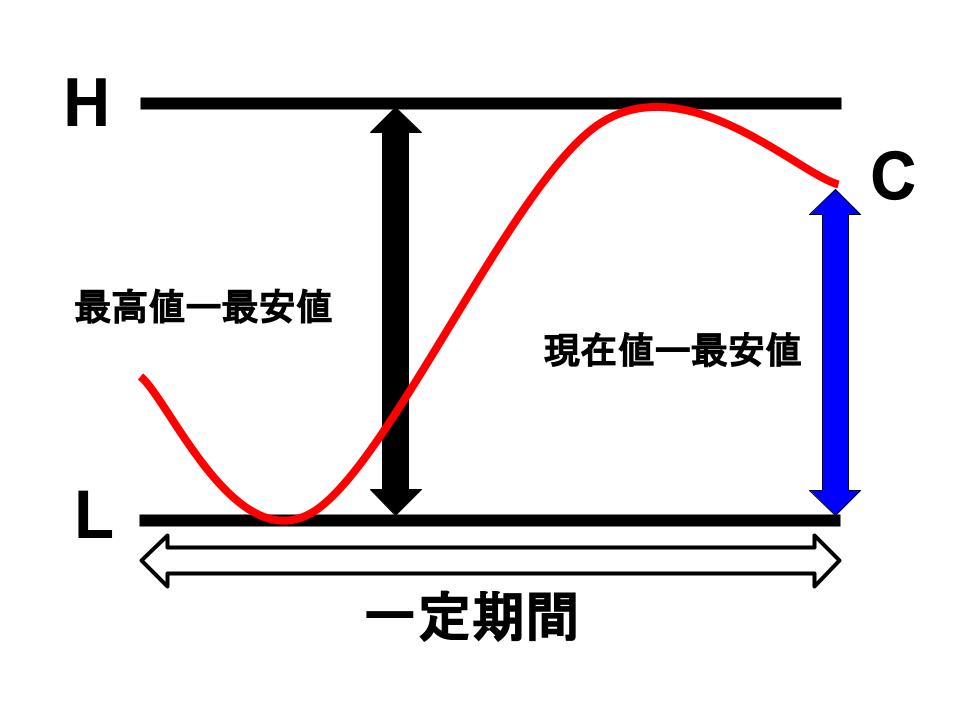
The definition of Stochastics is super simple!
Basically, when you normalize the range between the most recent high and low to 1, you ask where the price is positioned relative to the low as a percentage.
If the current price is the lowest price, %K is 0%; if it is the highest price, 100%; if exactly in the middle, 50%.
A common reason people say Stochastics cannot be used is that the period setting is extremely short.
MT4 defaults to
%K, %D, Slow %D = 5, 3, 3
.
Speaking only about %K, a period of 5 means the current position is within the five candles.
Naturally, with a short period, highs and lows change frequently, making analysis difficult.
Since highs and lows update often, it’s easy to reach 0% and 100%.
Therefore, if you use Stochastics, avoid making the %K parameter period extremely short.
Recommended is 26.
This also pairs well with the Ichimoku Cloud’s baseline..
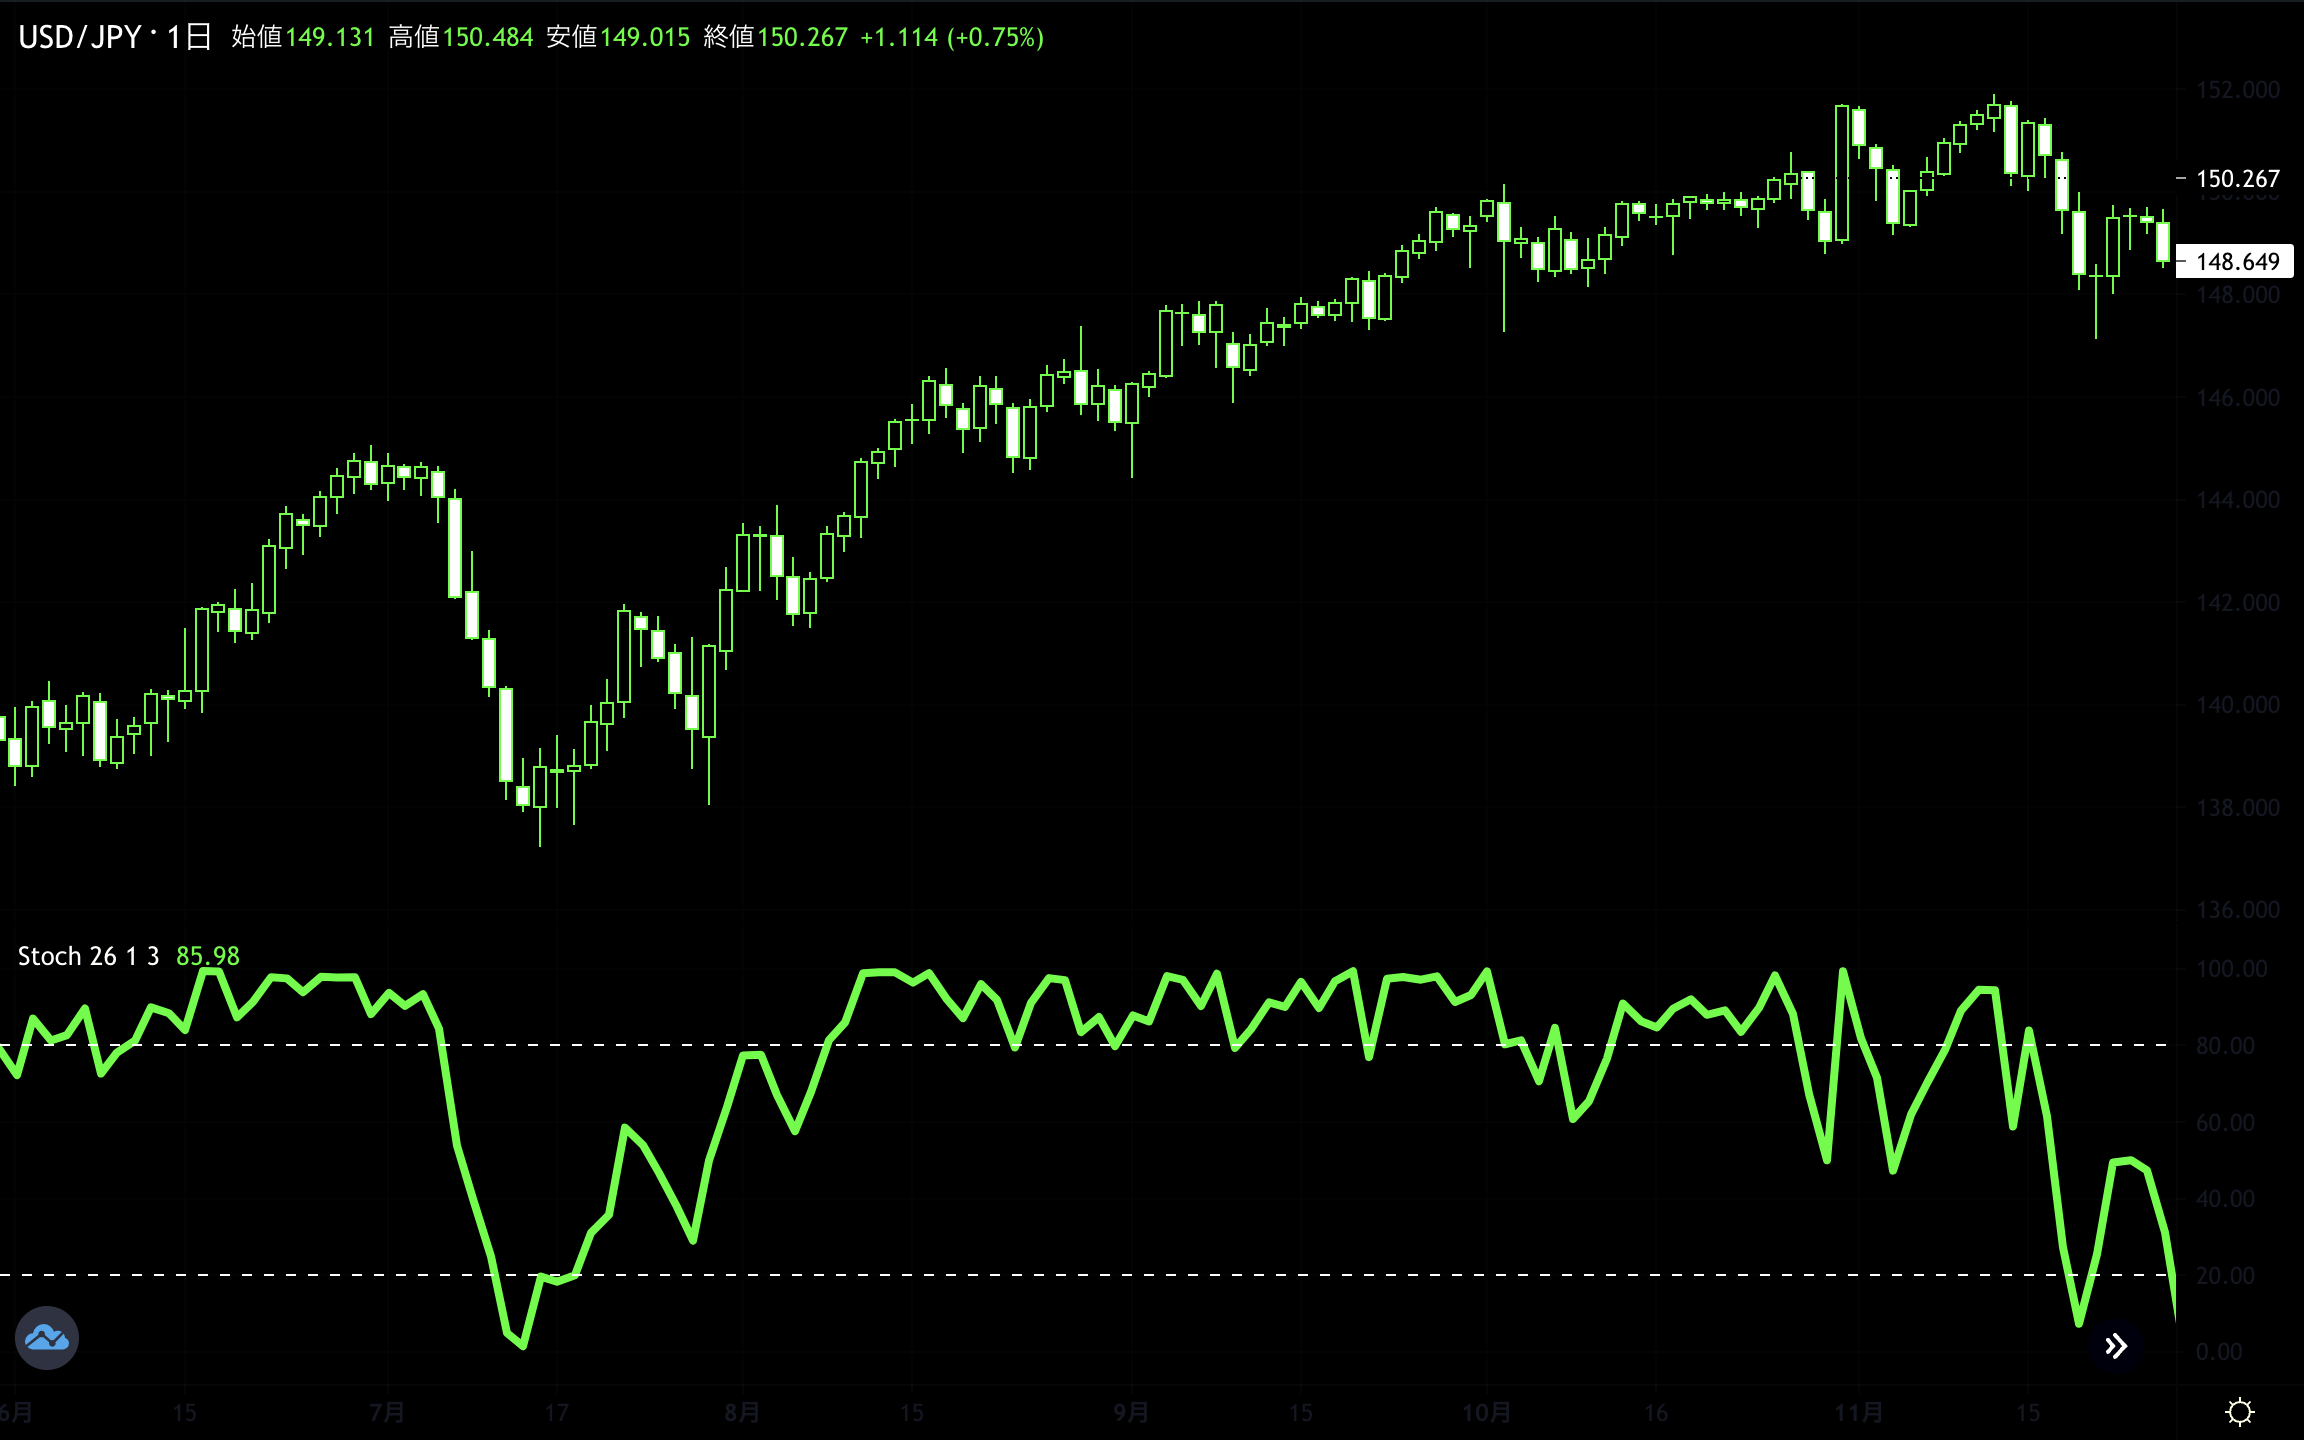
USD/JPY daily chart
%K’s period should be set somewhat longer; if you say 80% or more means overbought and you initiate a sell order, that would be problematic.
As can be understood from Stochastics’ definition, it represents relative price position over a certain period, so if the price is in an uptrend, it is natural for %K to reach 80% or higher.
Because an uptrend is defined by higher highs being made.
The fundamentally correct way to read Stochastics is
50% or higher favors the buyers
Below 50% favors the sellers
If it stays above 80%, it indicates a stable uptrend
If it stays below 20%, it indicates a stable downtrend
Next time, we will explain %K, %D, and Slow %D
The three lines of Stochastics