

Use of “Visual Indicators” (Part 138)
Utilization of the "Visualization Indicator" (that138)
1. Further evolve the "28 Currency Pairs List Indicator" into an indicator
“8CPVisualization Indicator”to drawNZDUSD.
There are versions of the “8 CP Visualization Indicator” for Oceania, London, New York, and AnyCP. This time, the Oceania version was used.
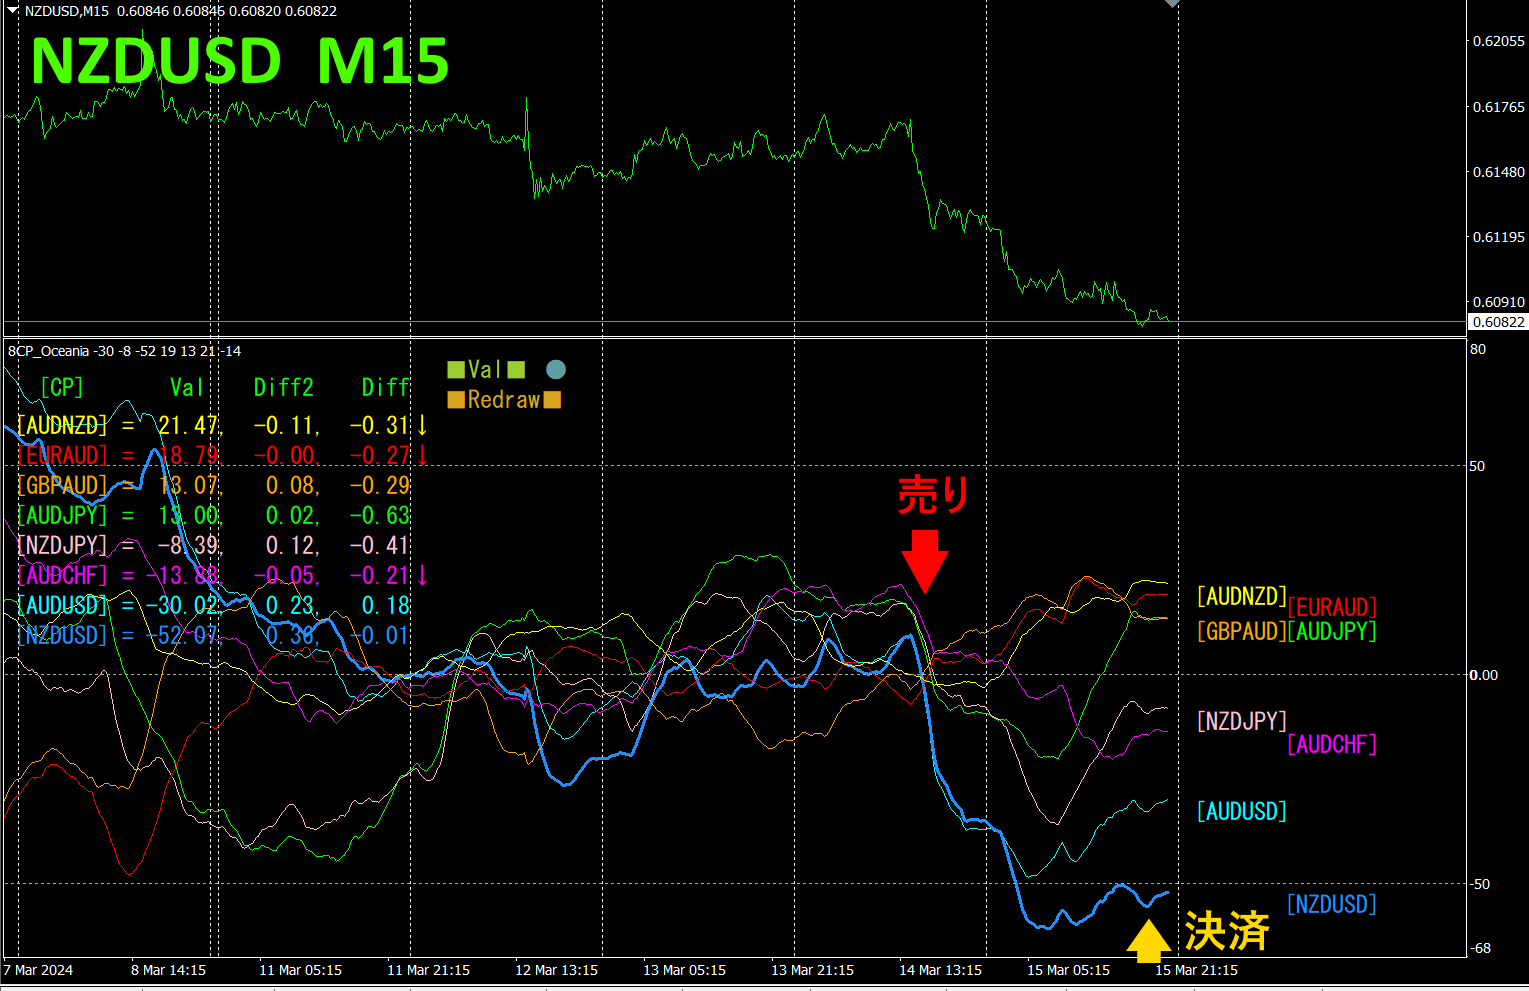
The top half is the 15-minute chart forNZDUSD. The bottom half shows the results from the “8 CP Visualization Indicator,” where the light blue bold line corresponds toNZDUSD.
On Thursday,NZDUSD fell below other charts and diverged, so I entered a sell. By week’s end, the profit was around approximately67 pips.profit.
With the “8 CP Visualization Indicator,” by simply paying attention to the movement of the most volatile currency pair, you can trade efficiently.
2. Best SelectTry the Indicator
The following diagram is a screenshot taken onMarch,2024 month15 date00:37JST ()
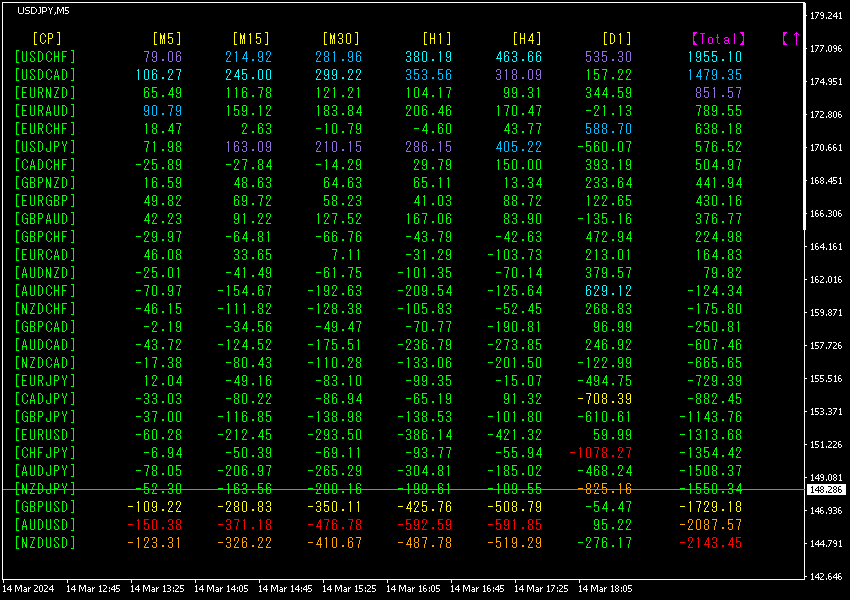
[Total]The numbers are ordered. From the bottom, the1stNZDUSDis red on all timeframes except[D1], and the total value is-2143.45, a large negative figure.is showing a downward trend.
Next, look at the chart ofNZDJPY.
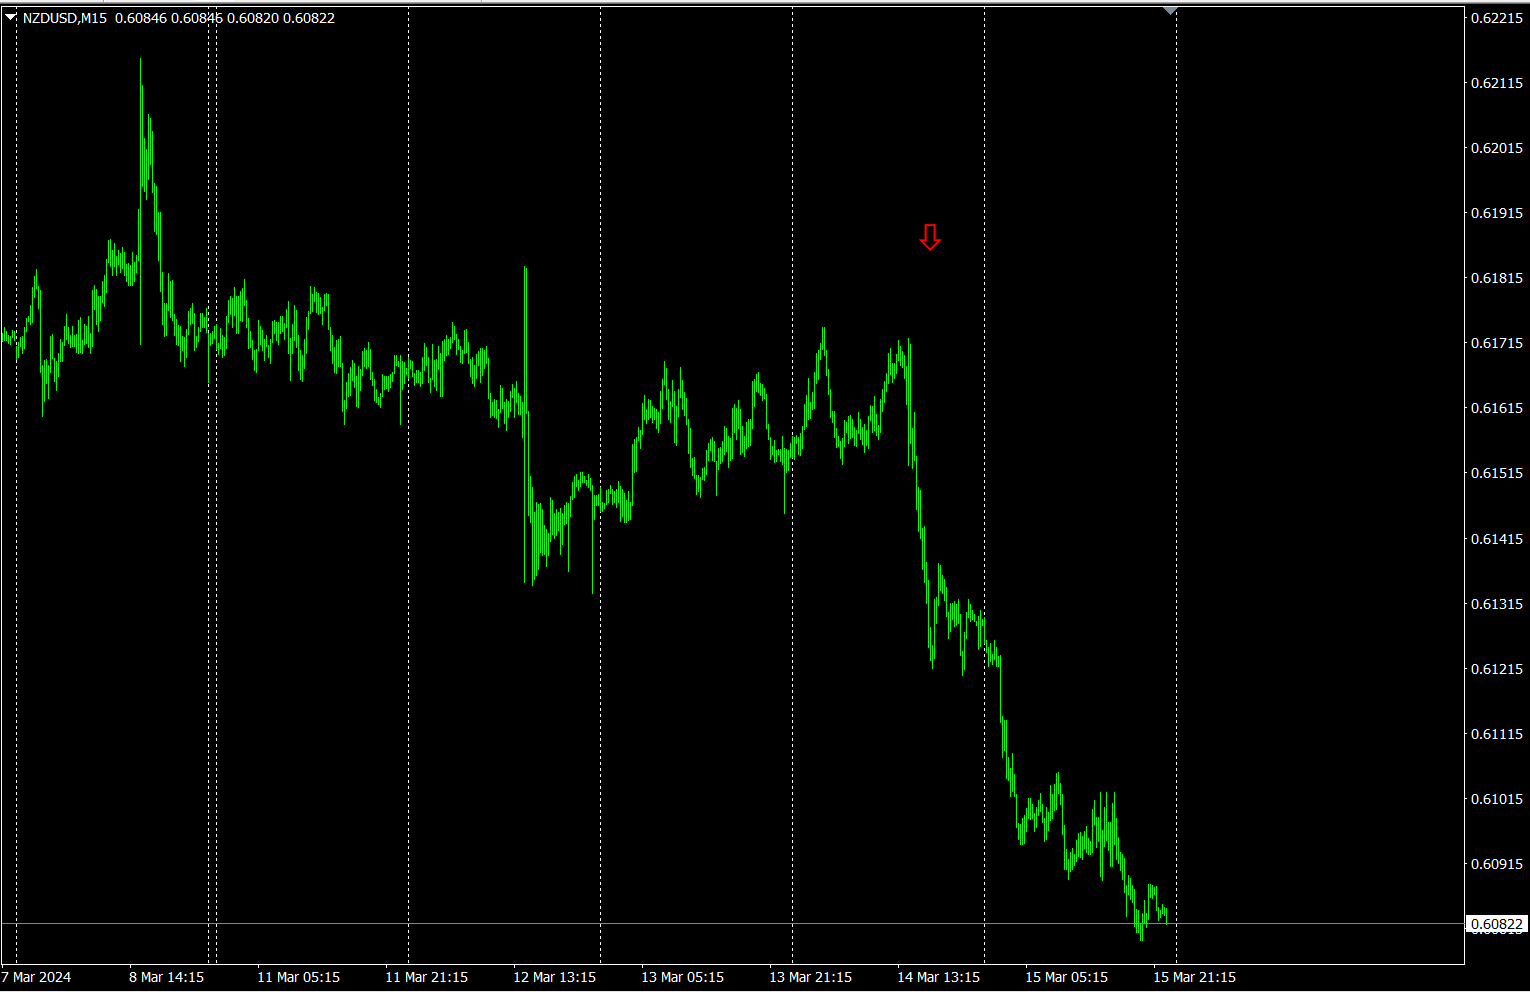
The red arrows indicate where the screenshot was taken, capturing a sharp drop.
“28 Currency PairsBest Select
“28 Currency PairsBest Select Indicator”
https://www.gogojungle.co.jp/tools/indicators/35128

3. 2021 year5 month, following the movement ofEURJPY, what happened?.
Since 2021 year5 month, we have been trackingEURJPY
To view the overall trend, I have drawn about the last weeks on a 30-minute chart.
Last time, it was written as follows.
JPY is above, has become stronger than. Therefore, will fall.
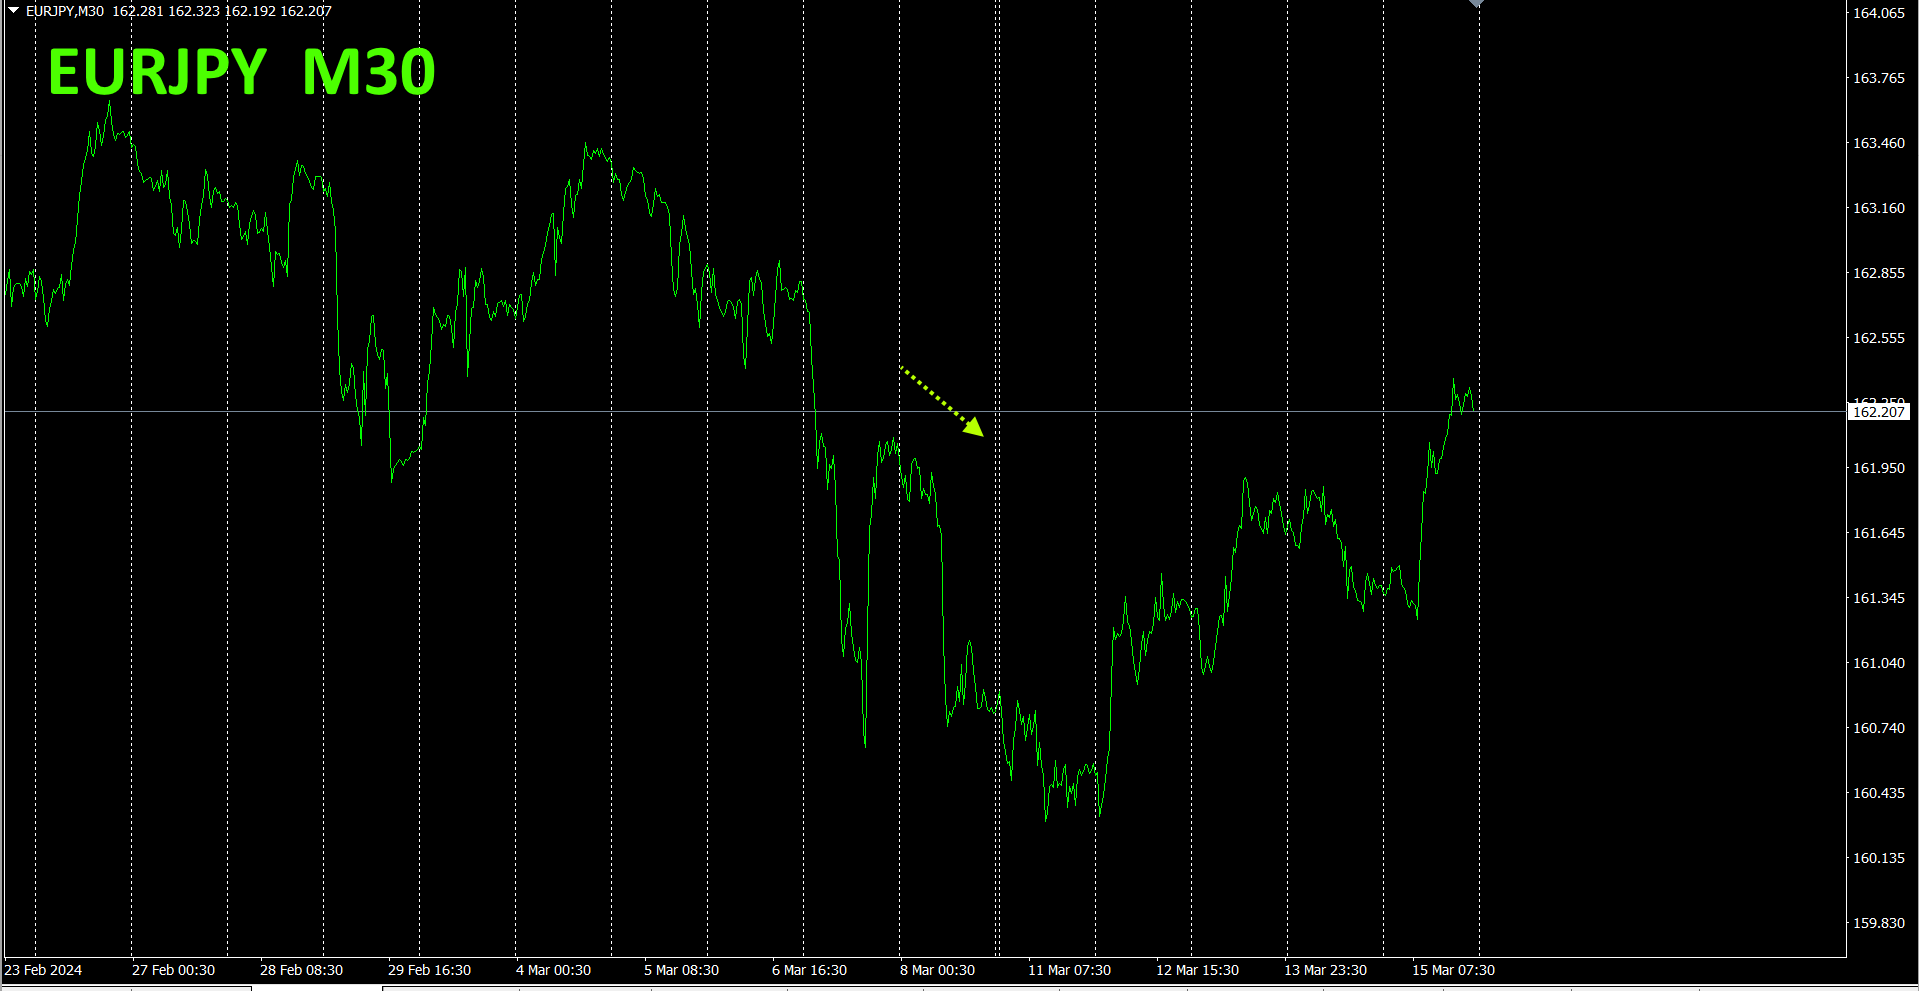
It dipped a little on Monday. Since then, it has risen.
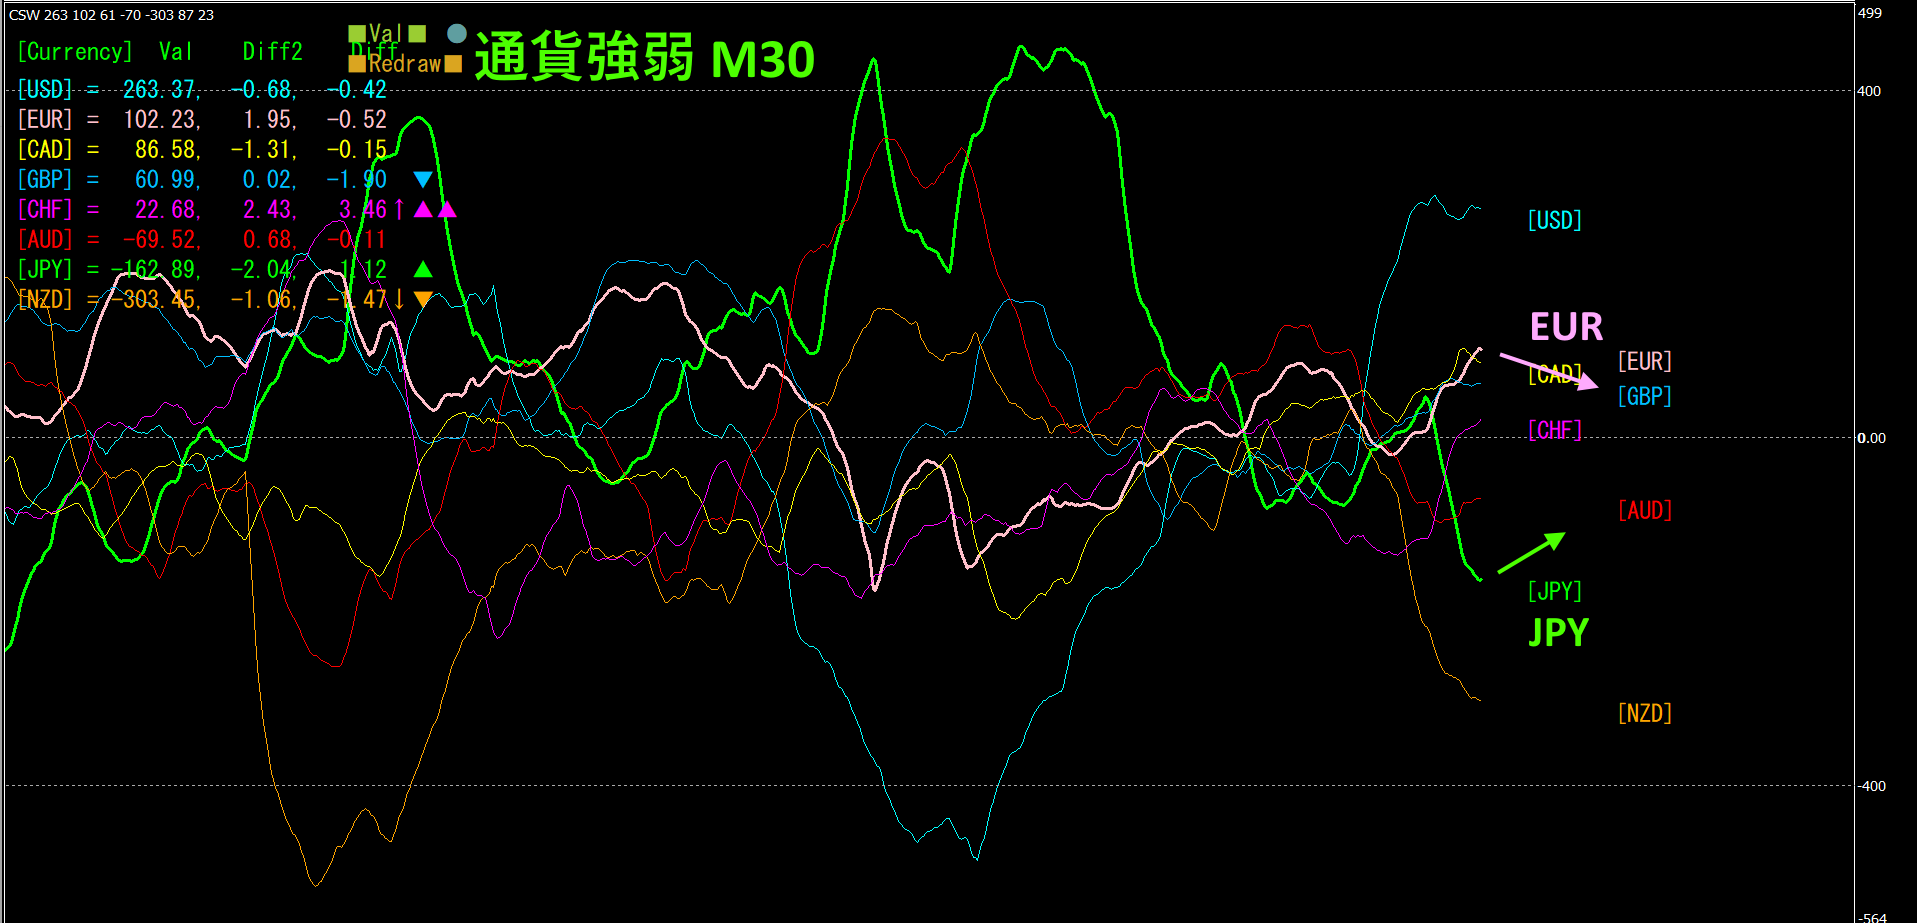
, the green representsJPY. is below. The direction suggests is moving up andEUREURJPY
4. Search the highs and lows across all currency pairs and develop a trend strategy (target:NZDCHF).
Using the 2505“Tops and BottomsSearch Indicator”, I selected the currency pair located at the bottom,NZDCHF. I am aiming for a rebound from the bottom.
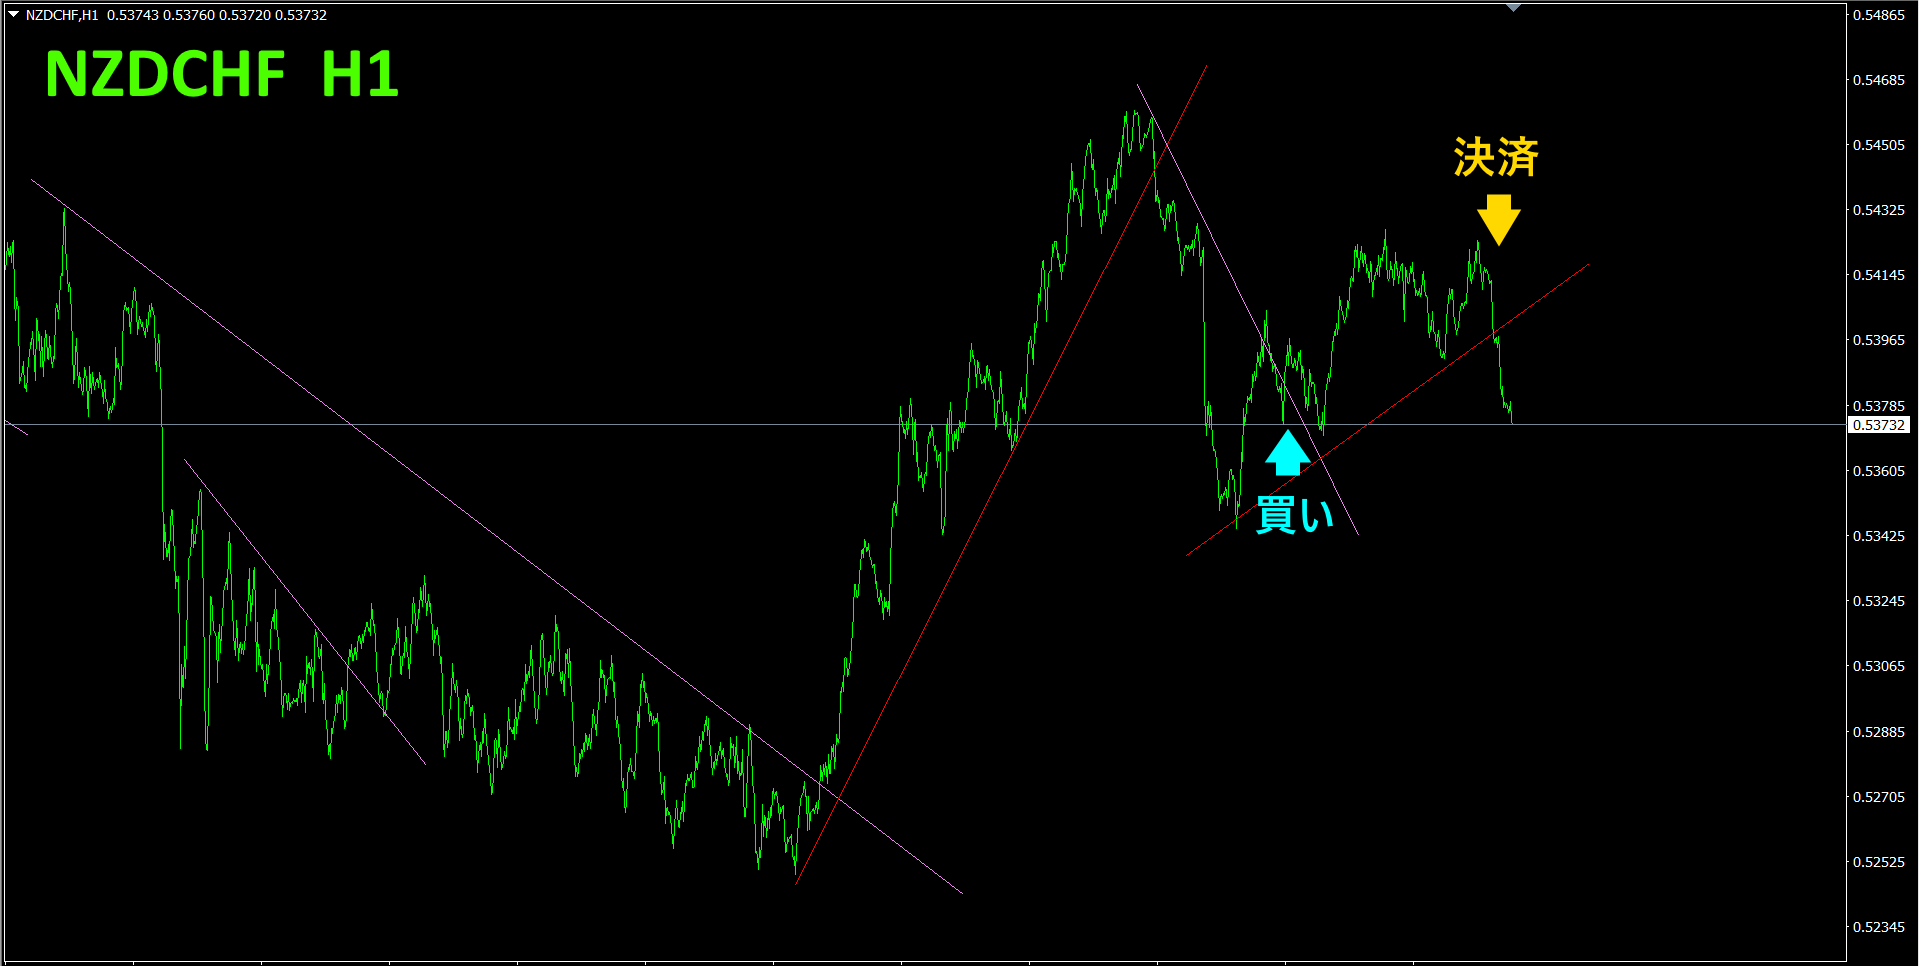
I broke above the descending line, opened a long position, but it did not move much upward and began to fall, so I closed it. It was a small profit, but not a loss, so acceptable.
Refer to the 4-hour currency strength chart.
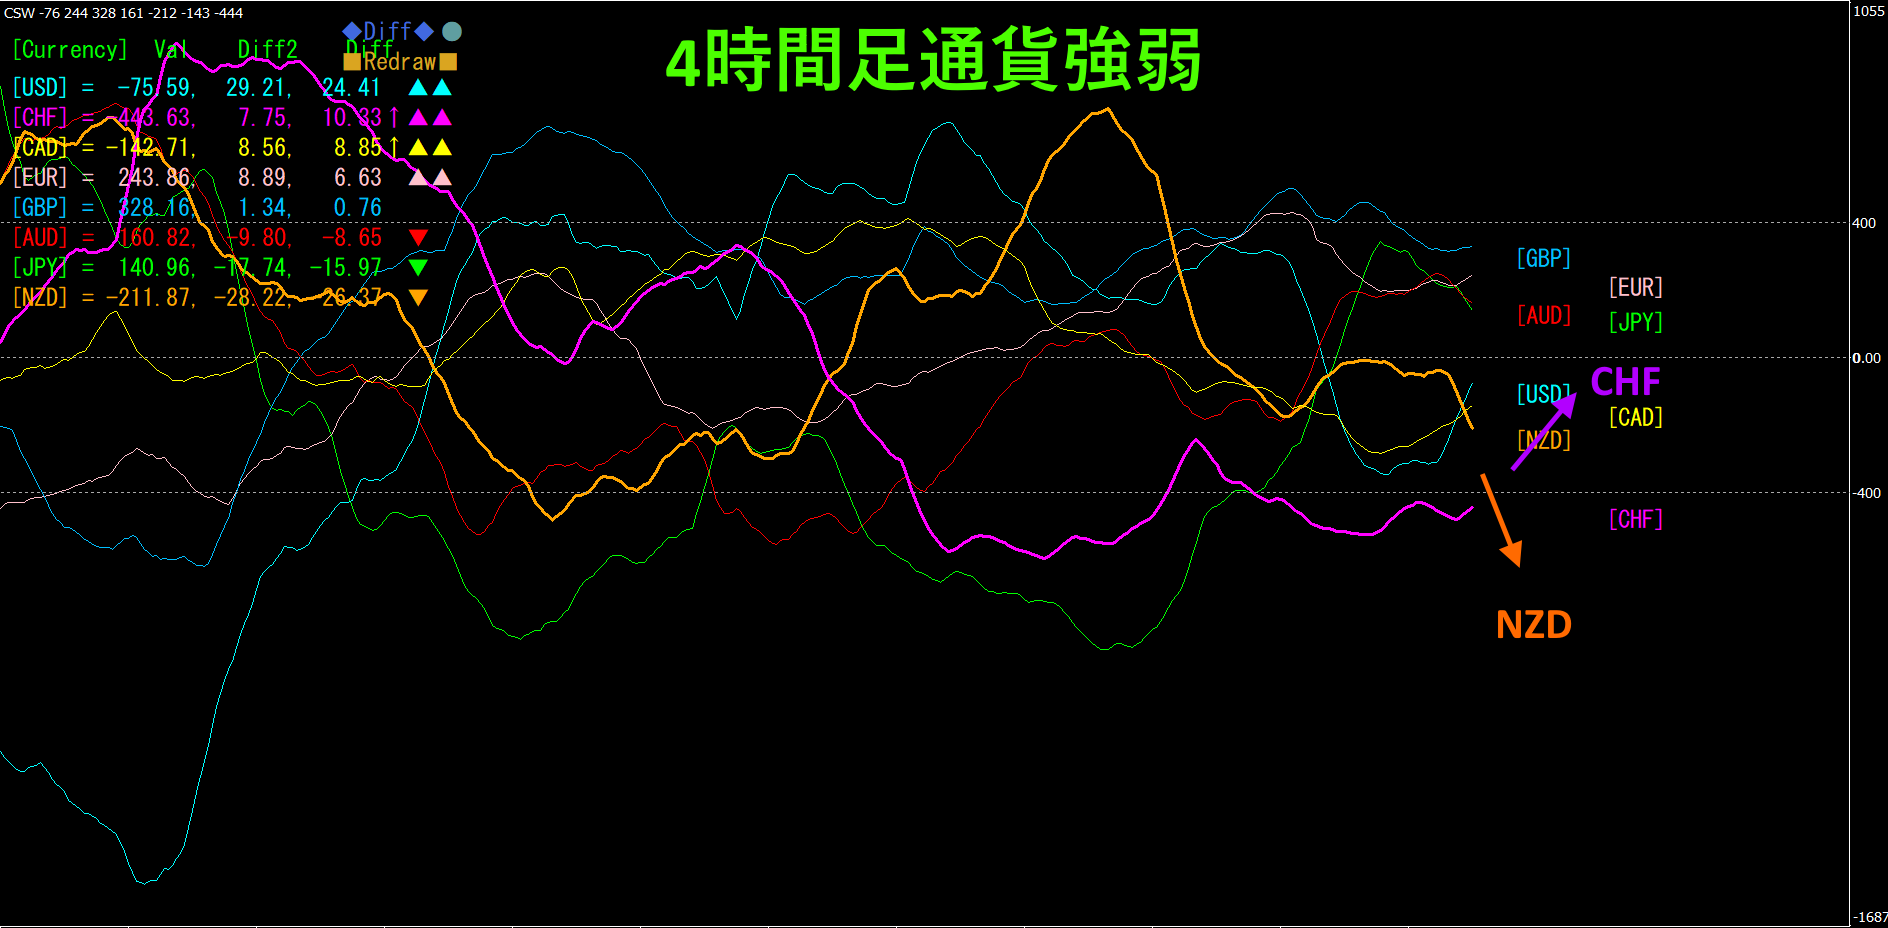
Red-purple isCHF, orange isNZD.NZD is up, so will fall.
By comparing normal FX charts with currency strength charts, the trend direction becomes clearly “visualized.”
With a semi-automatic EA, the “Trend Line EX” allows you to draw a descending diagonal line; when price breaks above it, it automatically buys, and when it breaks above the rising line, it automatically closes, enabling a passive trading approach.
“”

https://www.gogojungle.co.jp/tools/indicators/42257
If you are interested in the “8C Currency Strength Visualization Indicator,” please refer to the following pages.

MT4 version https://www.gogojungle.co.jp/tools/indicators/39150
MT5 version https://www.gogojungle.co.jp/tools/indicators/39159
【My products for sale】


