

[March 8, 2024] Backtesting using the Sky and Earth Indicators (Nikkei 225)
This time it's a verification of the Nikkei 225. Although the Nikkei 225 recently hit a record high and is currently below the 40,000 yen level, the chart of Ten to Chi (Heaven and Earth) suggests it may rise again. We will explain it together with the new oscillator that will be distributed soon, which features an accuracy level button.

・This article mainly uses「Heaven and Earth Indicator」 for historical verification.
・The content is built on the assumption of using the most accurate「15-minute + 4-hour simultaneous monitoring method」 within this tool.
・This tool is a revolutionary trading tool that can be used even if you do not understand the so-called FX theories (Elliott Wave, Dow Theory, Gartley, cycle theory, price action, Fibonacci, support/resistance, channels, etc.).
・The following links feature valuable DMs, reviews, and posts from users. We have精选 win reports and other useful content, so it will surely be helpful for everyone.
【Daily Updated】Search for “#Heaven and Earth Indicator”

Heaven and Earth Indicator is a trading method using an original indicator developed by me, A-Bu, released in February 2022. Thanks to everyone's support,「GogoJungle Award 2022, 2023 has been awarded for two consecutive years.
■Heaven and Earth Indicator
https://www.gogojungle.co.jp/tools/indicators/35780
■Heaven and Earth Indicator【MT5 Version】
https://www.gogojungle.co.jp/tools/indicators/47523
■Heaven and Earth Mountain
https://www.gogojungle.co.jp/tools/indicators/37744
■Heaven and Earth EA ~ Semi-Discretionary Auto-Trading System ~
https://www.gogojungle.co.jp/tools/indicators/43213
■Heaven and Earth Dashboard
https://www.gogojungle.co.jp/tools/indicators/46257
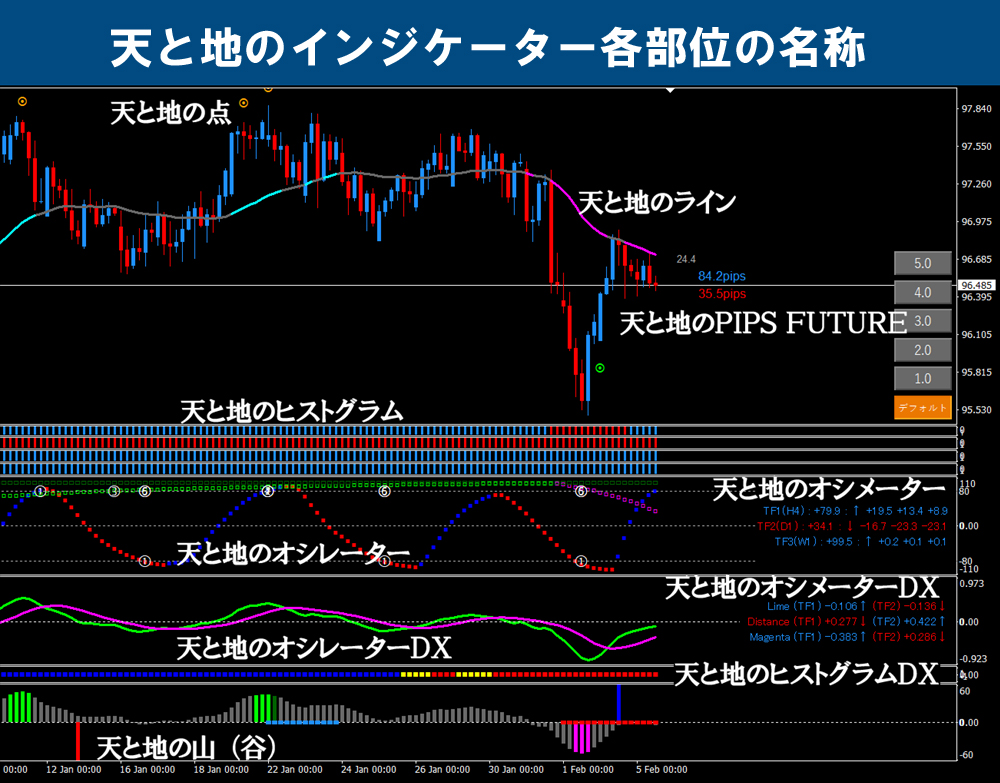
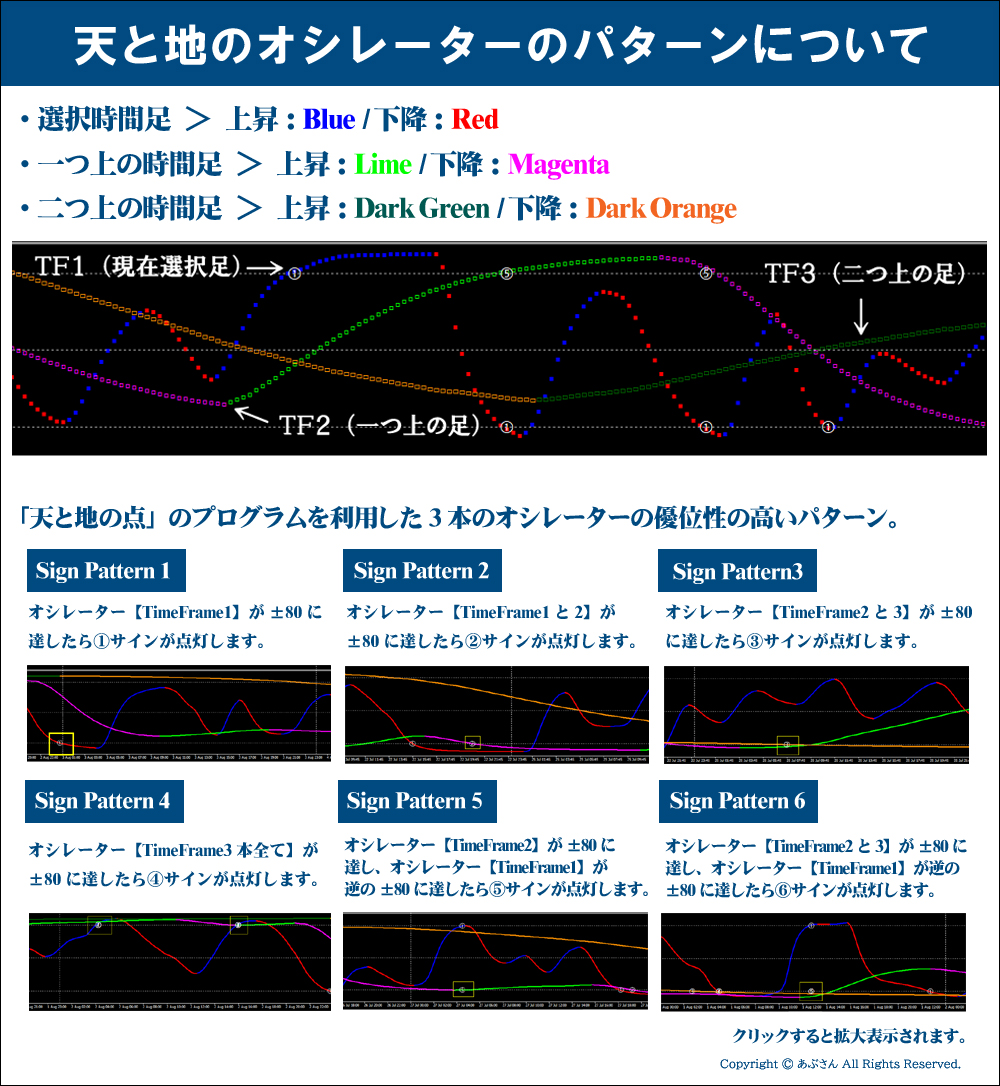
※For the technical terms used on this blog, please refer to the below “Names of the parts of Heaven and Earth Indicator” and “About The Patterns of Heaven and Earth Oscillator.” If you have further questions,please refer to the sales pageUsers who already have it can just read the manual, right?
Now, we will move on to the verification.
Thank you in advance!
※ All images can be enlarged by clicking.

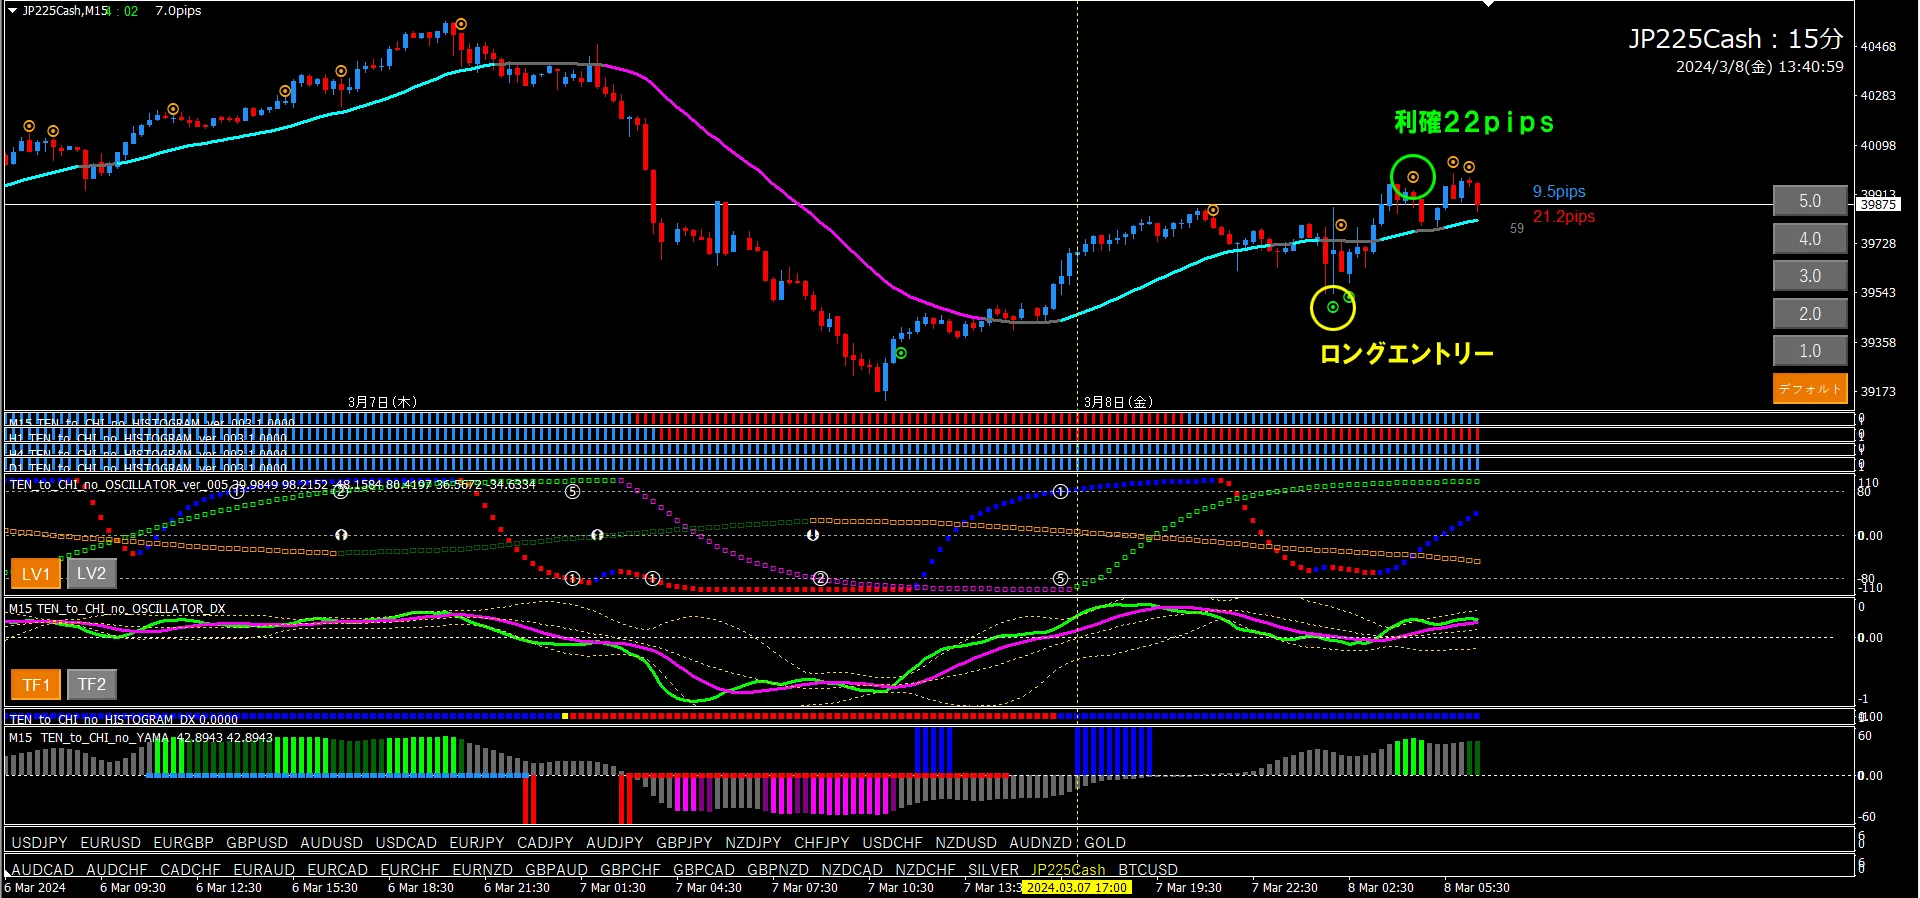
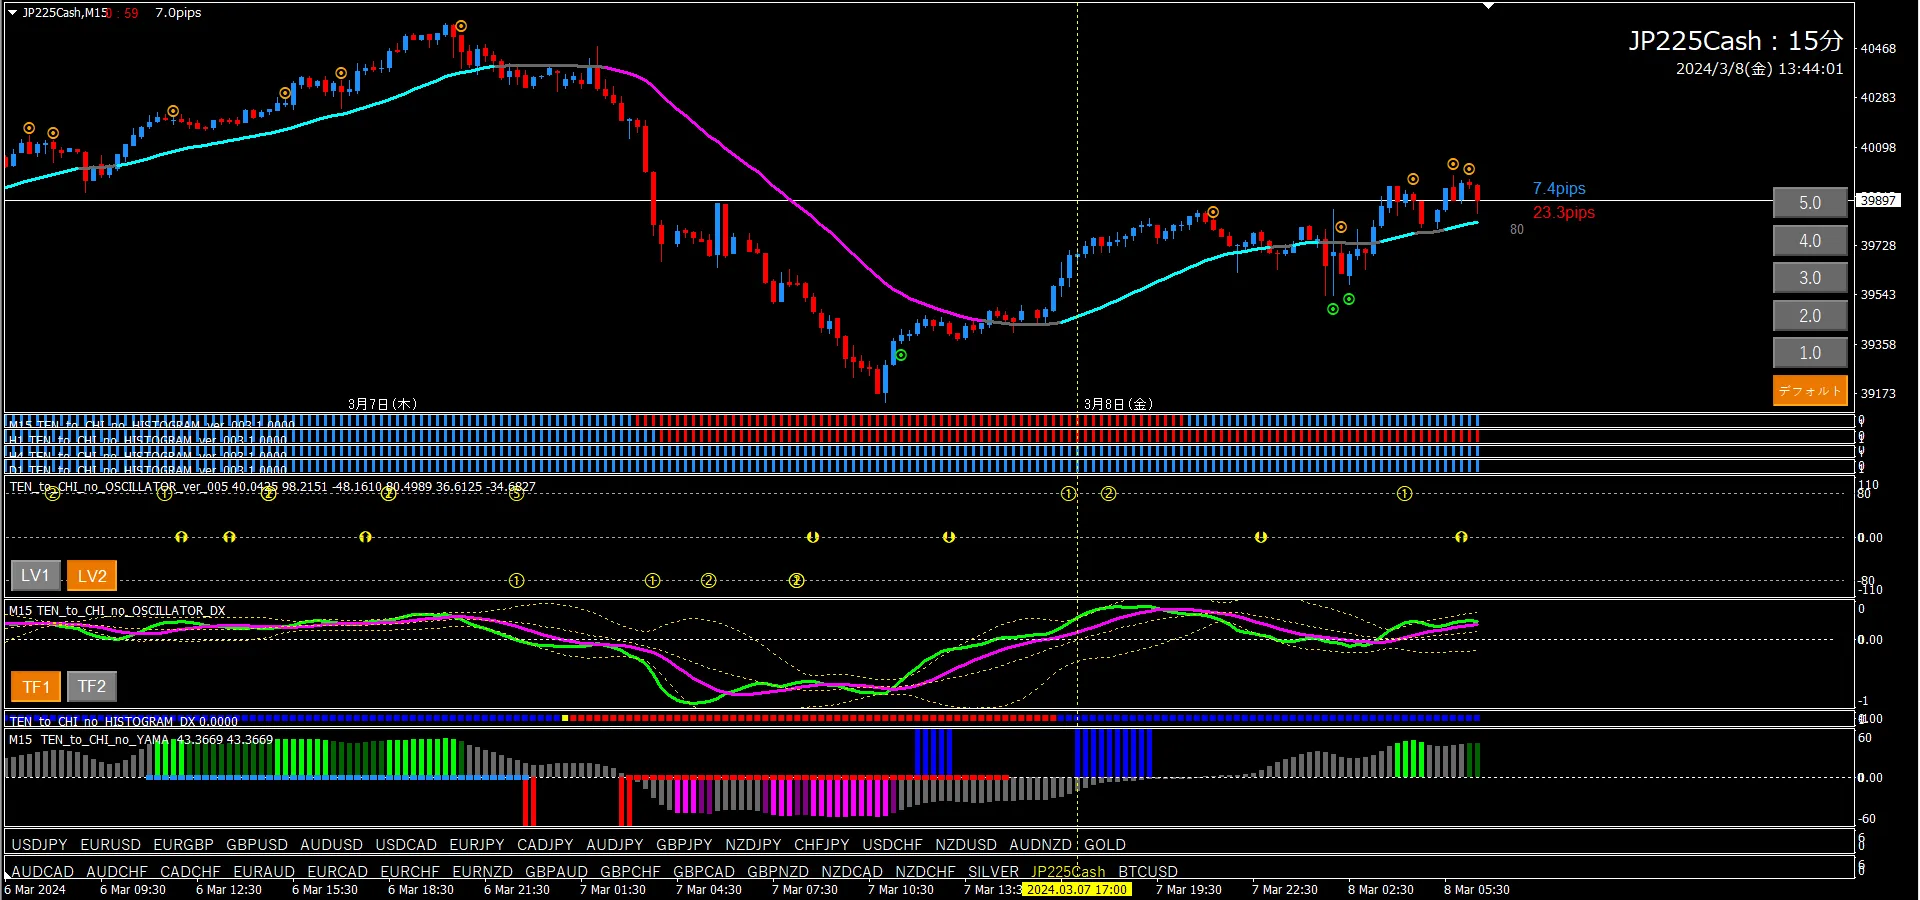
Nikkei 22515-minute + 4-hour past verification(From March 7, 2024 topresent)
※ Please note the yellow vertical line. A yellow vertical line is also present at the same location on the 15-minute chart. (Using the LINK LINE)
■4-hour chart (environment recognition)
The yellow vertical line marks a place judged as bullish.
Oscillator TF2 is rising; long entry signal is present, histogram fully blue, and this can be judged as bullish.
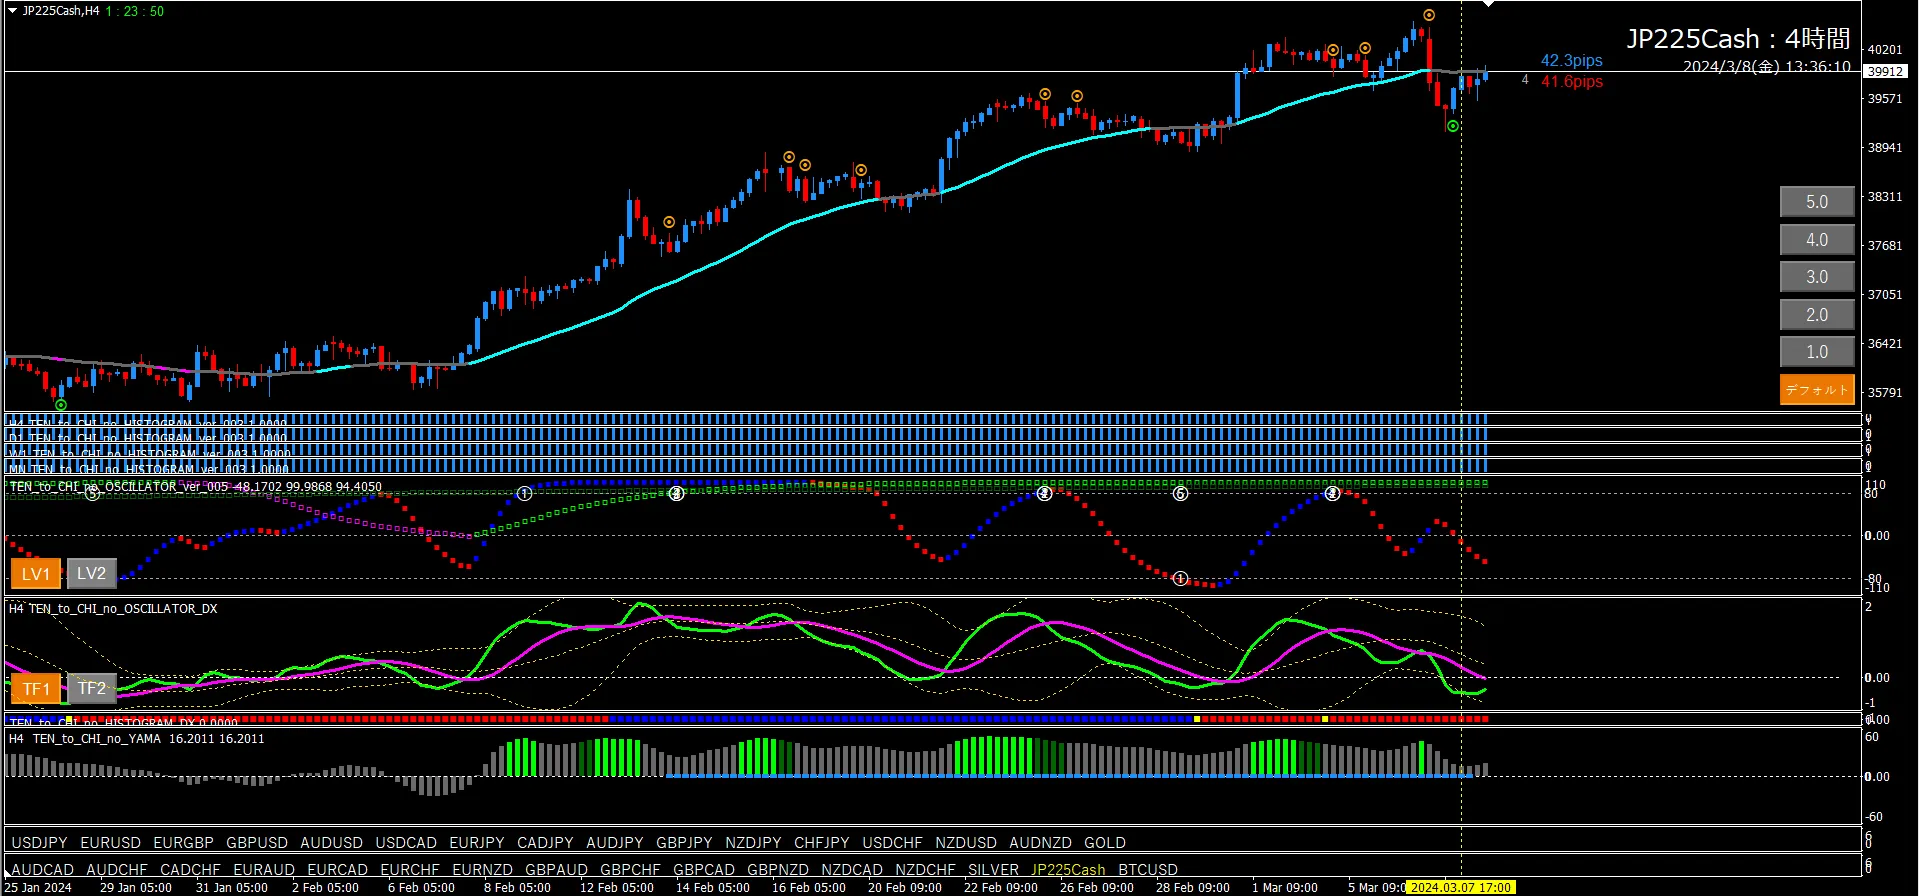
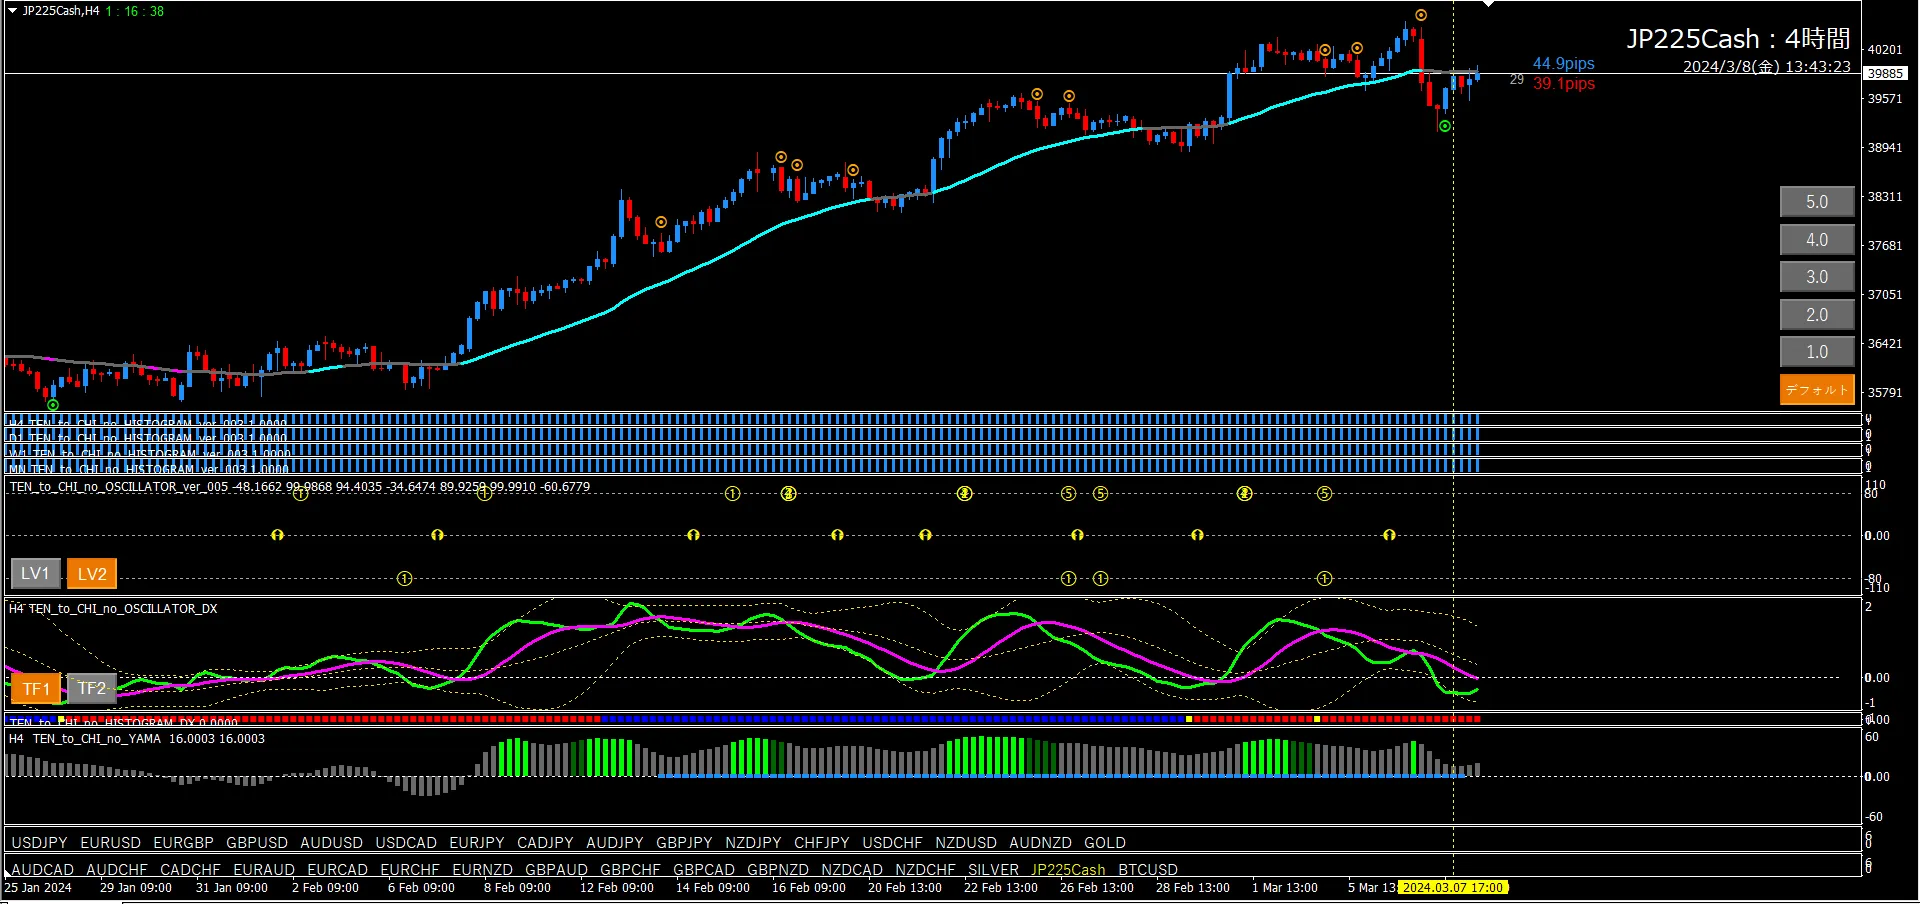
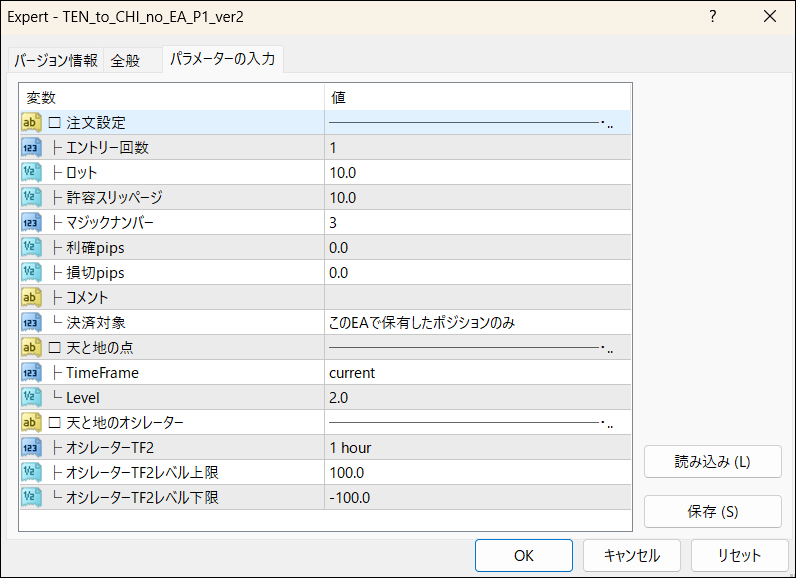
Bullish confirmation → confirm Oscillator TF2 rise → set EA Pattern 1. This is the basic approach.
If the valley signal lights up or Oscillator Signal ⑤ is confirmed, then use EA Pattern 2 or 4 at that time.

That’s all.
I hope this has been helpful for everyone.
