

【March 4, 2024】Backtest using the Heaven and Earth Indicator (EUR/USD)
This time it is a test of the Euro-Dollar (EUR/USD). Since the 4-hour oscillator TF2 has been rising cleanly from -80, this currency pair was being targeted as a candidate for an upside bias. In last week'sconsideration article as well, it was listed as a candidate.

・This article mainly focuses on a backtest using the "Heaven and Earth Indicators."
・The content is structured on the premise of using the highly accurate「15-minute + 4-hour simultaneous monitoring method」 within this tool.
・This tool is a breakthrough trading tool that can be used without understanding any of the so-called FX theories (Elliott Wave, Dow Theory, Gann's method, cycle theory, price action, Fibonacci, support/resistance, channels, etc.).
・In the articles linked below, we introduce valuable DMs, reviews, posts from users. We select winning reports and other useful DMs, so we are sure it will be helpful to everyone.
【Updated daily】 Search result for "#HeavenAndEarthIndicator"

The Heaven and Earth Indicator is a trading method using my original indicator, released in February 2022, developed by me, Abusan. Thanks to everyone's support“GogoJungle Award 2022, 2023 was awarded for two consecutive years.
■ Heaven and Earth Indicator
https://www.gogojungle.co.jp/tools/indicators/35780
■ Heaven and Earth Indicator【MT5 version】
https://www.gogojungle.co.jp/tools/indicators/47523
■ Heaven and Earth Peaks
https://www.gogojungle.co.jp/tools/indicators/37744
■ Heaven and Earth EA ~ Semi-Discretionary Auto-Trading System ~
https://www.gogojungle.co.jp/tools/indicators/43213
■ Heaven and Earth Dashboard
■https://www.gogojungle.co.jp/tools/indicators/46257
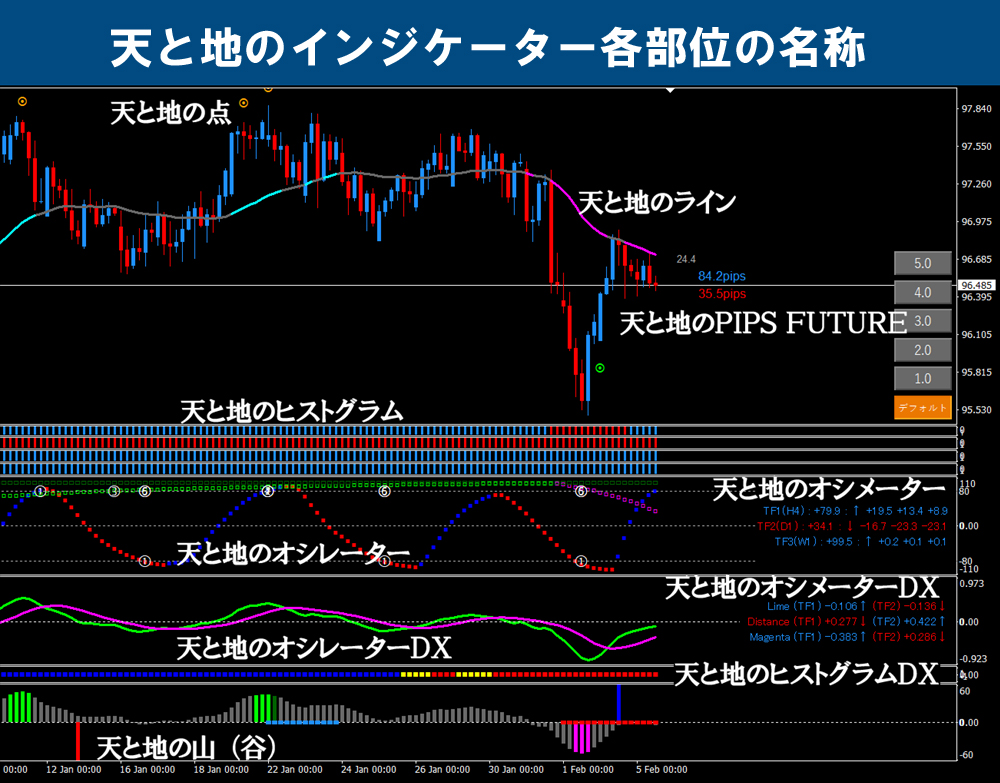
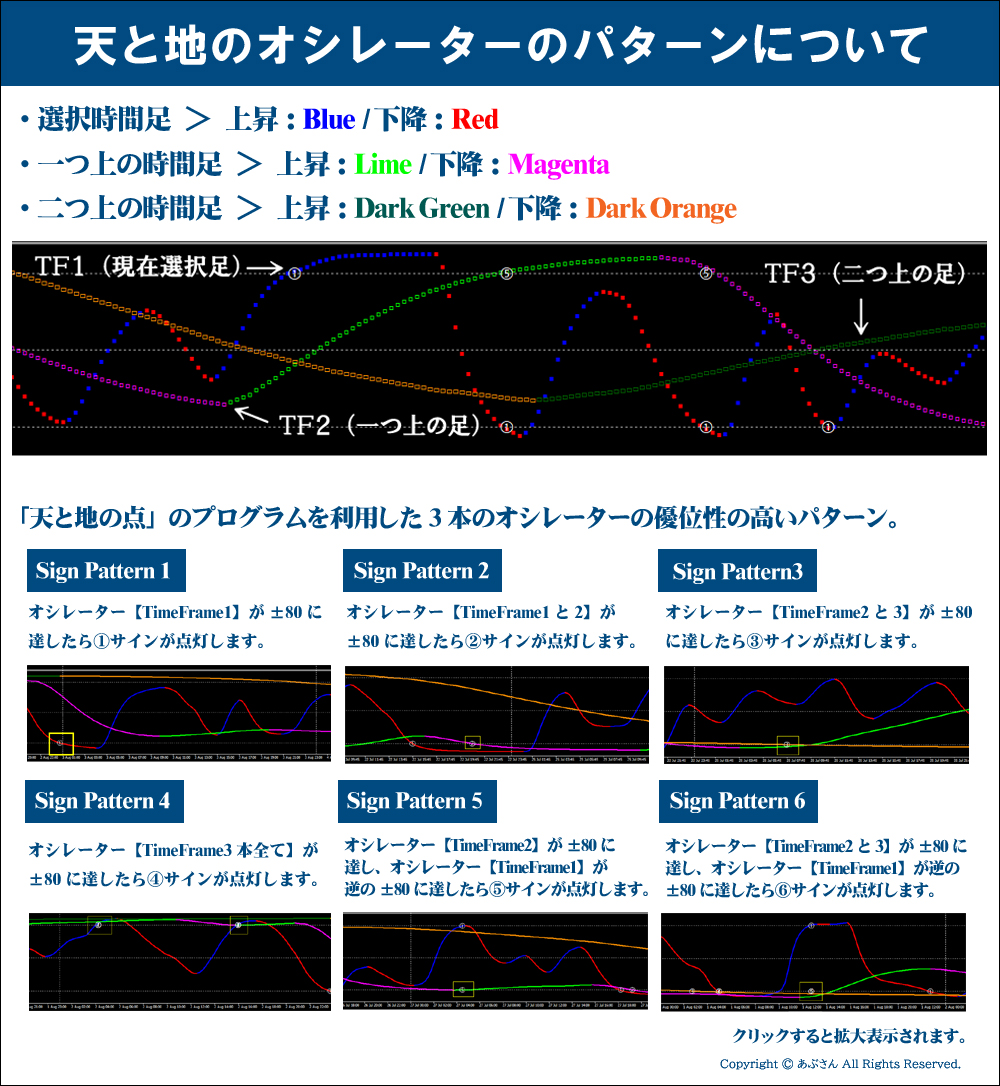
※ Regarding the specialized terms used on this blog, please refer to the following "Names of the parts of Heaven and Earth Indicator" and "Heaven and Earth Oscillator patterns." If you have any other questions, please refer to the Heaven and Earth Indicator sales page Users already know this if they read the instruction manual.
Now, I will move on to the verification.
Thank you in advance!
※ All images can be enlarged by clicking.

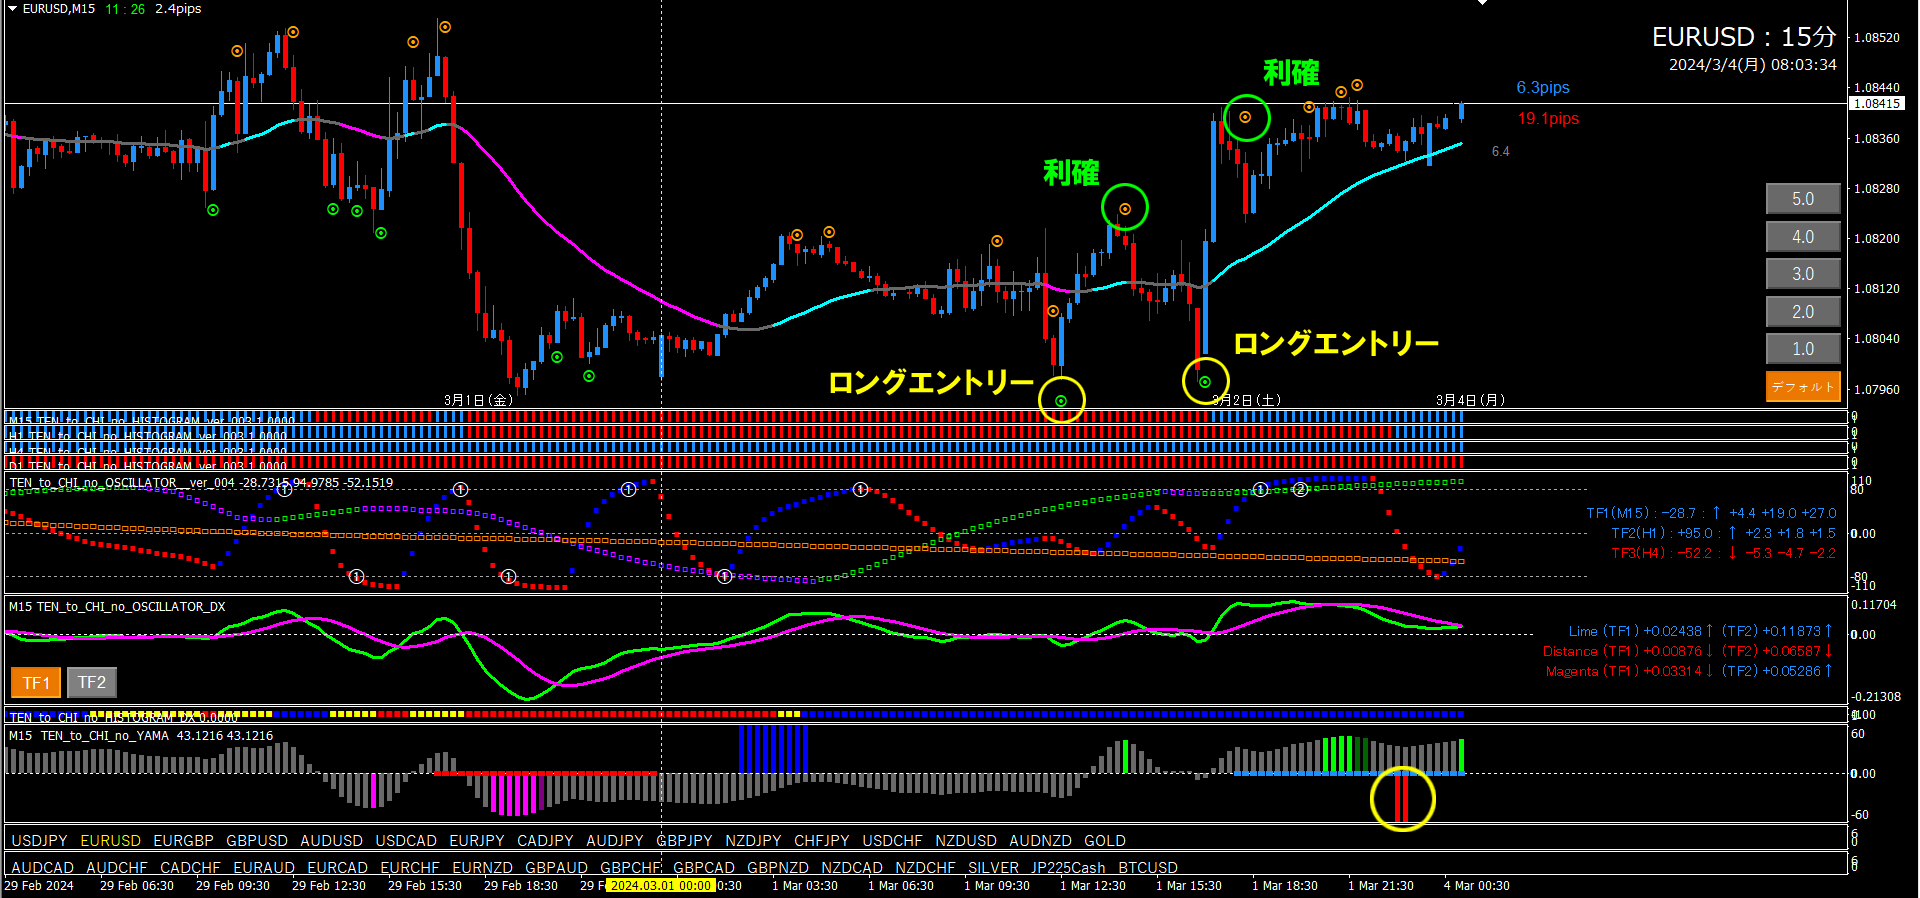
EUR/USD15-minute chart + 4-hour chart Backtest(March 1, 2024 ~Present)
※ Please look at the yellow vertical line. There is a yellow vertical line at the same position on the 15-minute chart as well. (Using the LINK LINE)
■ 4-hour chart (Environmental recognition)
The yellow vertical line marks the decided upside bias.
Oscillator TF2 is rising, long entry signal, histogram blue, histogram DX blue; this is where we determine an upside bias. At this time, the Distance of Oscillator DX was also down, which was fine.
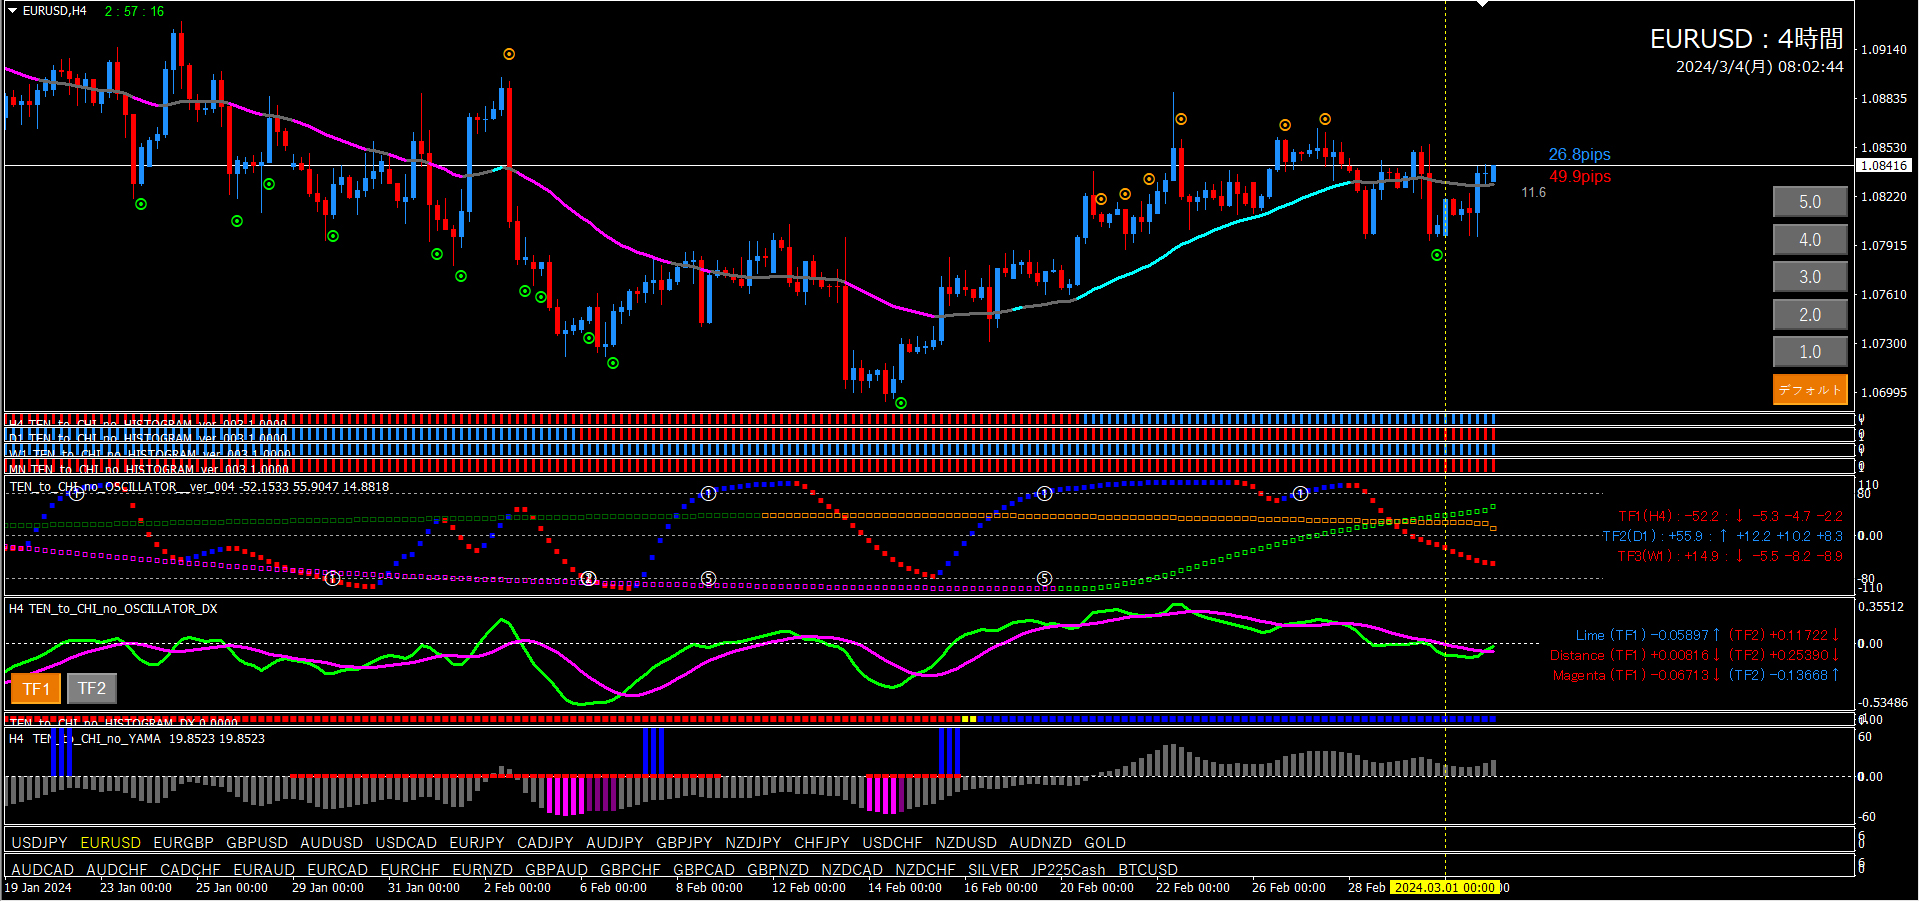
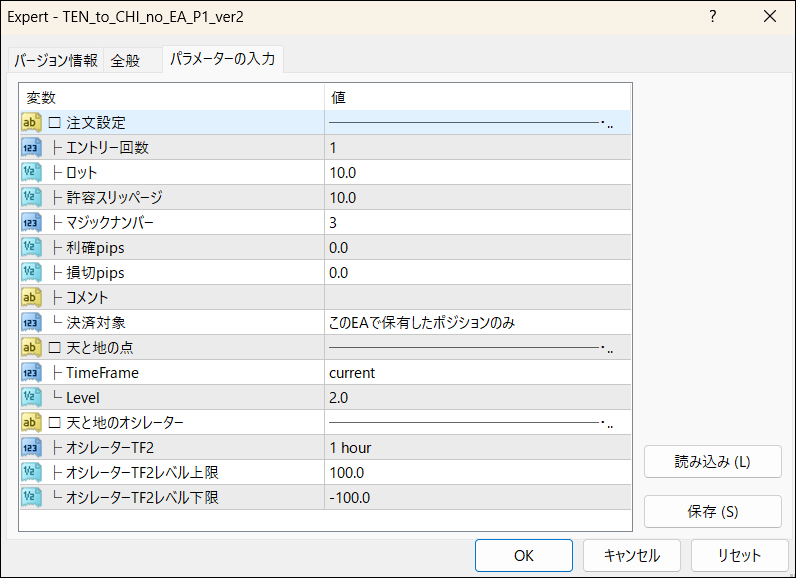
Once the upside bias is determined → confirm Oscillator TF2 rising → set EA Pattern ①. This is the basic approach.
If a valley light is confirmed or Oscillator Signal ⑤ is confirmed, then use EA Pattern ② or ④ at that time.

That is all.
I hope this will be of some help to everyone.
