

Use of the "visualization indicator" (Part 136)
“Visualization Indicator” usage (part136)”
1. Further evolve the “28 Currency Pairs List Indicator” into an indicator
“8CPVisualization Indicator”to drawNZDUSD.
The “8CPVisualization Indicator”Oceania版,LondonNewYork版,AnyCP版があります。今回は、Oceania版を使いました。
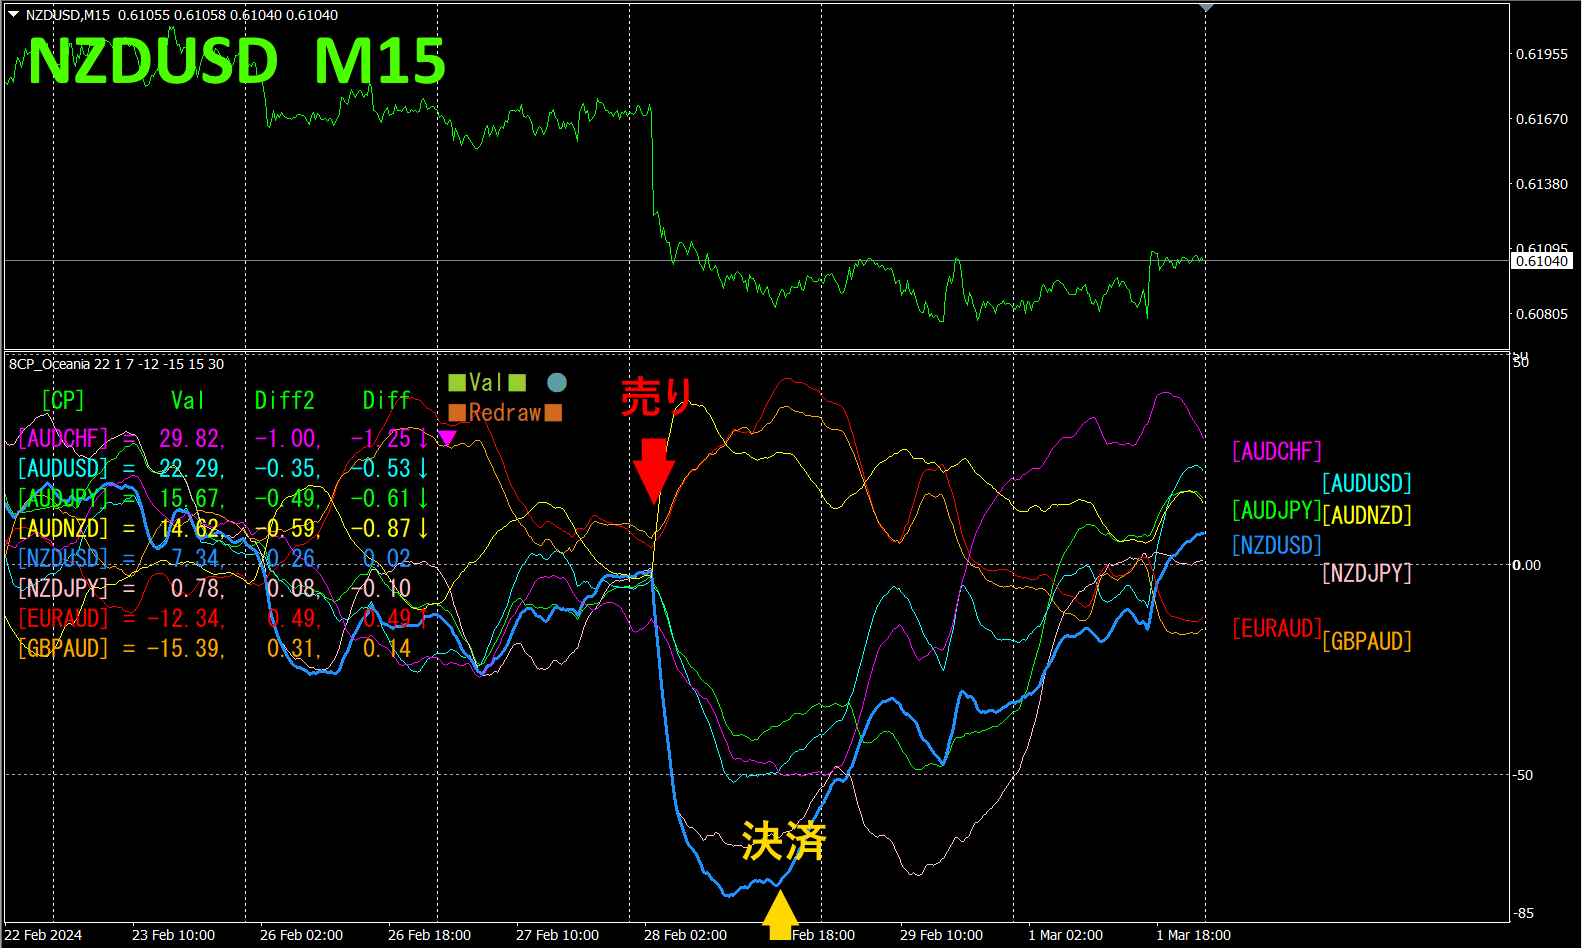
The upper half shows theNZDUSD 15-minute chart. The lower half is from the “8CPVisualization Indicator”; the light blue thick line graph corresponds toNZDUSD.
On Wednesday,NZDUSD fell below the other graphs and diverged, so I entered a sell. It settled on the day for a profit of around60pips..
With the “8CPCPVisualization Indicator,” you can focus on the most volatile currency pair to trade efficiently.
2. Best Selectindicator usage
The below figure is a screenshot taken onFebruary,2024,the28th, (JST).
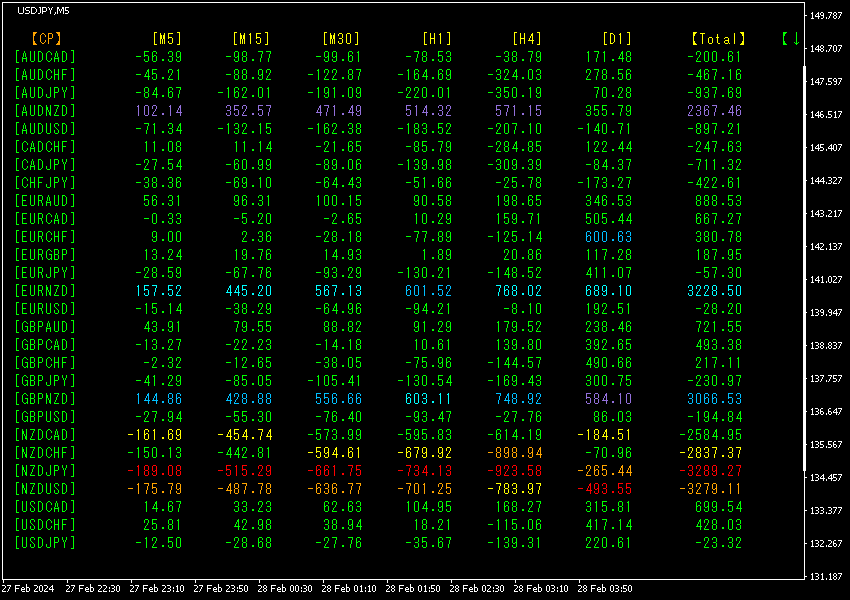
Currencies are arranged in name order. The fifth from the bottom,5thNZDJPY shows red hues across all timeframes, and the Total value is-3289.27, a large negative figure, indicating a strong downtrend for NZDJPY.NZDJPY indicates a strong downward trend.
Now, let’s look at theNZDJPY chart.
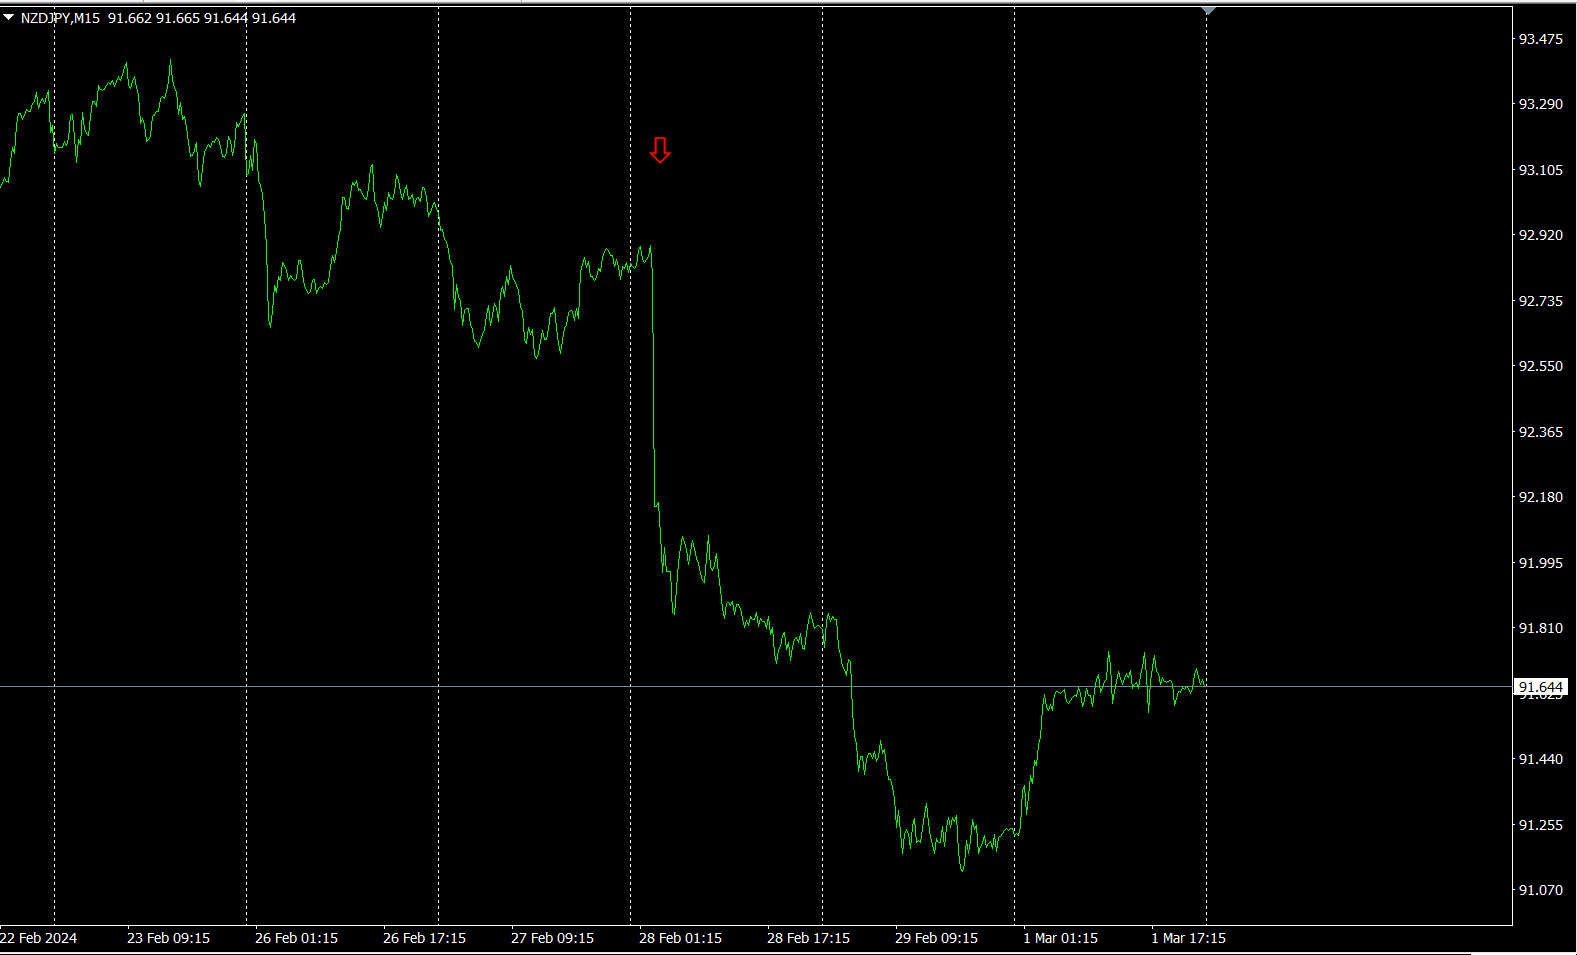
The red arrows mark where the screenshot was taken, capturing a steep decline.
“28 currency pairsBest Select indicator” allows you to easily identify which currency pair among 28 is currently showing the strongest trend. It also tells you, with numbers and colors, whether you should trade now. It’s an excellent indicator to assess all currency pairs at a glance.
“28 currency pairsBest Select indicator”
https://www.gogojungle.co.jp/tools/indicators/35128

3. 2021 year5 month to presentEURJPY trend?
Since May 2021, movements have been tracked.
To view the overall trend, a30-minute chart covering roughly the last3 weeks is drawn.
Previously, I wrote the following.
JPY and are almost horizontal. With no clear direction, it’s hard to gauge the trend.
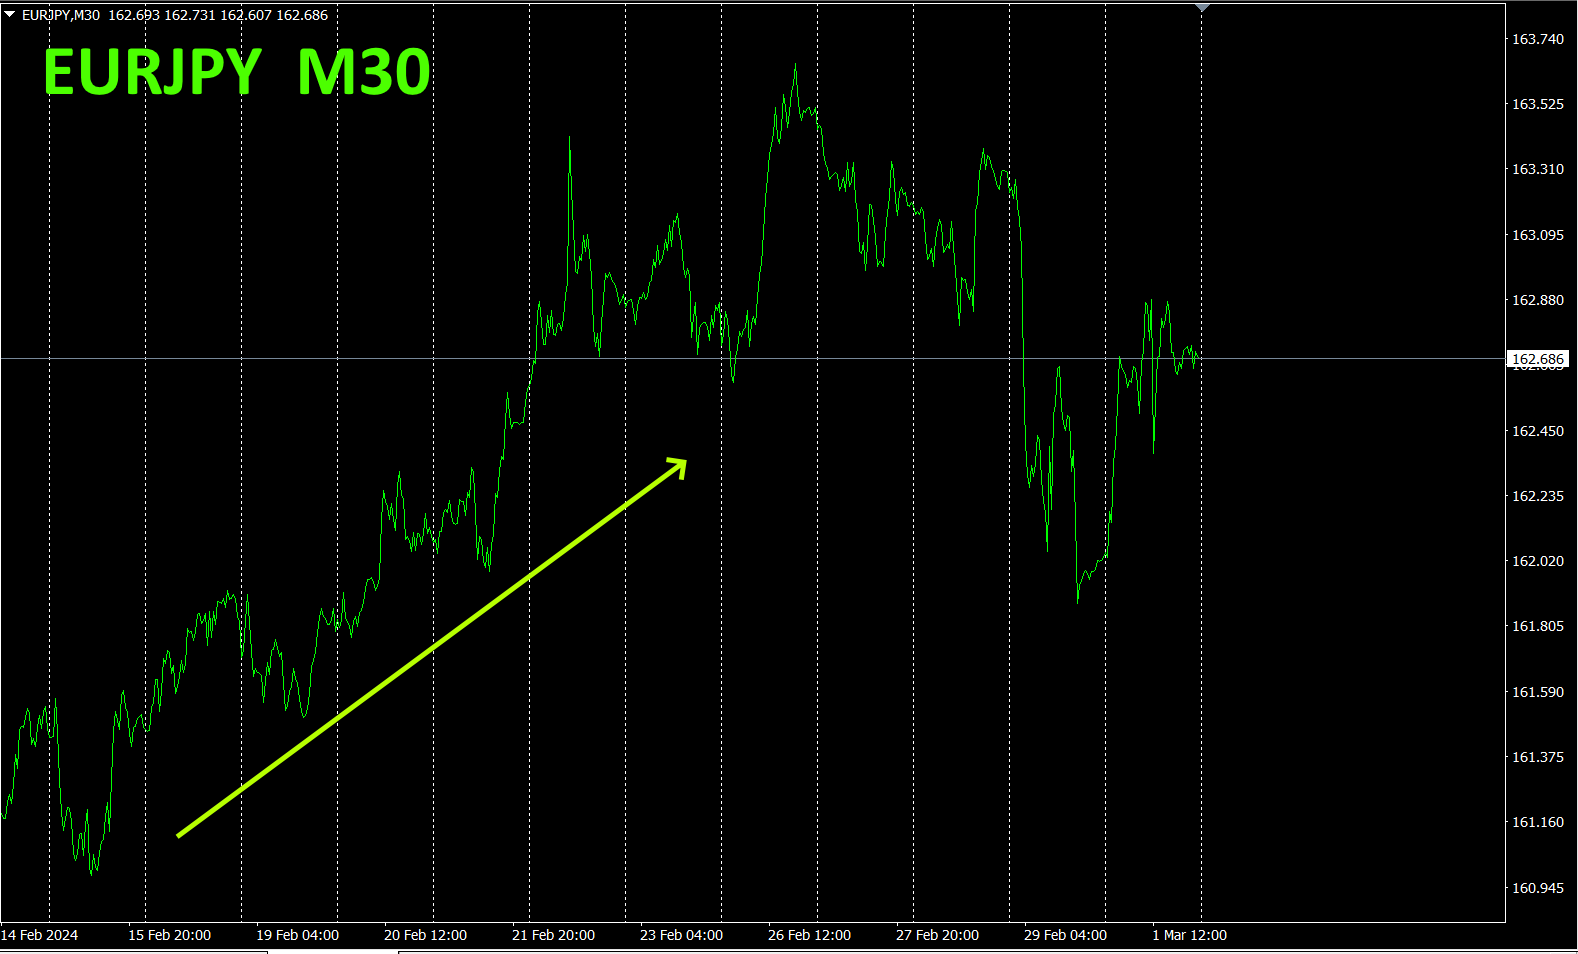
So far, the advancing trend appears to have been capped at the highs and is moving into a range.
The 30-minute currency strength chart shows.
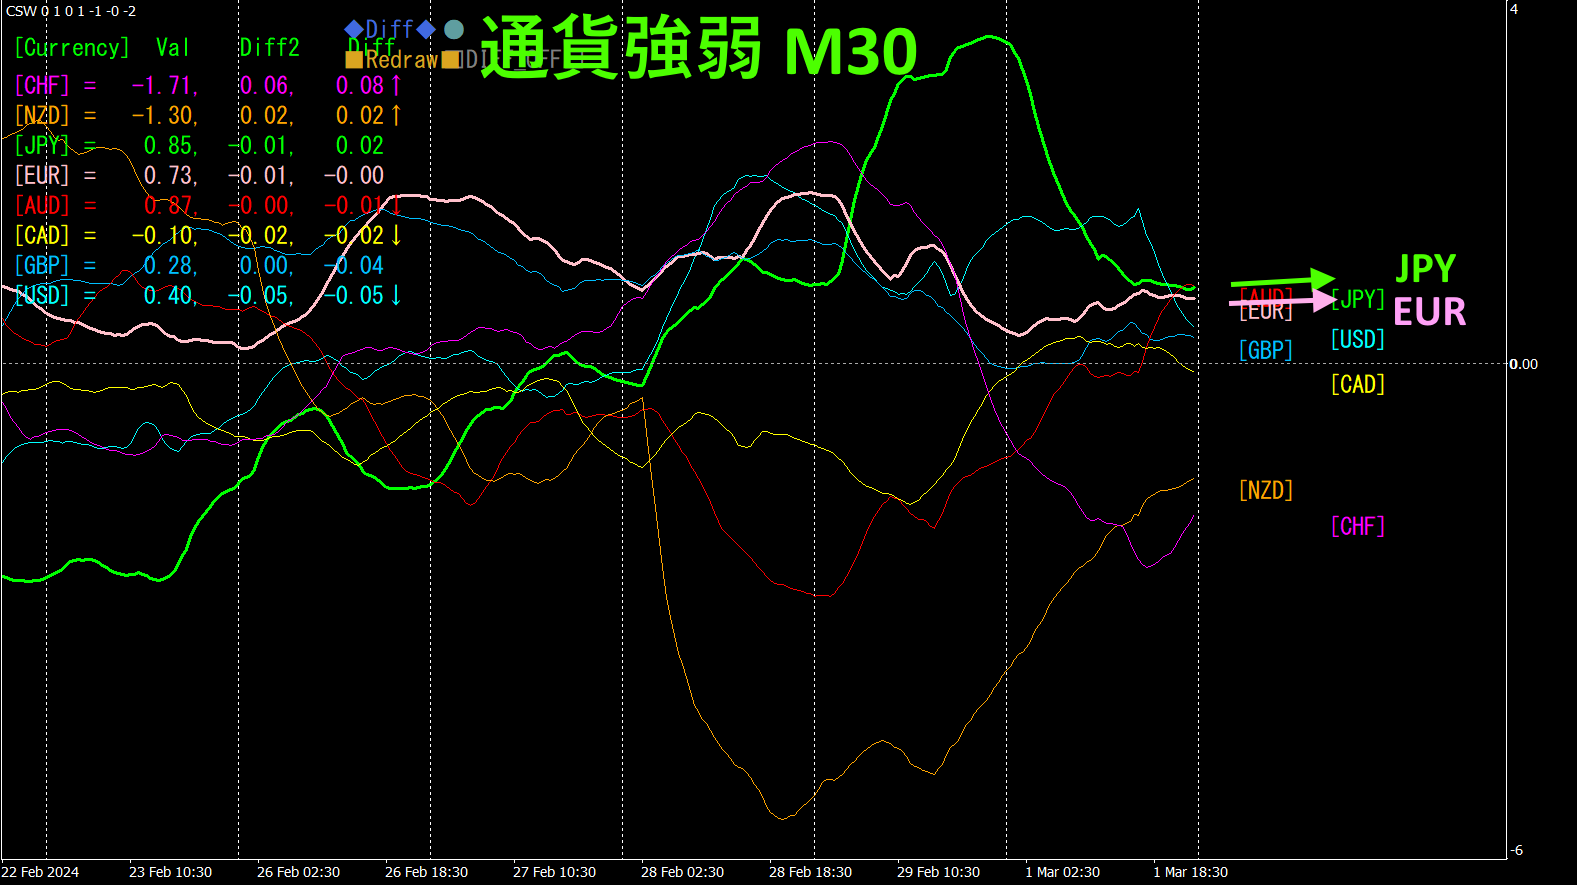
Pink isEUR, green is.JPYJPY and are also mostly horizontal. With no clear direction, the trend cannot be determined.
4. Identify tops and bottoms from all currency pairs and formulate a trend strategy (target:NZDCHF).
2505“Top and Bottom Search indicator” is used to select NZDCHF as a currency pair located at a bottom. We’re aiming for a rebound from the bottom.
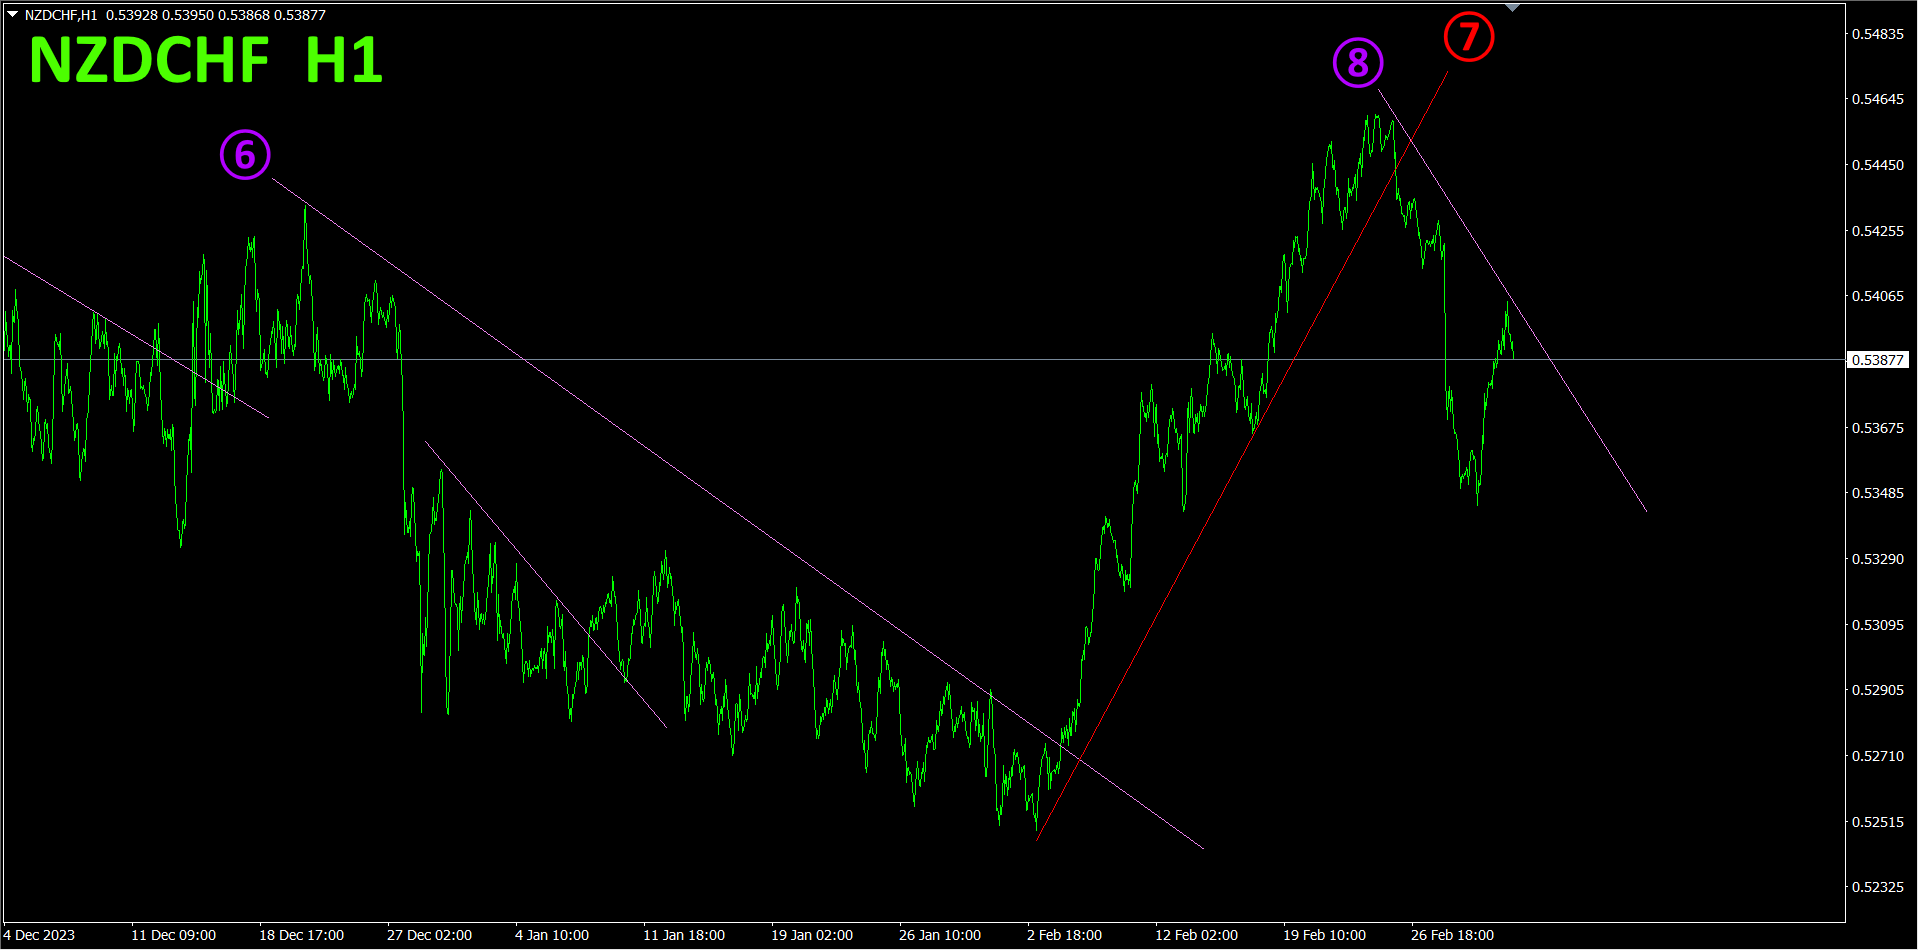
Having broken above the lower sloping line, I opened a buy position. Last week, unrealized profit reached about185pips, so I took profit.
Using the “Trend Line EX,” if you hold until the ascending trend line is broken, you could gain about170pips. In hindsight, the market adage “Profits from taking profits multiply” was indeed the correct approach.
Refer to the 4-hour currency strength chart.
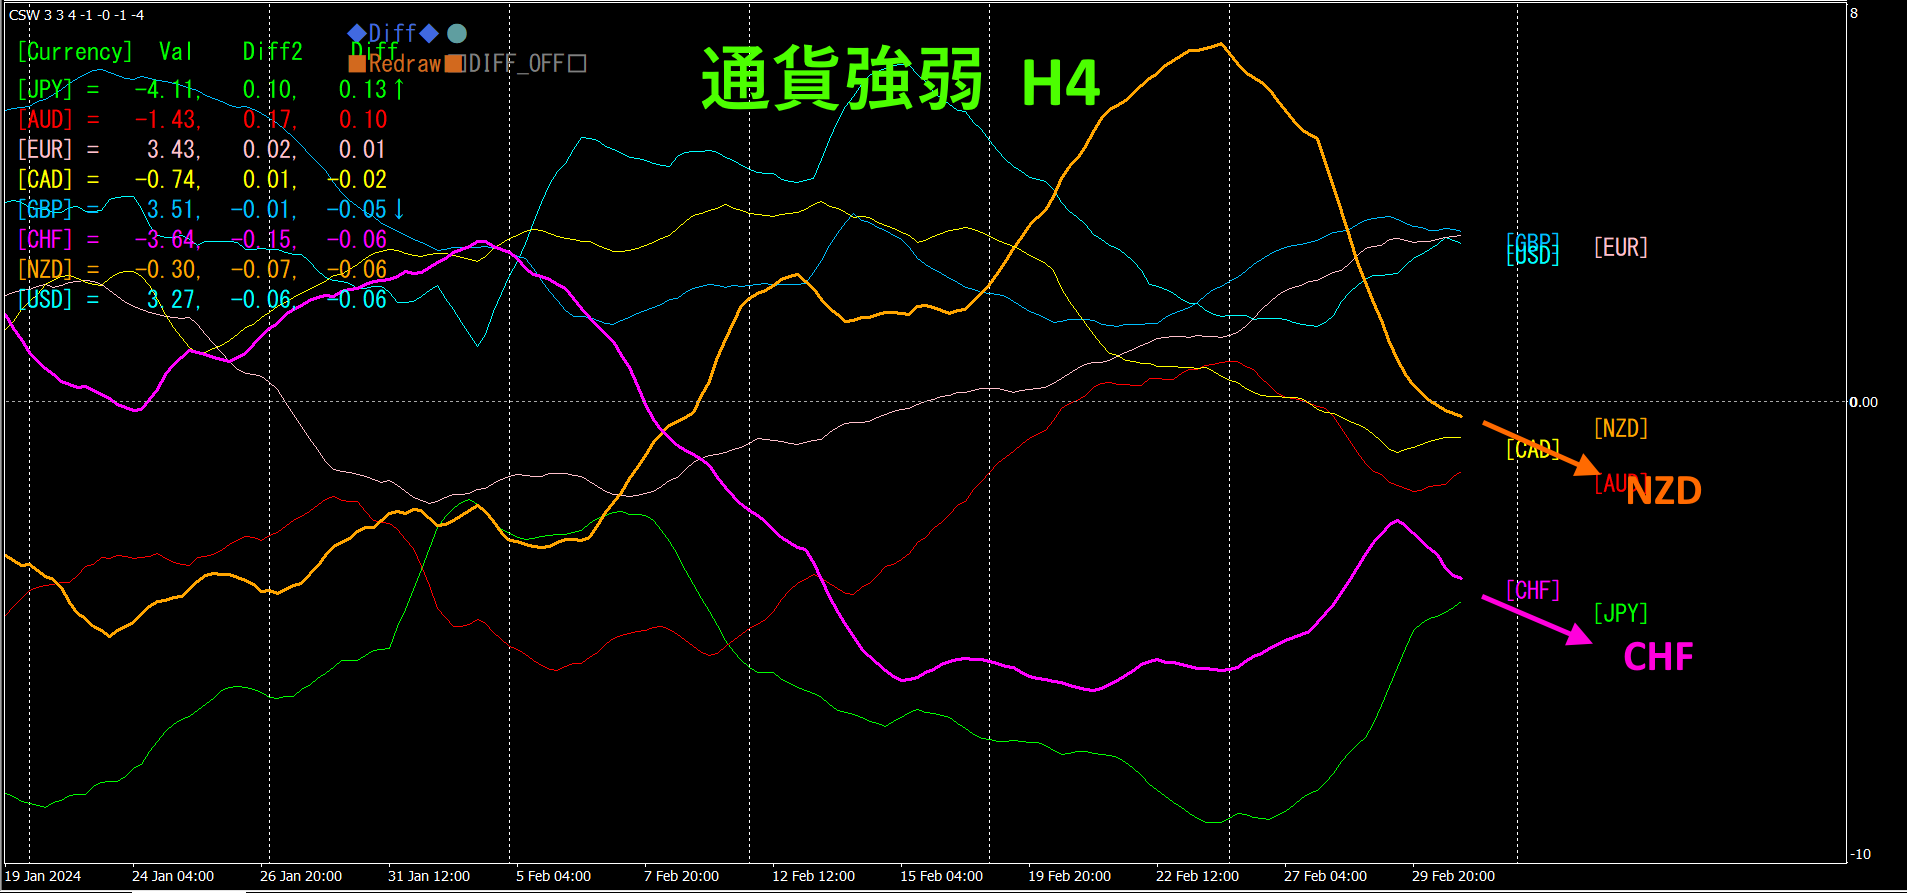
Red-purple isCHF, orange isNZD.NZD and are both downwards. Since no clear trend emerges, I’ll stay on the sidelines.
By comparing typical FX charts with currency strength charts simultaneously, the trend direction becomes clearly “visualized.”
With semi-automatic EA, the “Trend Line EX” allows you to draw a downward-sloping line; if the price breaks above it, it automatically buys, and if it breaks above the rising line, it automatically closes, enabling a passive trading style.
※“Trend Line EX”

https://www.gogojungle.co.jp/tools/indicators/42257
For those interested in the “8C currency strength visualization indicator,” please refer to the following pages.
MT4 version
https://www.gogojungle.co.jp/tools/indicators/39150

version

https://www.gogojungle.co.jp/tools/indicators/39159
【My listed products】


