

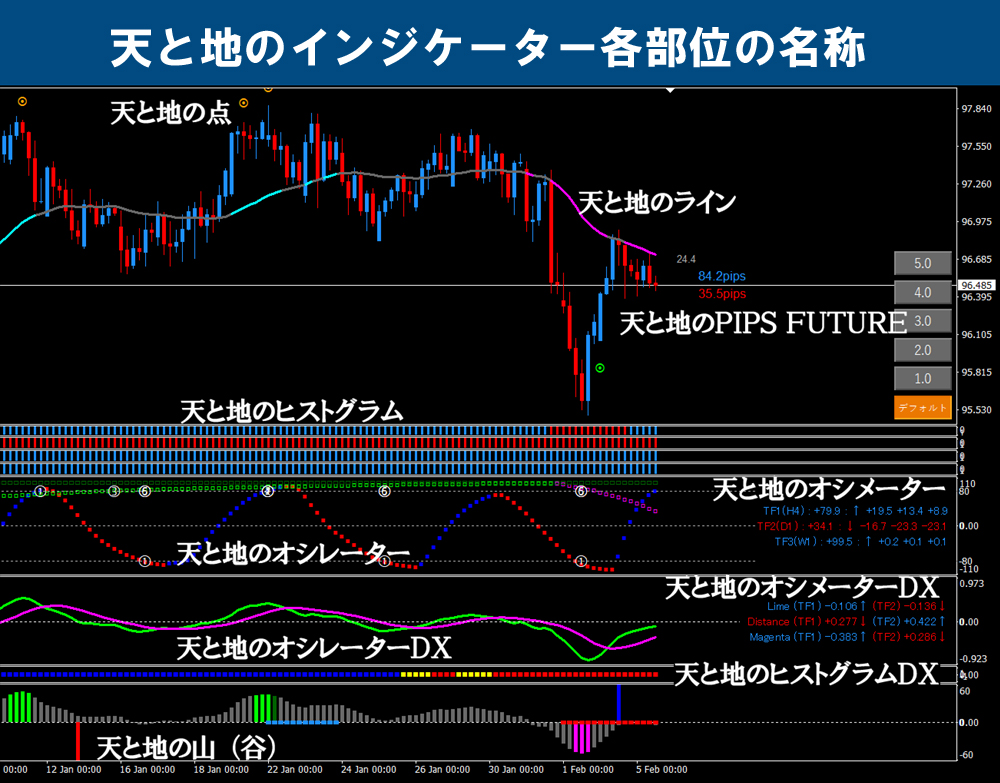
【February 28, 2024】 Chart analysis using the Sky and Earth indicators (11 currency pairs)
As of 6 PM today, the 28th, there were about 11 currency pairs showing a good pattern, so I’ll briefly introduce them. All are on the 4-hour chart (environment recognition chart). I hope this will be helpful for your future trades.

・This article mainly verifies past performance using the “Heaven and Earth Indicator.”
・The content is structured on the premise of using the most accurate method in this tool: “4-hour and 15-minute simultaneous monitoring method”.
・This tool is a groundbreaking trading tool that can be used without understanding the classic FX theories (Elliott Wave, Dow Theory, Garner’s laws, cycle theory, price action, Fibonacci, support/resistance, channels, etc.).
・The article linked below features valuable DMs, reviews, posts from users. While including success reports and carefully selecting useful DMs, I believe it will be helpful for everyone.
【Daily Updated】User impressions (DM version) from those who actually used Heaven and Earth Indicator
【Daily Updated】Search results for “#Heaven and Earth Indicator”

The Heaven and Earth Indicator is a trading method using my original indicator developed by Abusan (released February 2022). Thanks to everyone's support,「GogoJungle Award 2022, 2023
■ Heaven and Earth Indicator
https://www.gogojungle.co.jp/tools/indicators/35780
■ Heaven and Earth Indicator【MT5版】
https://www.gogojungle.co.jp/tools/indicators/47523
■ Heaven and Earth Mountain
https://www.gogojungle.co.jp/tools/indicators/37744
■ Heaven and Earth EA ~ Semi-Automated Trading System ~
https://www.gogojungle.co.jp/tools/indicators/43213
■ Heaven and Earth Dashboard
https://www.gogojungle.co.jp/tools/indicators/46257
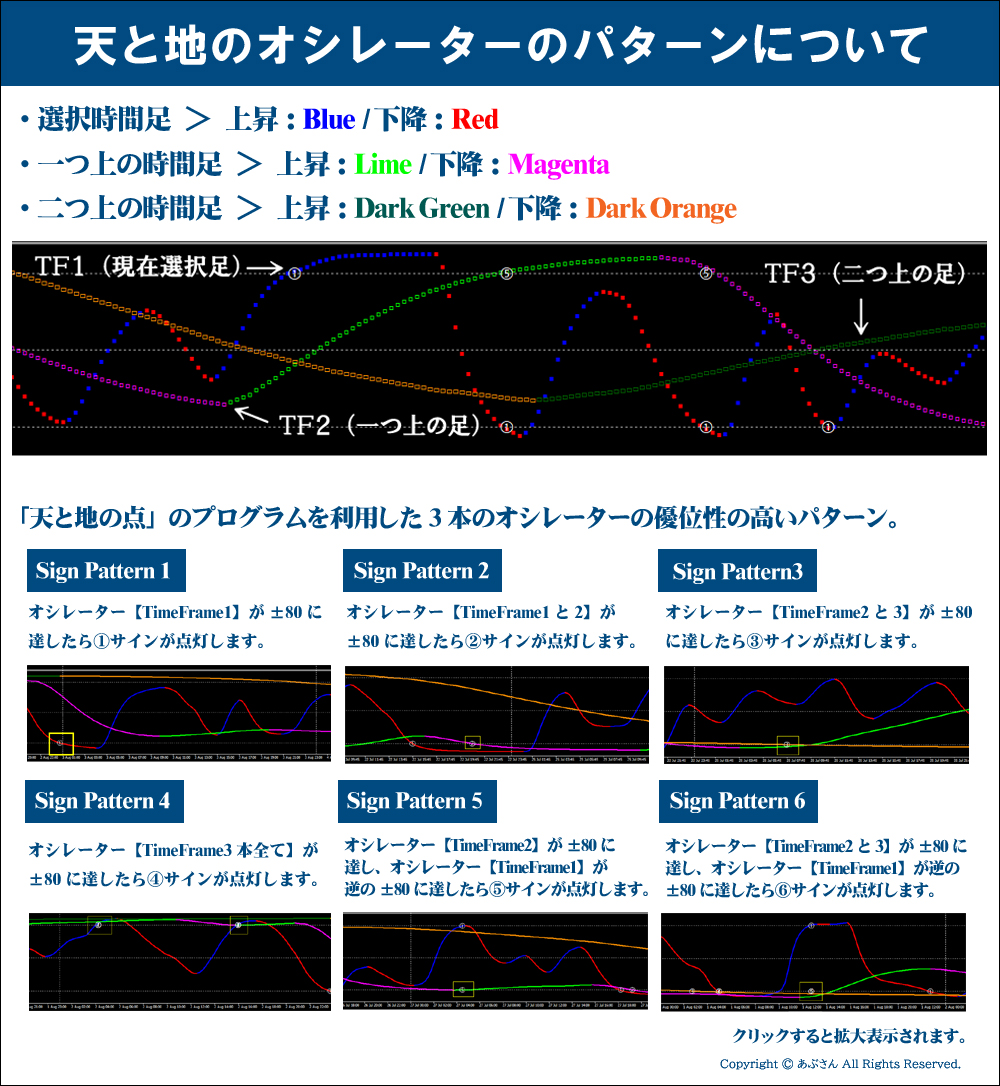
Please refer to the definitions of the specialized terms used in this blog in the following: “Names of each part of Heaven and Earth Indicator” and “Heaven and Earth Oscillator patterns.” If you have any other questions, please refer to the Heaven and Earth Indicator sales pageUsers who already have it, you can read the manual, right?
Now, I will move on to the verification.
Thank you in advance!
※ All images enlarge when clicked.

※ I’ve written the core reasons simply. On this 4-hour chart set your bias, and on the 15-minute chart search for entry points that align with that direction.
■ EUR/USD4-hour chart (environment recognition chart)
・Oscillator TF2 rising
・Long entry signal within 16.5 pips
・Histogram blue
・Histogram DX blue

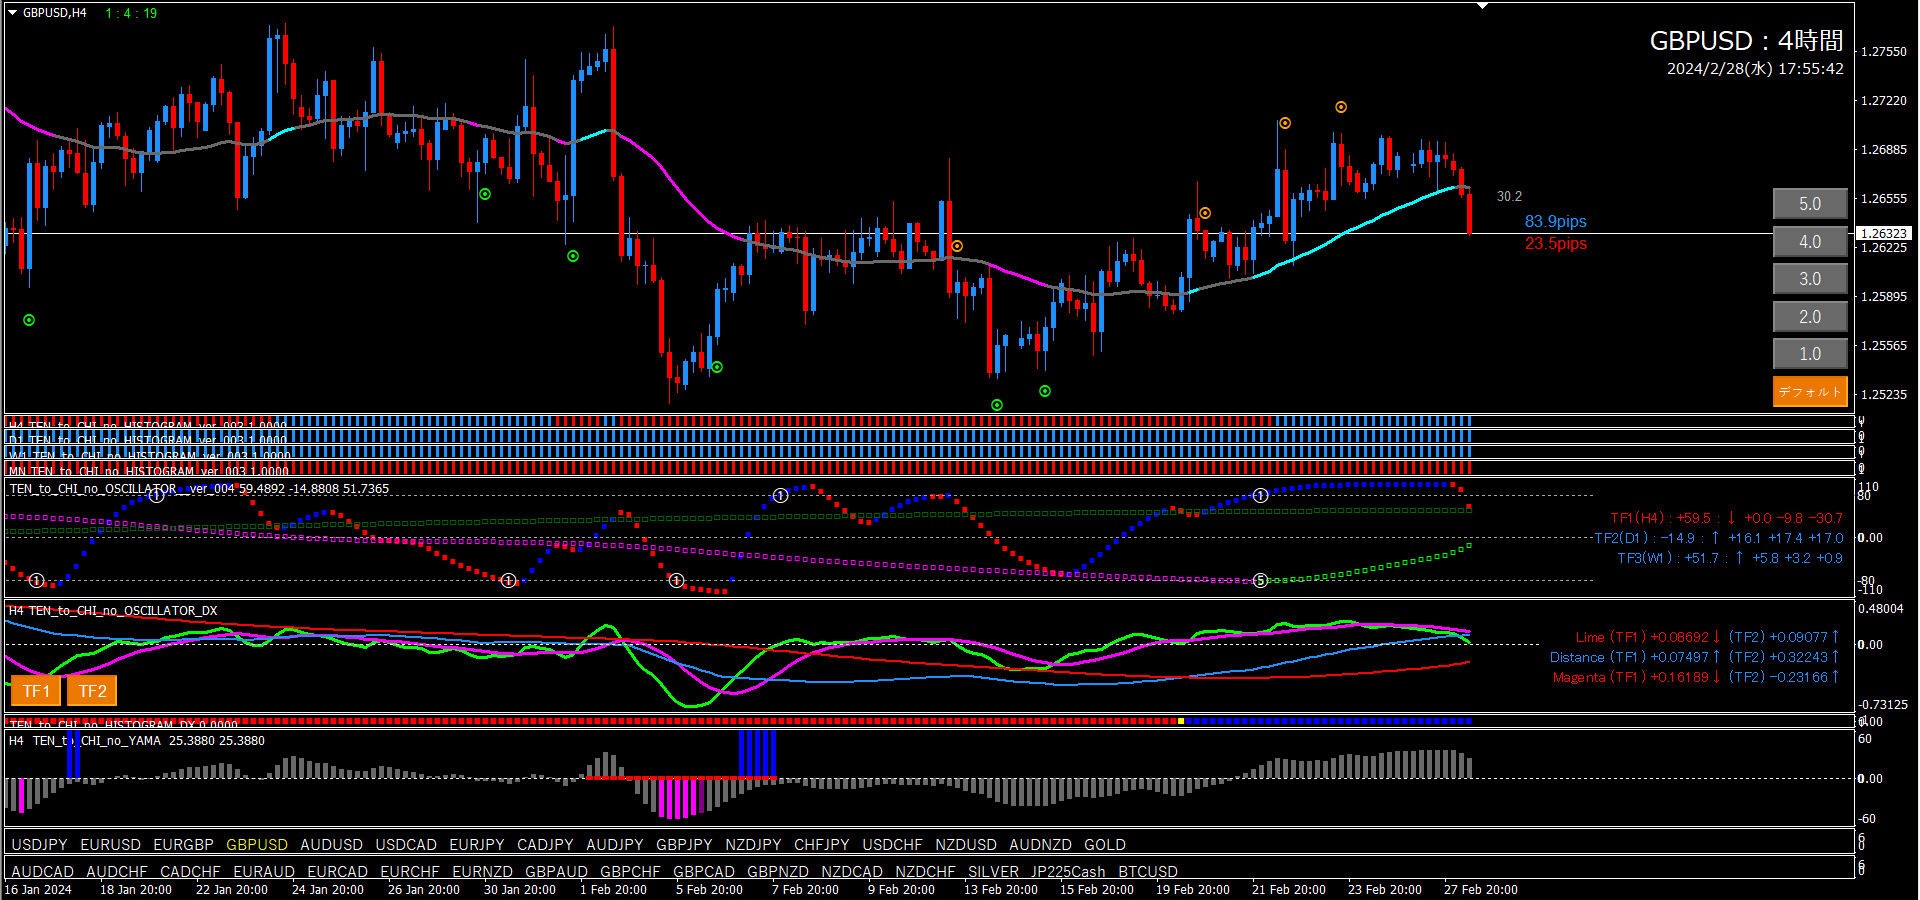
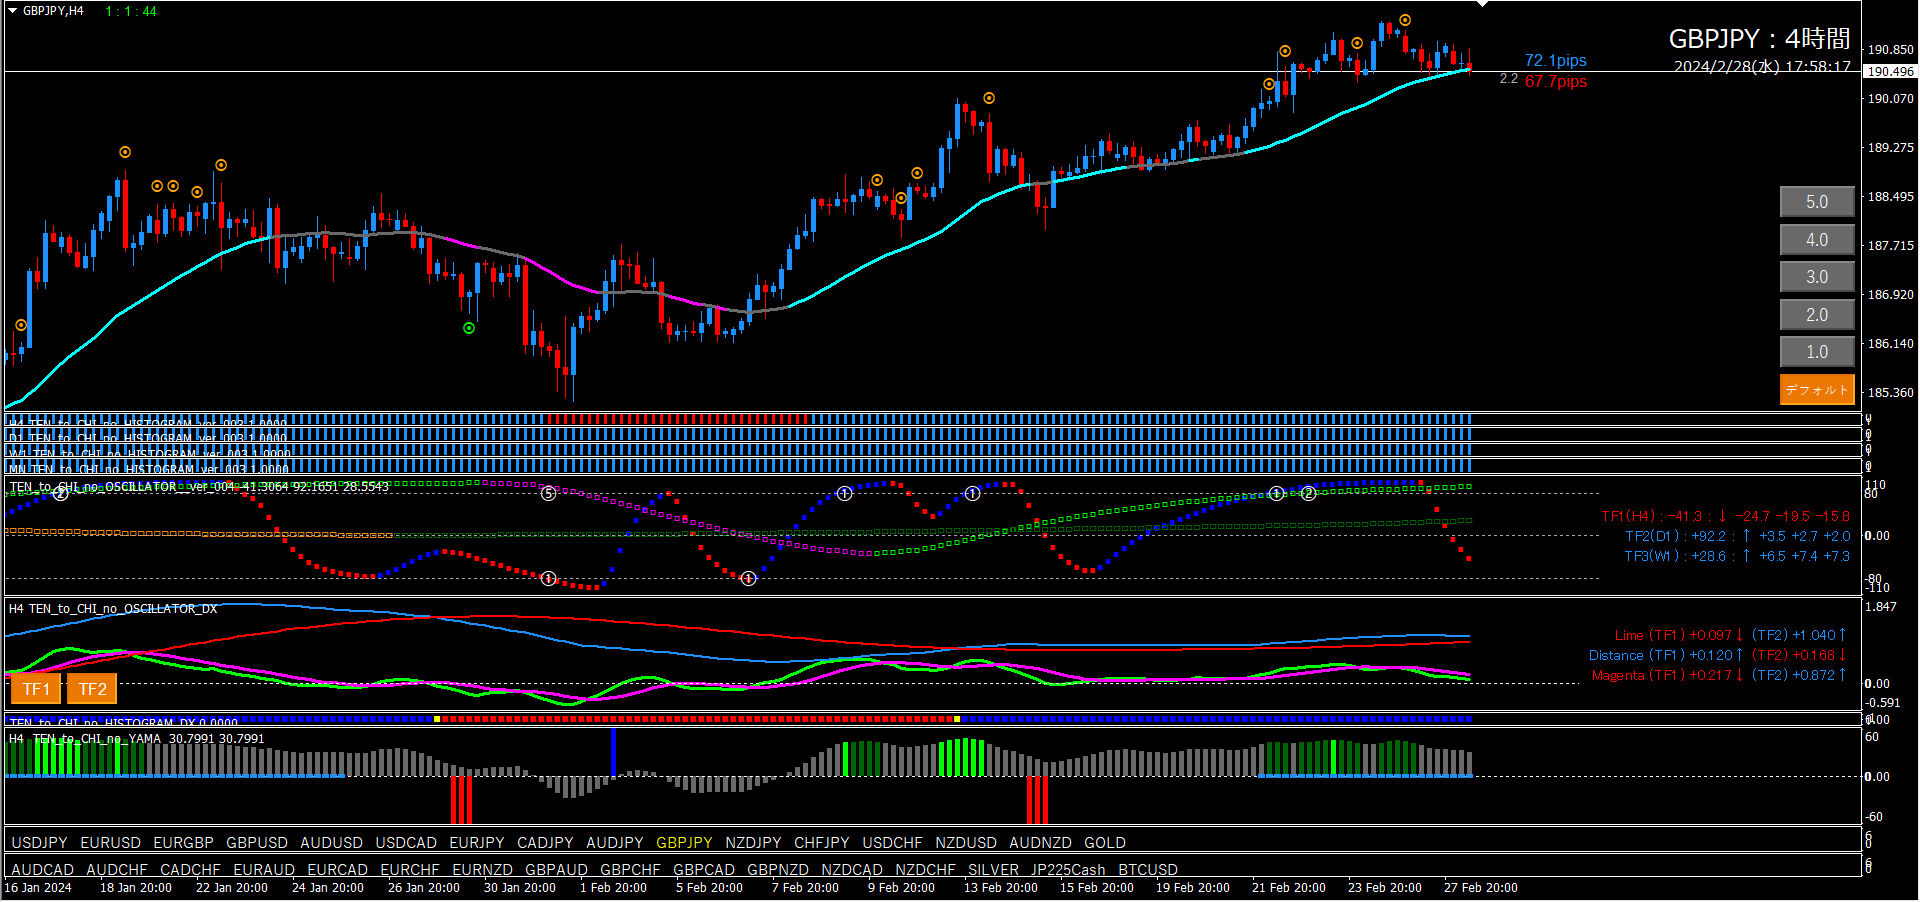
■ GBP/USD 4-hour chart (environment recognition chart)
・Oscillator TF2 rising
・Long entry signal within 23.5 pips
・Histogram blue
・Histogram DX blue
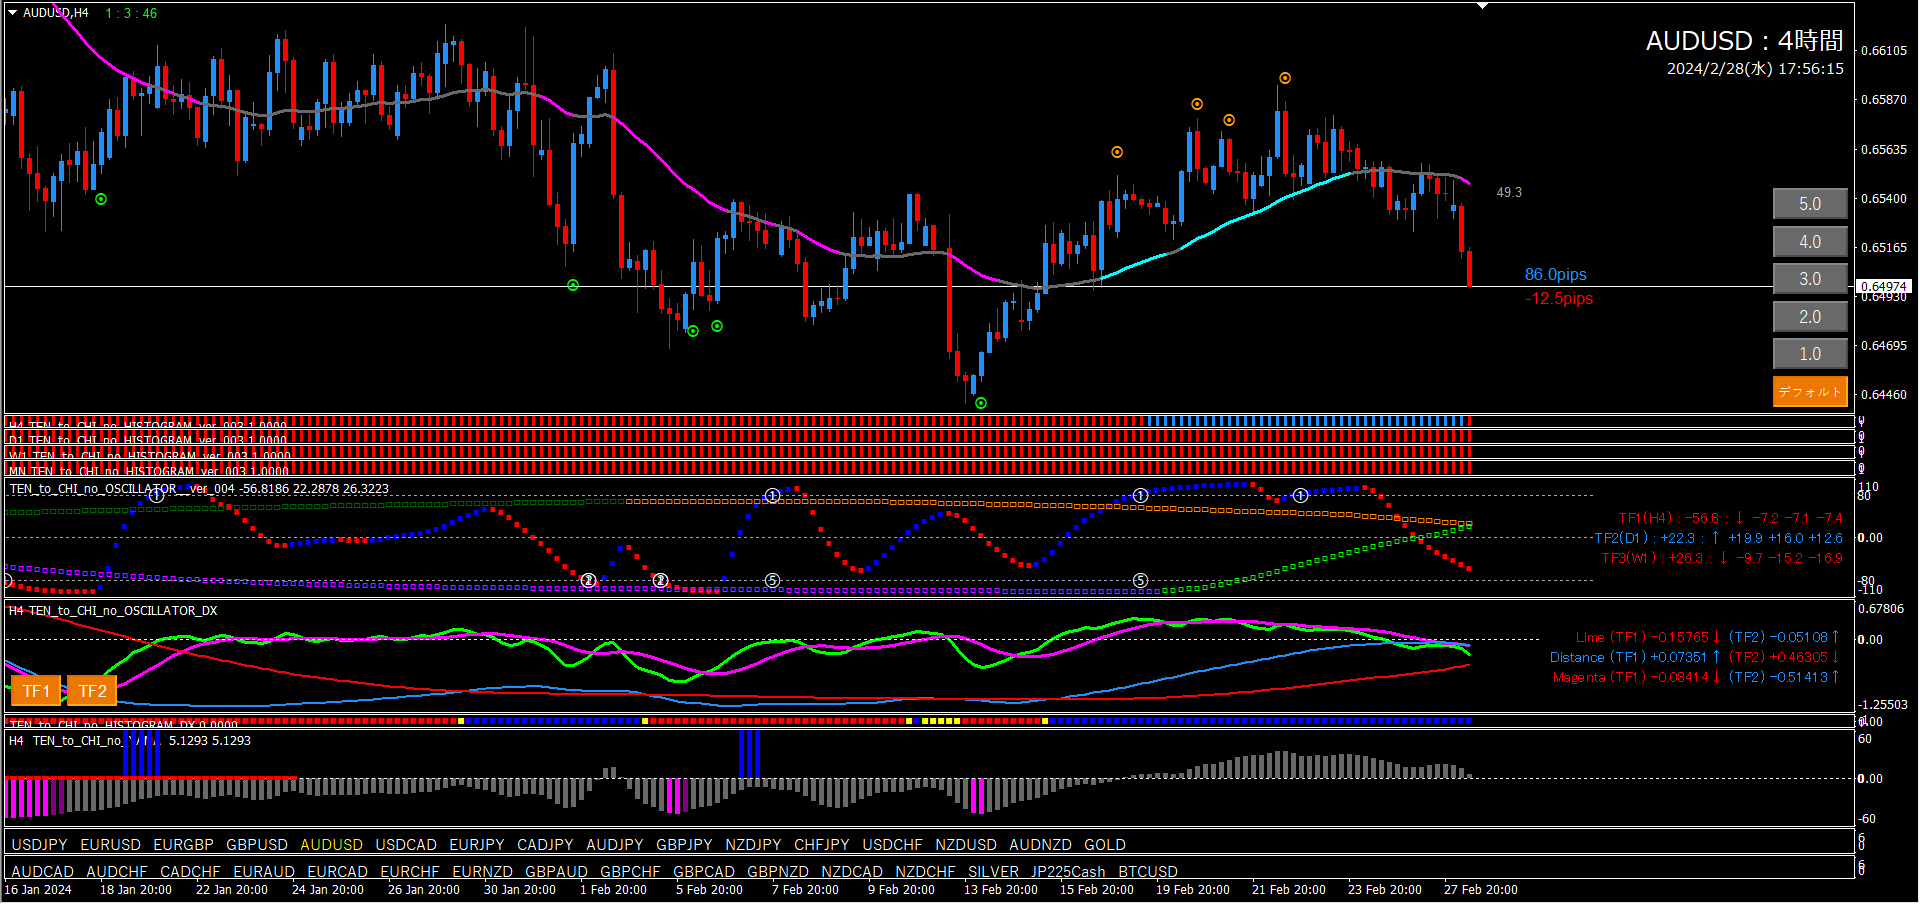
■ AUD/USD 4-hour chart (environment recognition chart)
・Oscillator TF2 rising
・Oscillator TF1 around -80
・Long entry signal within -12.5 pips
・Histogram DX blue
■ CAD/JPY 4-hour chart (environment recognition chart)
・Oscillator TF2 rising and sticking
・Oscillator TF1 around -80
・Long entry signal within 9.0 pips
・Histogram all blue
・Low

■ USD/JPY 4-hour chart (environment recognition chart)
・Oscillator TF2 rising and sticking
・Oscillator TF1 around -80
・Long entry signal within -8.5 pips
・Histogram all blue
・Histogram DX blue
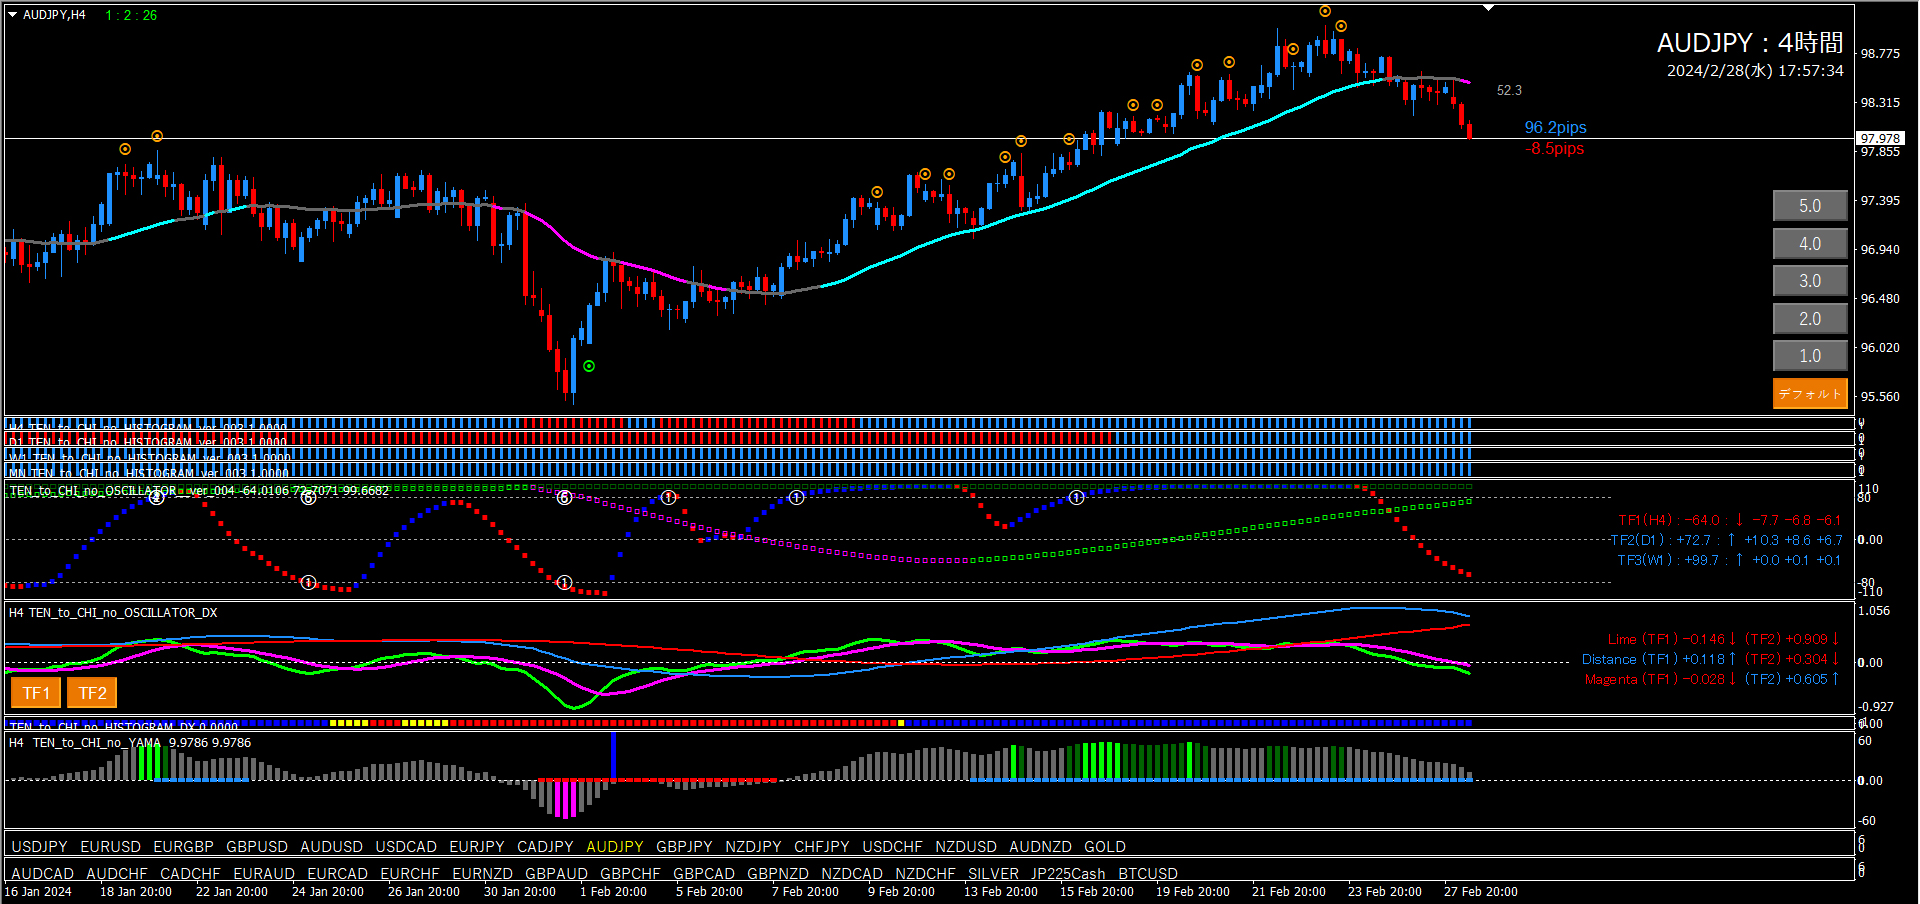
■ AUD/JPY 4-hour chart (environment recognition chart)
・Oscillator TF2 rising and sticking
・Oscillator TF1 around -80
・Long entry signal within -67.7 pips
・Histogram all blue
・Histogram DX blue
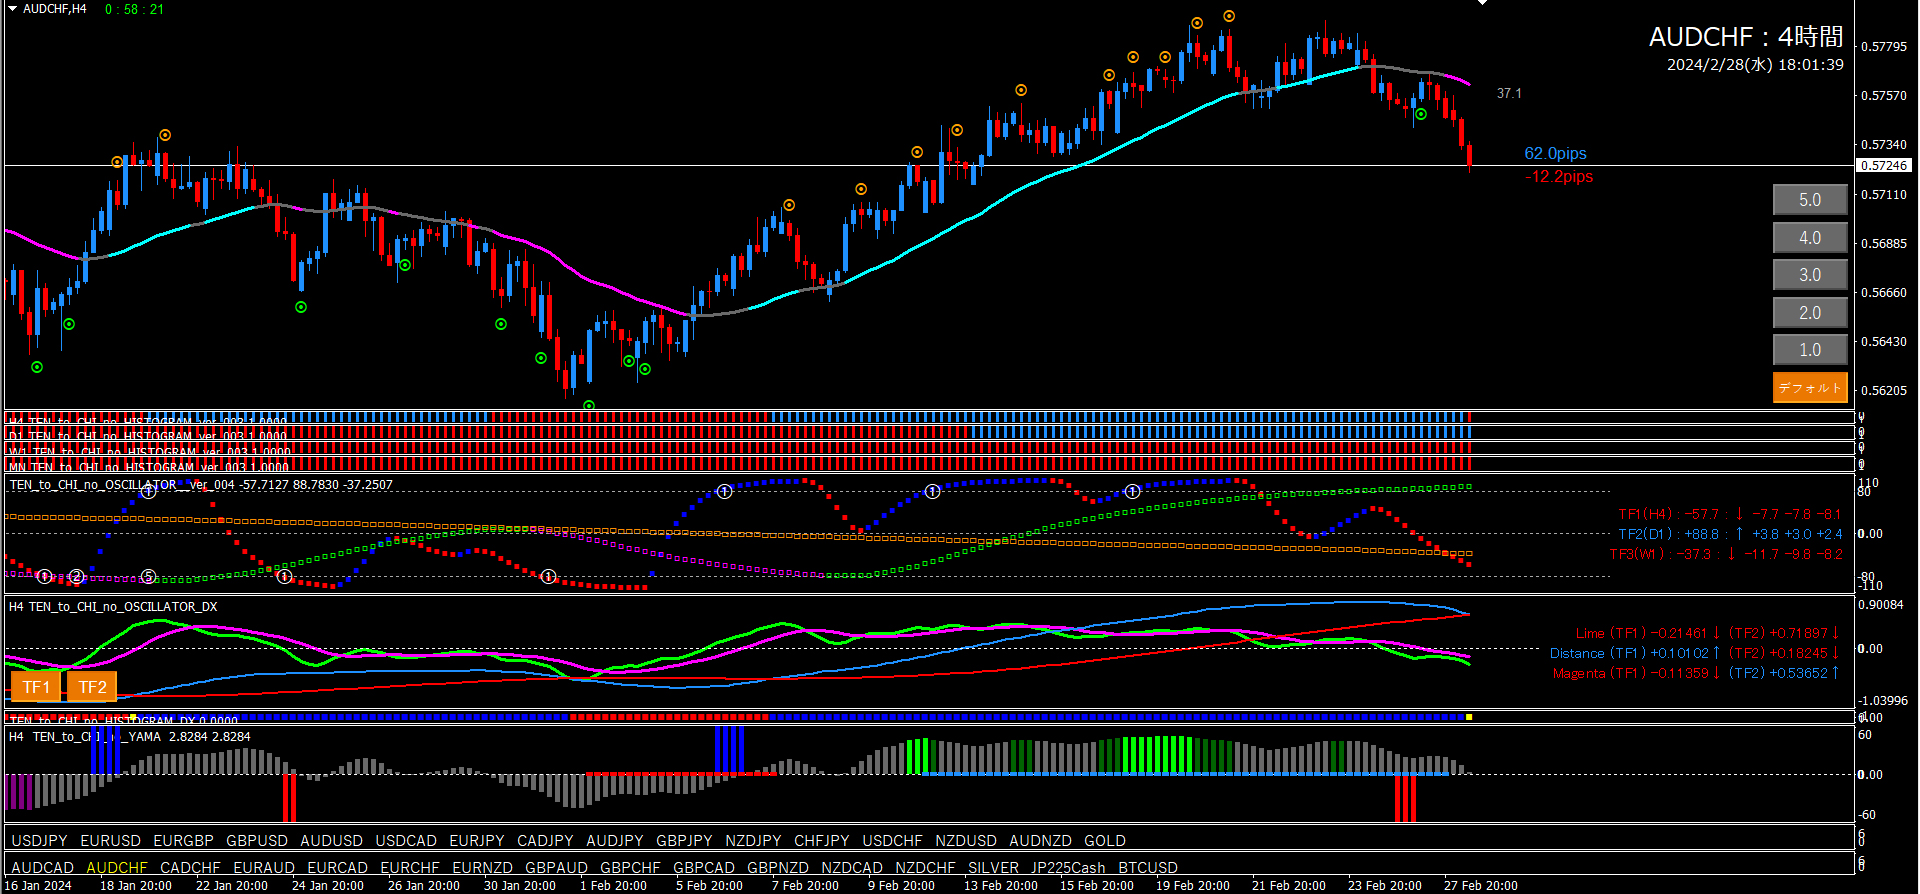
■ AUD/CHF 4-hour chart (environment recognition chart)
・Oscillator TF2 rising
・Long entry signal within -80.9 pips
・Histogram all blue
・Histogram DX blue
■ NZD/CHF 4-hour chart (environment recognition chart)
・Oscillator TF2 rising
・Oscillator TF1 around -80
・Long entry signal within -13.7 pips
・Histogram blue
・Histogram DX blue

■ USD/CNH 4-hour chart (environment recognition chart)
・Oscillator TF2 rising
・Oscillator TF1 around -80
・Long entry signal within -12.2 pips
・Histogram DX blue
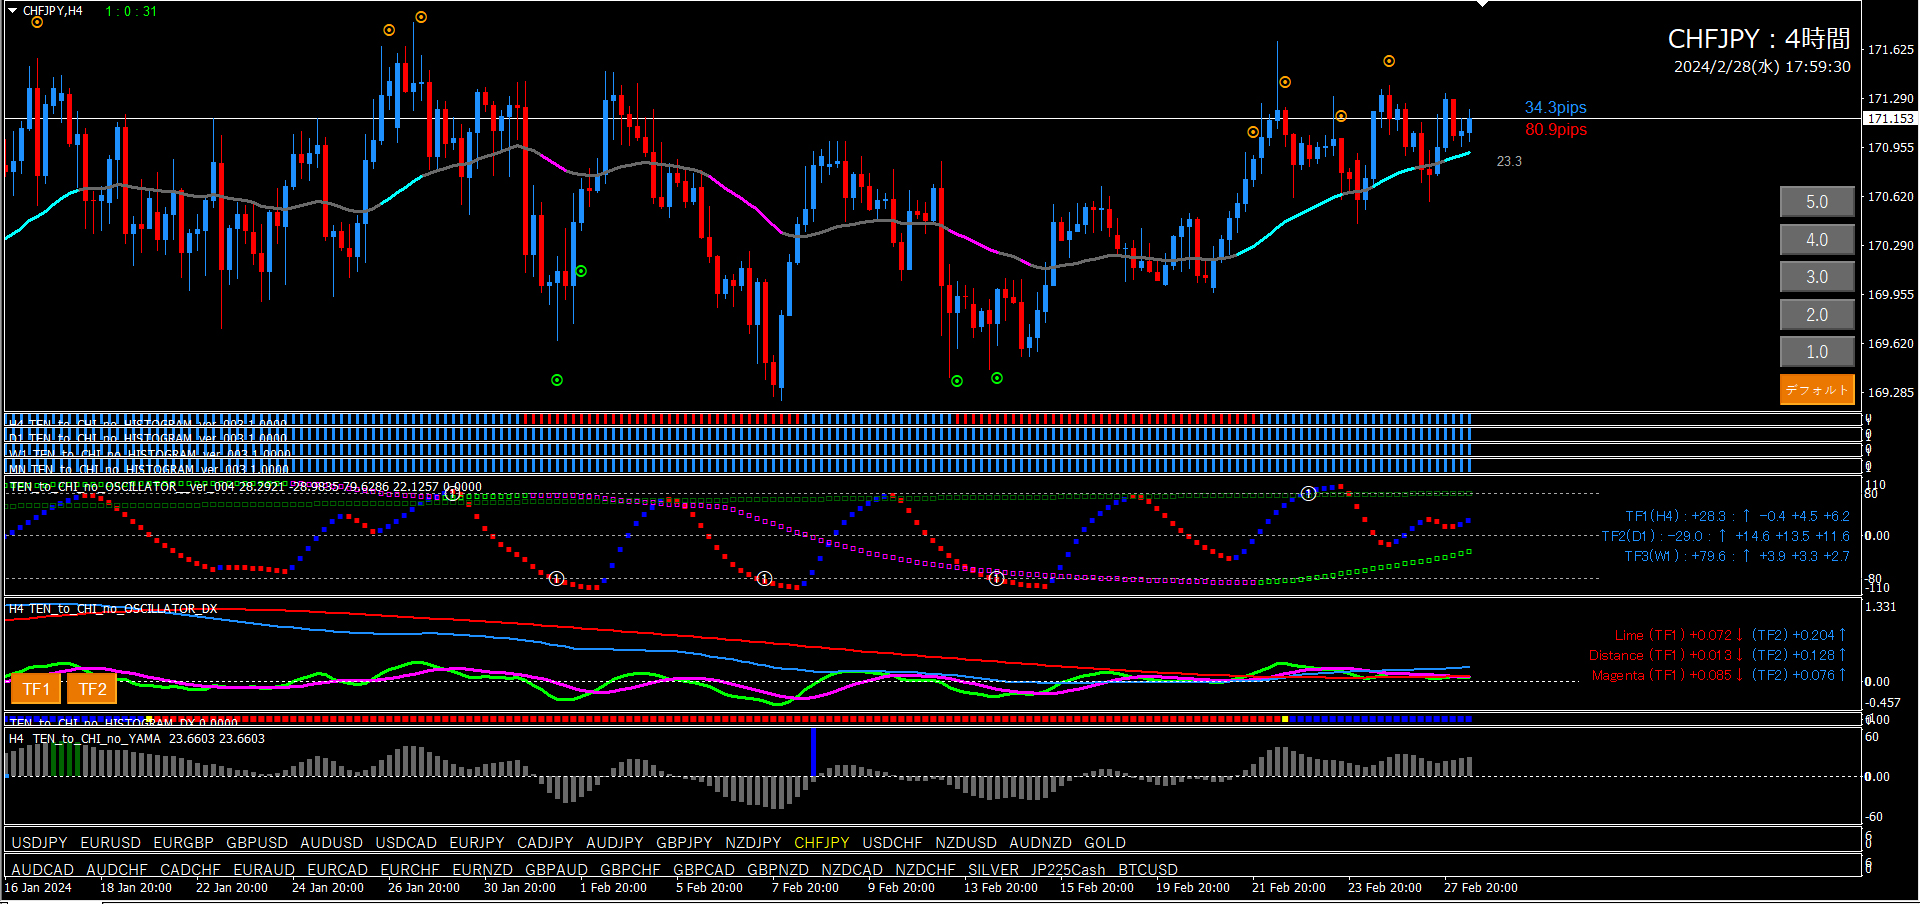
・Oscillator TF2 rising
・Long entry signal within -24.2 pips
・Histogram blue
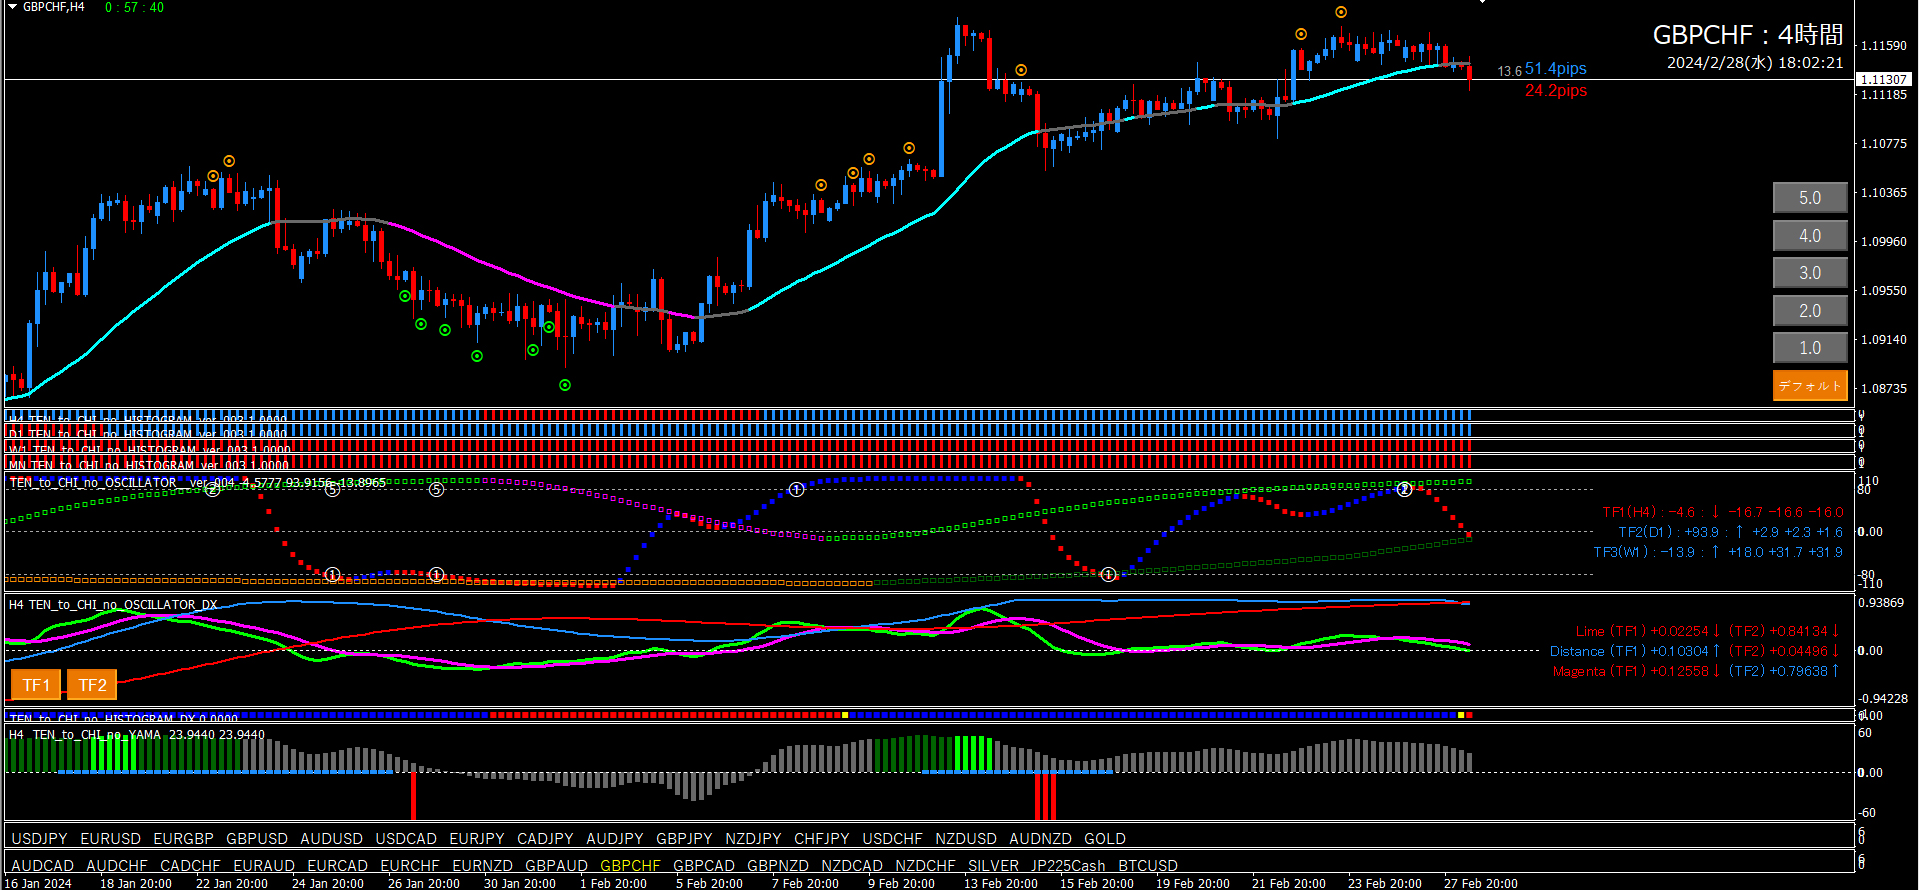
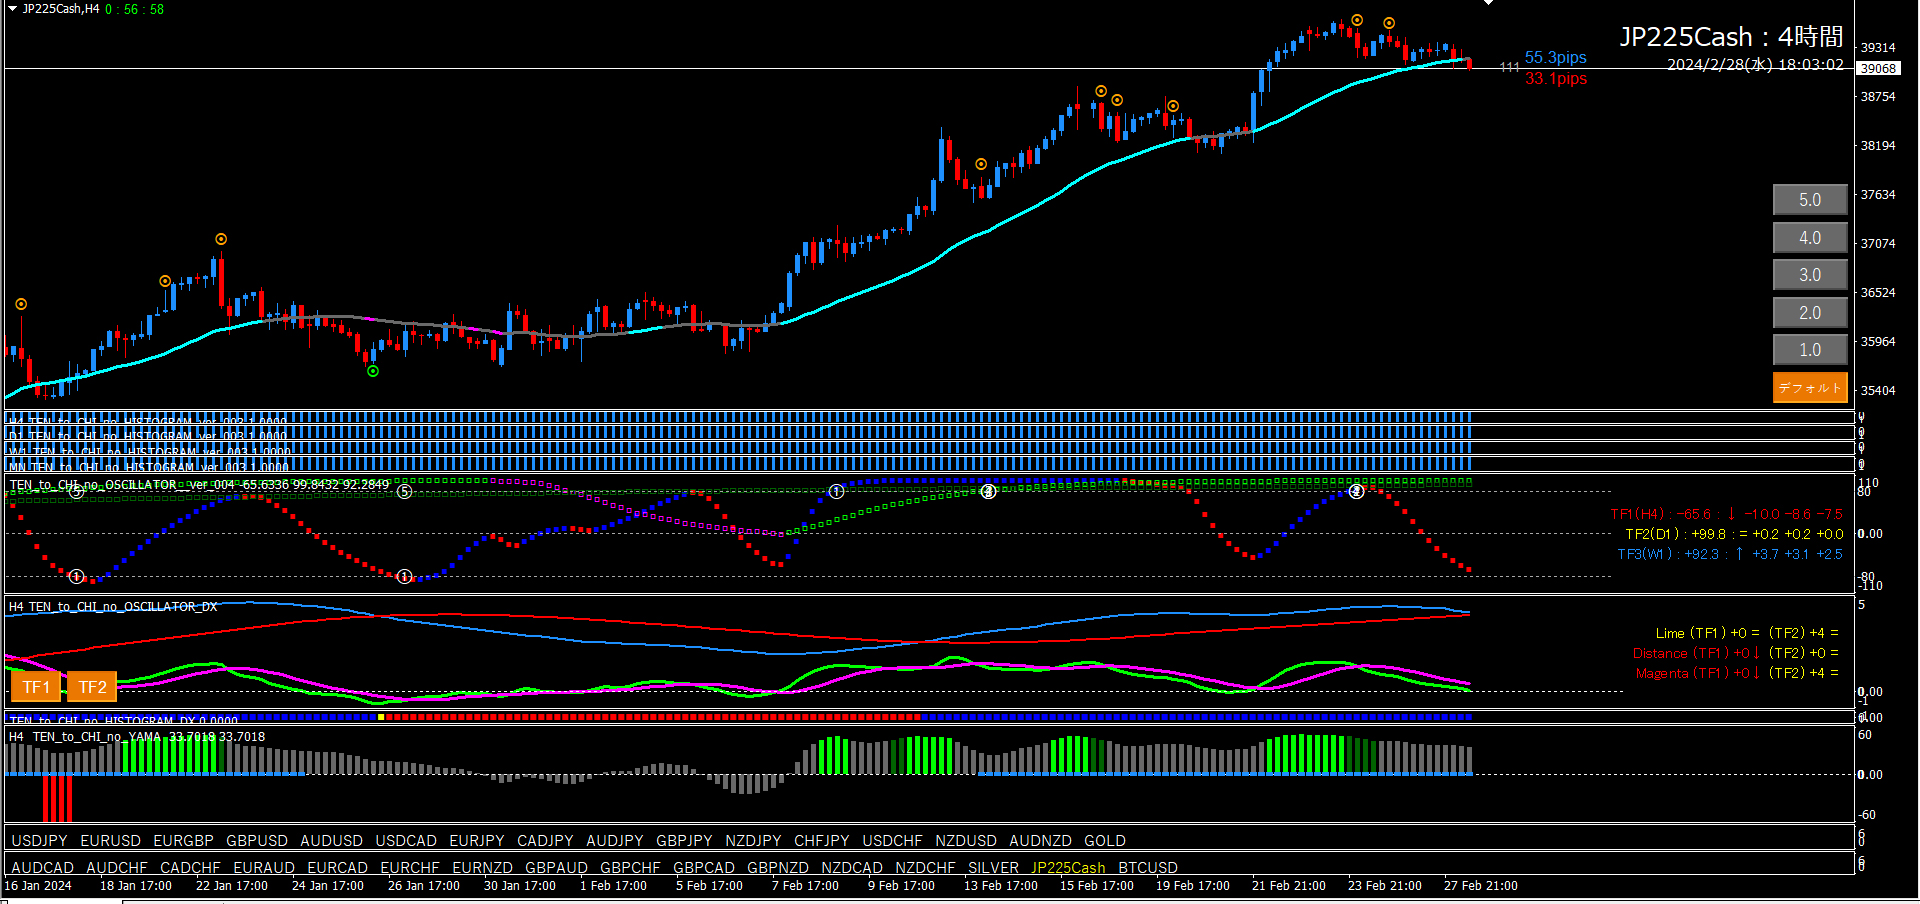
■ GBP/USD 4-hour chart (environment recognition chart)■ USD/CHF 4-hour chart (environment recognition chart)
・Oscillator TF2 rising
・Oscillator TF1 around -80
・Long entry signal within -33.1 pips
・Histogram blue
・Histogram DX blue

That’s all.
I hope it at least provides some reference for everyone.
