

Why is the Golden Cross a buy signal?

Issues Regarding Trading Signals
“When the price crosses the moving average upward, it is called a Golden Cross. Explain why this is a buying signal by referring to changes in investor sentiment.”
In books and on the internet, the cross of short-term and long-term moving averages is sometimes called a Golden Cross or Dead Cross.
Also, often the content ends with simply introducing technical indicators as signals, saying “these are buy signals and sell signals.”
There is little to no explanation of why they become buy or sell signals, and many people display technical indicators on charts without fully understanding what the trading signals mean.
With that state, you will never become consistently profitable in trading. Those who take this seriously should feel a sense of crisis.
Answer
“The break-even point where buying becomes profitable after being generally negative is the Golden Cross, because investors become psychologically bullish.”
Explanation
The role of the moving average is to compare the average price at which people have bought and sold over the past N days with the current price.
For a 20-day moving average, it shows how much profit or loss those who bought or sold in the past 20 days are currently holding.
For example, suppose you bought a stock and are holding a unrealized loss. How would you feel?
If the stock you bought rises after you bought it, you will feel uneasy if it fell.
What if the price then rises and becomes an unrealized gain?
You would gain confidence that your reading was correct.
When you hold a position, investors’ feelings will differ greatly depending on whether you are in profit or a loss.
・Golden Cross is the point where investing becomes psychologically bullish
・Dead Cross is the point where investing becomes psychologically bearish
Therefore, Golden Cross is a buy signal and Dead Cross is a sell signal.
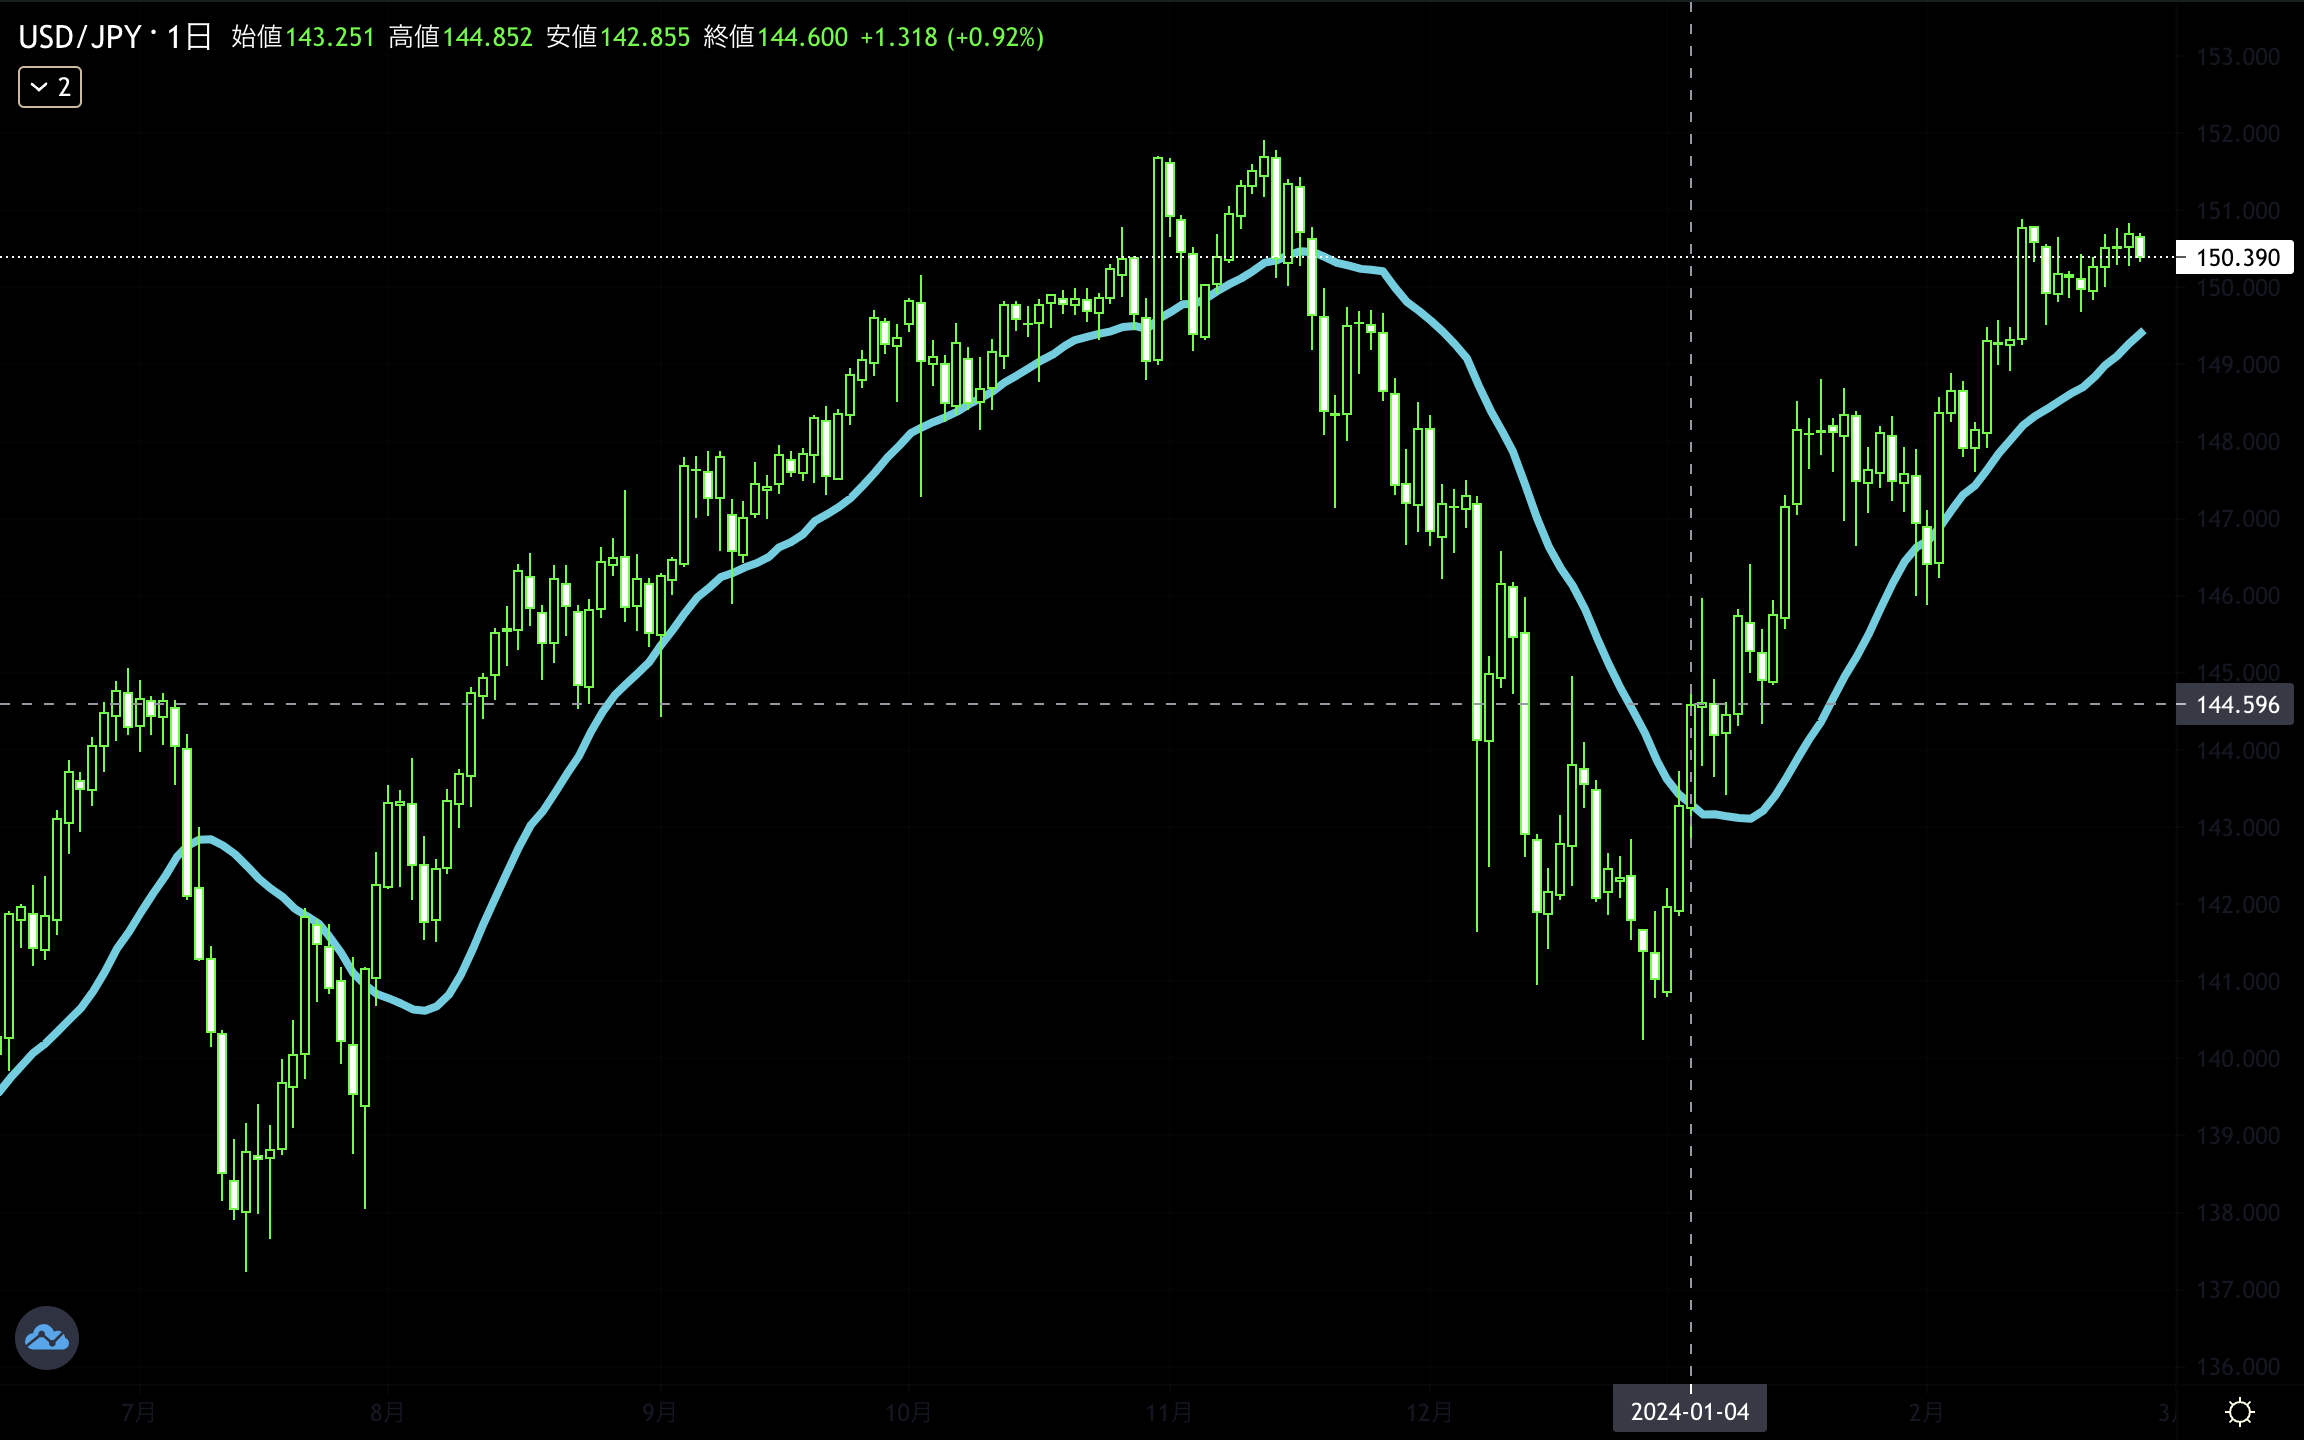
Figure shows the USD/JPY daily chart
The light blue line is the 20-day moving average
Not only stocks, but in currencies and other markets, the same idea applies; the mindset of both buyers and sellers matters, and the psychological change when going from unrealized losses to unrealized gains is important.
For those who plan to study technical analysis in the future, try to keep in mind the following 3 steps.

Three-Step Study of Technical Analysis
① Understand the definitions and meaning of calculations
② Explore information that can be read from indicators
③ Consider the correct timing for buying and selling
Taking the moving average as an example this time
① The definition is the average of the closing prices over the past N days, plotted today and connected by a line
②The role of the moving average is to compare the average price at which people have bought and sold over the past N days with the current price.
③ Golden Cross is the point where the broadly negative buying profit and loss turn positive, and investors become bullish, so it is a buy signal. Dead Cross is the opposite, becoming bearish, hence a sell signal.
By understanding these things and using trading signals accordingly, you will see a completely different chart perspective compared to just displaying technical indicators without understanding their meaning.
We will further delve into the step ③ of correctly timing buys and sells in the Golden Cross case.
Even if the price breaks above the moving average, as shown in the chart above, in a ranging market it can be a trap.
The ranging condition can also be explained by investor psychology.
From being in a loss to turning into a profit, investors become bullish, but if profits disappear again or turn into losses repeatedly, they will not become bullish or bearish.
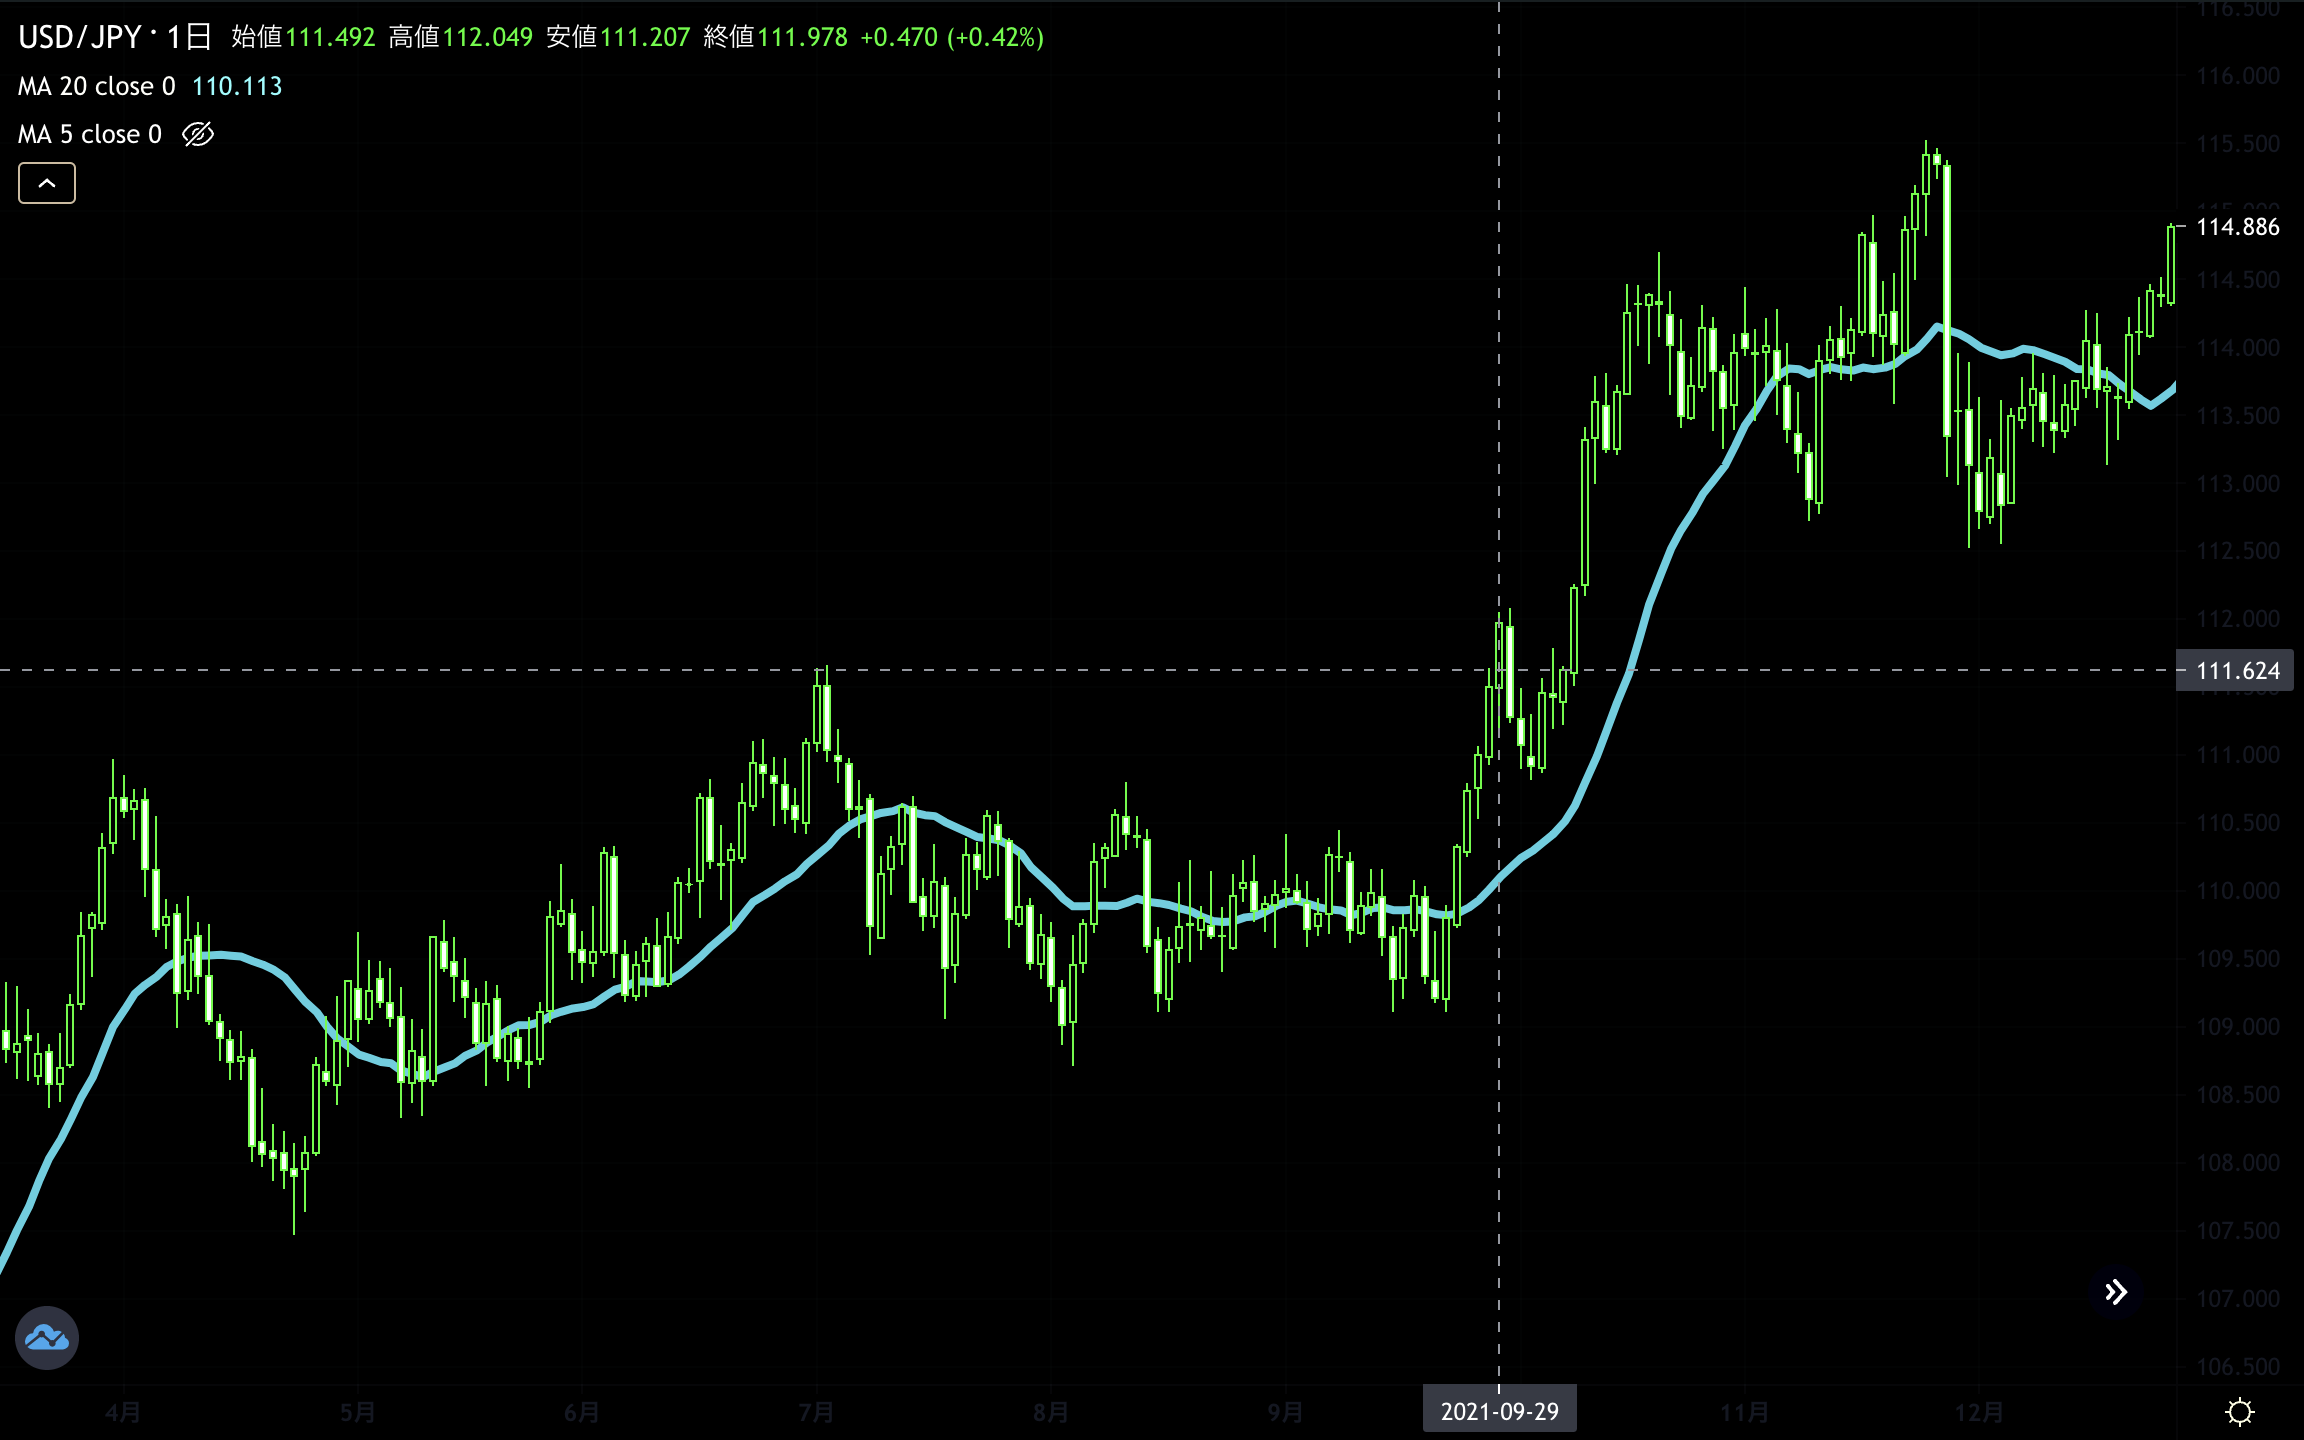
To dispel traps, you can buy when the price breaks above the recent high, or instead of price, use a shorter moving average to reduce the number of crosses, which also helps reduce traps.
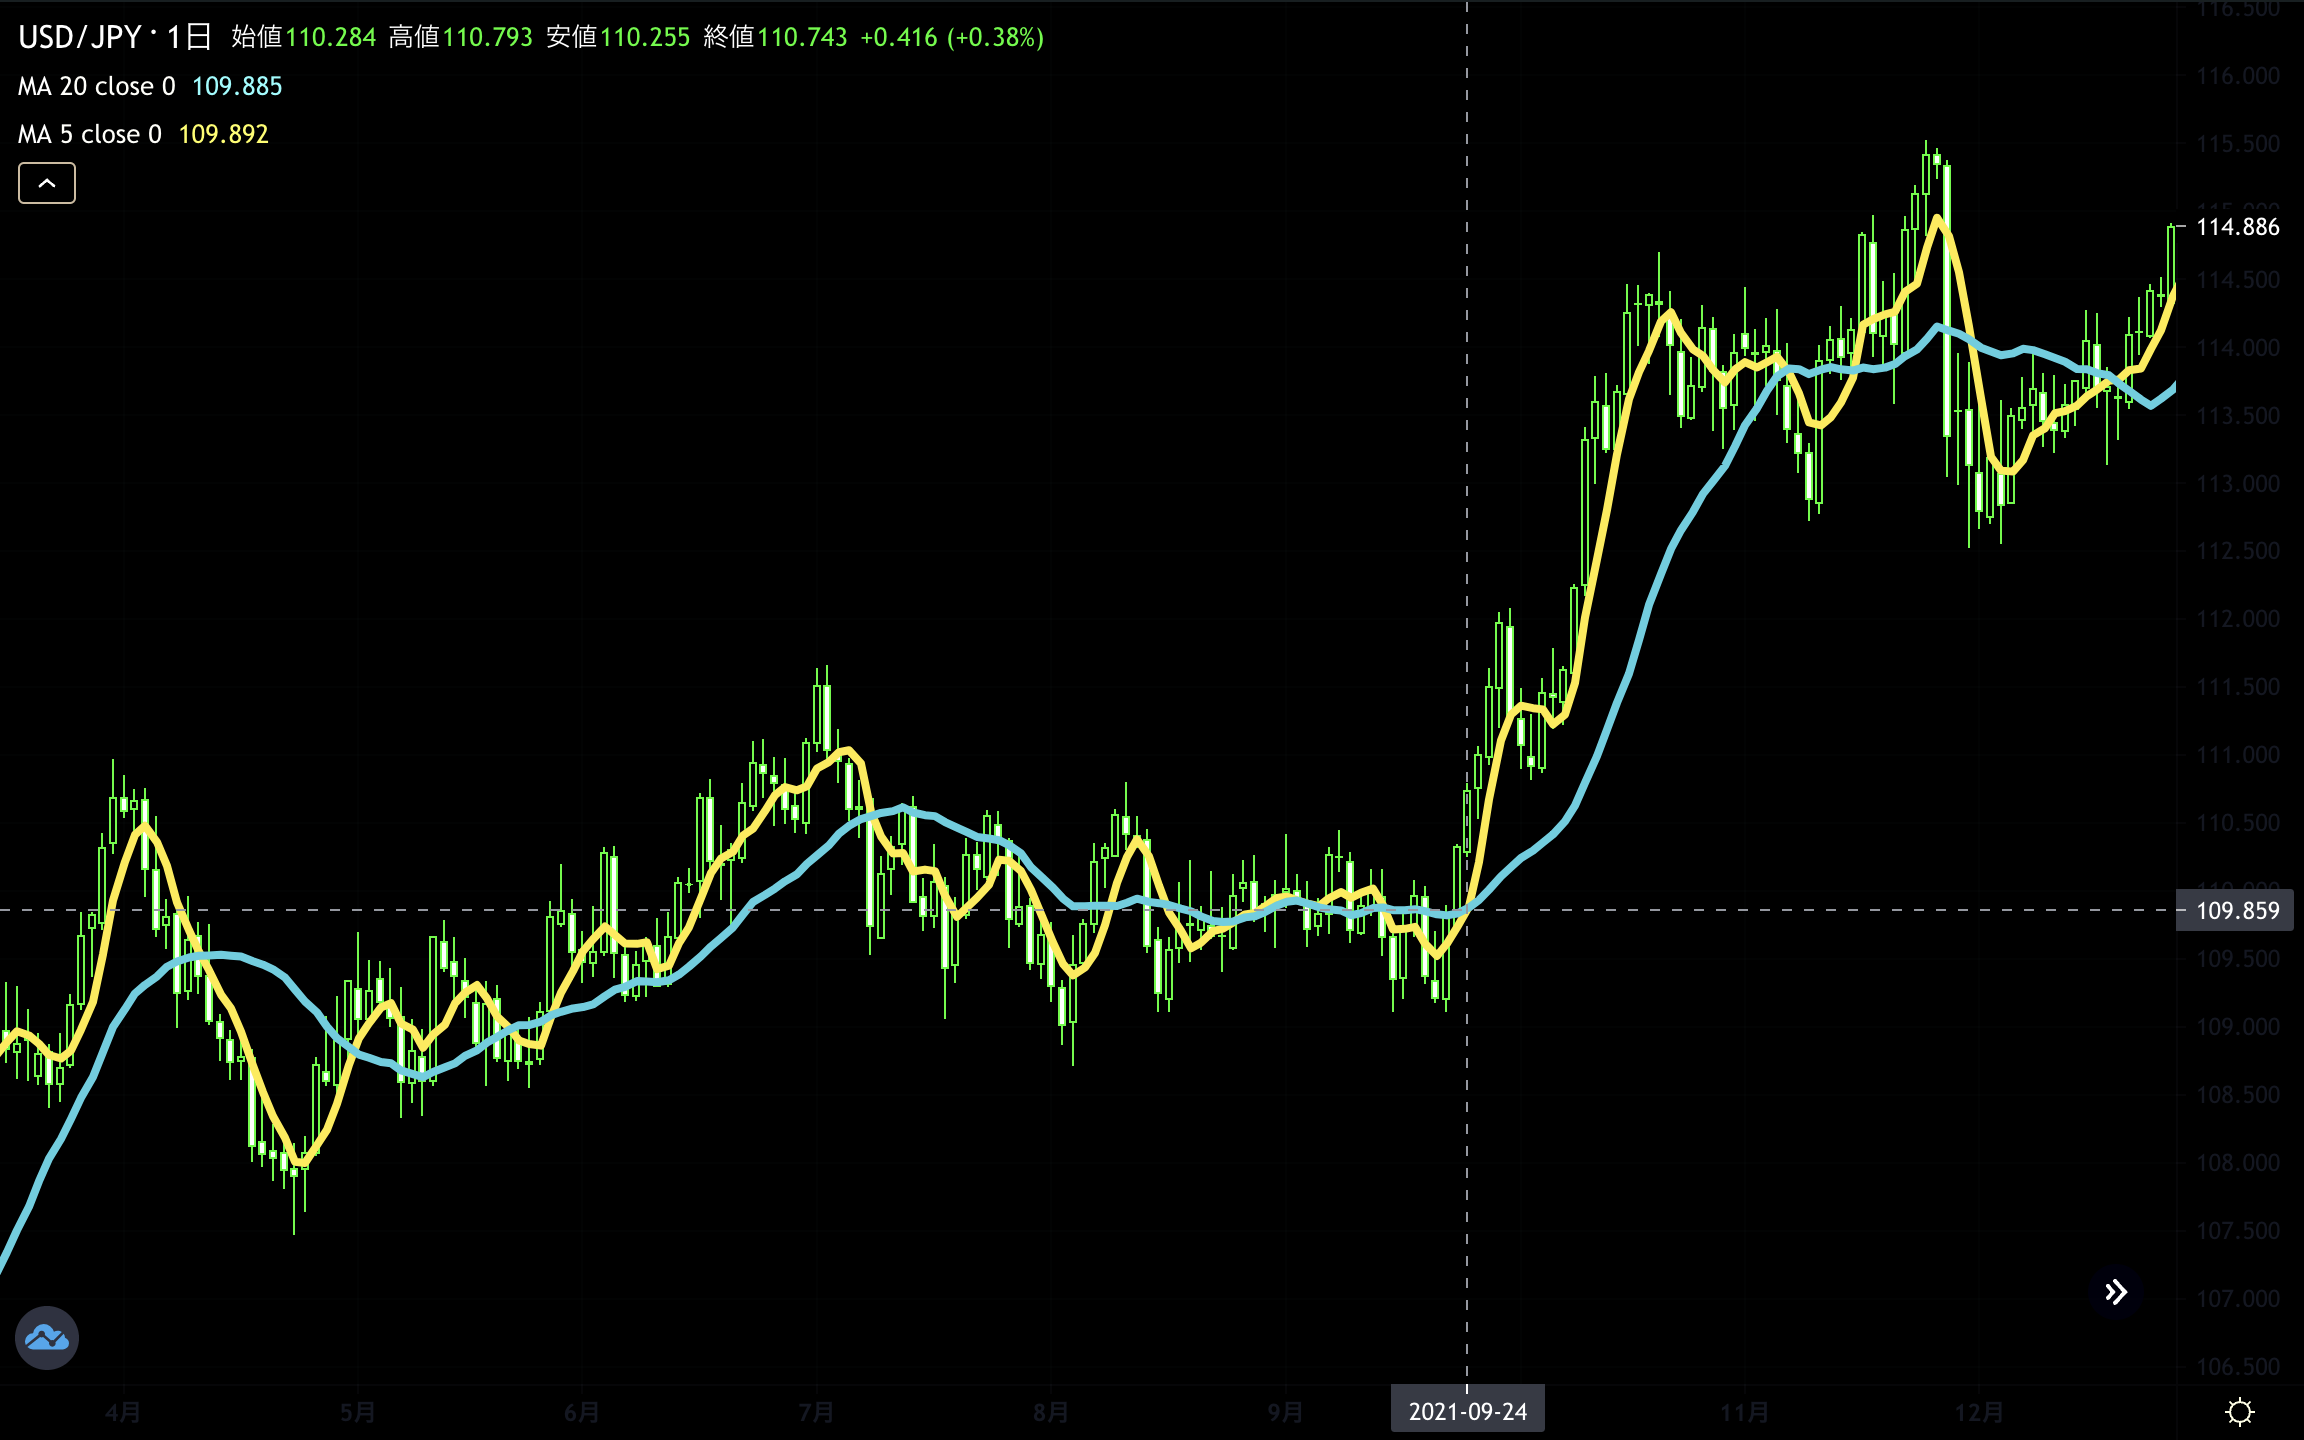
If using two moving averages can reduce traps, please consider what happens if you use three.
Next time, we will discuss that.
About using three moving averages
Signal tool for sale!