

Use of the "Visualization Indicator" (Part 135)
Usage of the "Visualization Indicator" (part135)
1. Further develop and evolve the "28 Currency Pairs List Indicator" into an indicator
"8CPVisualization Indicator"to draw AUDCAD
The "8CPVisualization Indicator" hasOceania version,London version,NewYork version,AnyCPNewYork version.
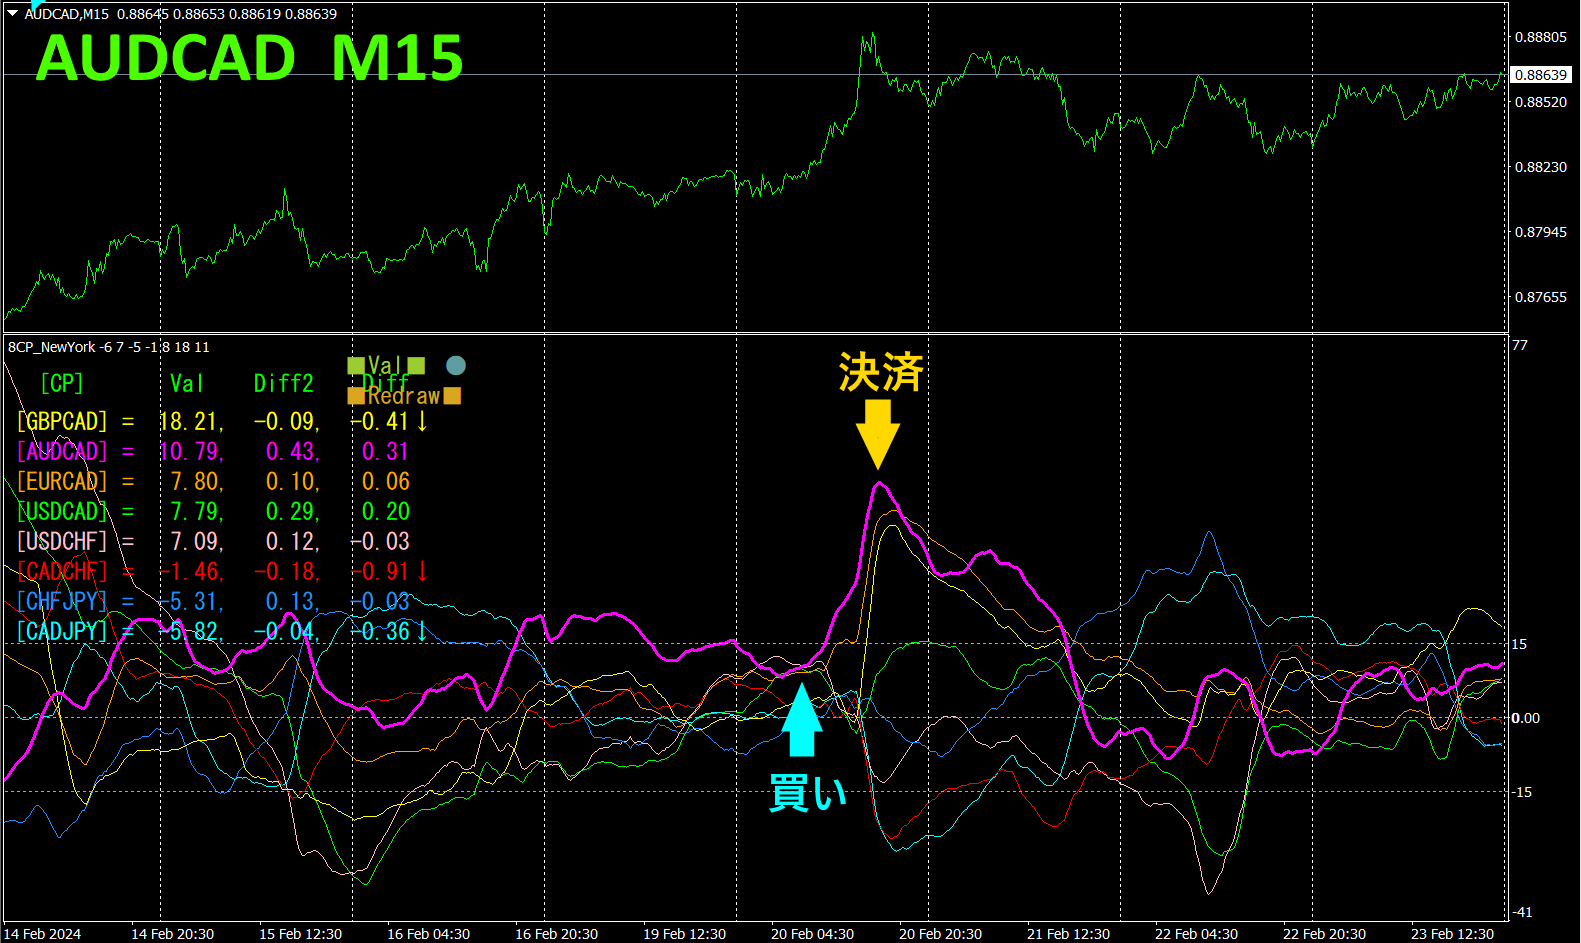
The upper half is the AUDCAD15-minute chart. The lower half shows the results from the "8CPVisualization Indicator"; the red-purple thick line representsAUDCAD.
On Tuesday, AUDCAD rose above other charts and diverged, so we entered a long position. With same-day settlement,about65pips of profitwas realized.
With the "8CPVisualization Indicator," you can focus only on the most volatile currency pair movements for efficient trading.
2. Best SelectTry the Indicator
The following figure is a screenshot taken on2024 year2 month20 day17:43JST)
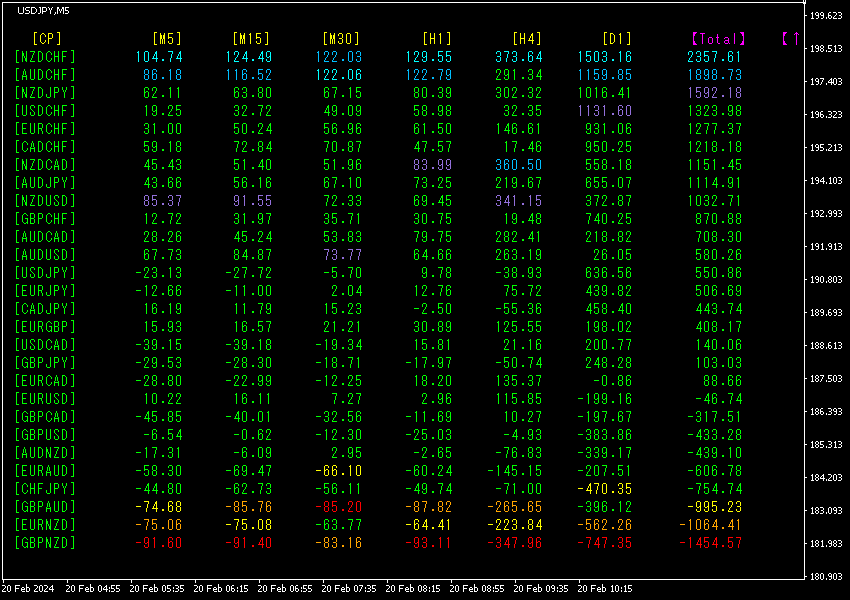
TotalThe values are sorted in descending order. At the top row,NZDCHF displays blue colors across all timeframes, andTotal value is2357.61, a large positive number. indicates an uptrend.
Now, let's look at theNZDCHF chart.
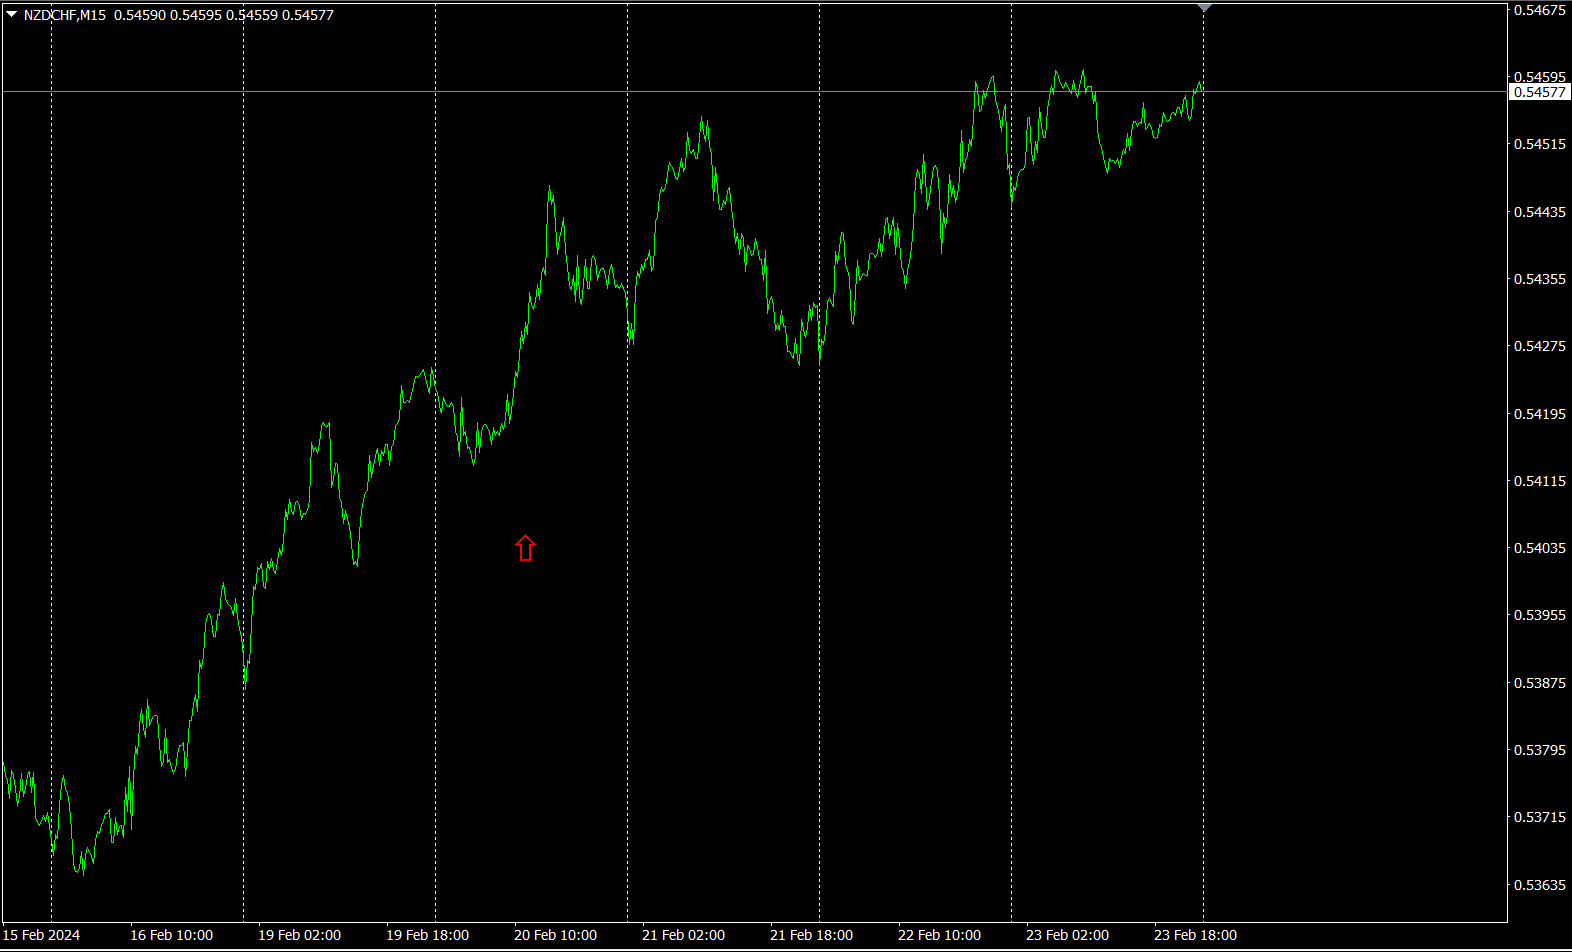
The red arrows mark where the screenshot was taken. They capture the sharp rise.
“28 currency pairs Best Select Indicator
“28 currency pairs Best Select Indicator”
https://www.gogojungle.co.jp/tools/indicators/35128

3. 2021 year5 month onwards, followingEURJPY movement, what happened?
We have been tracking the movement ofEURJPY May 2021.
To view the overall trend, we draw about the last30 minutes of the past approximately3 weeks.
Last time, I wrote the following.
JPY is slightly upward,EUR is slightly downward. The chart lacks a clear direction, butEURJPY is expected to dip slightly.
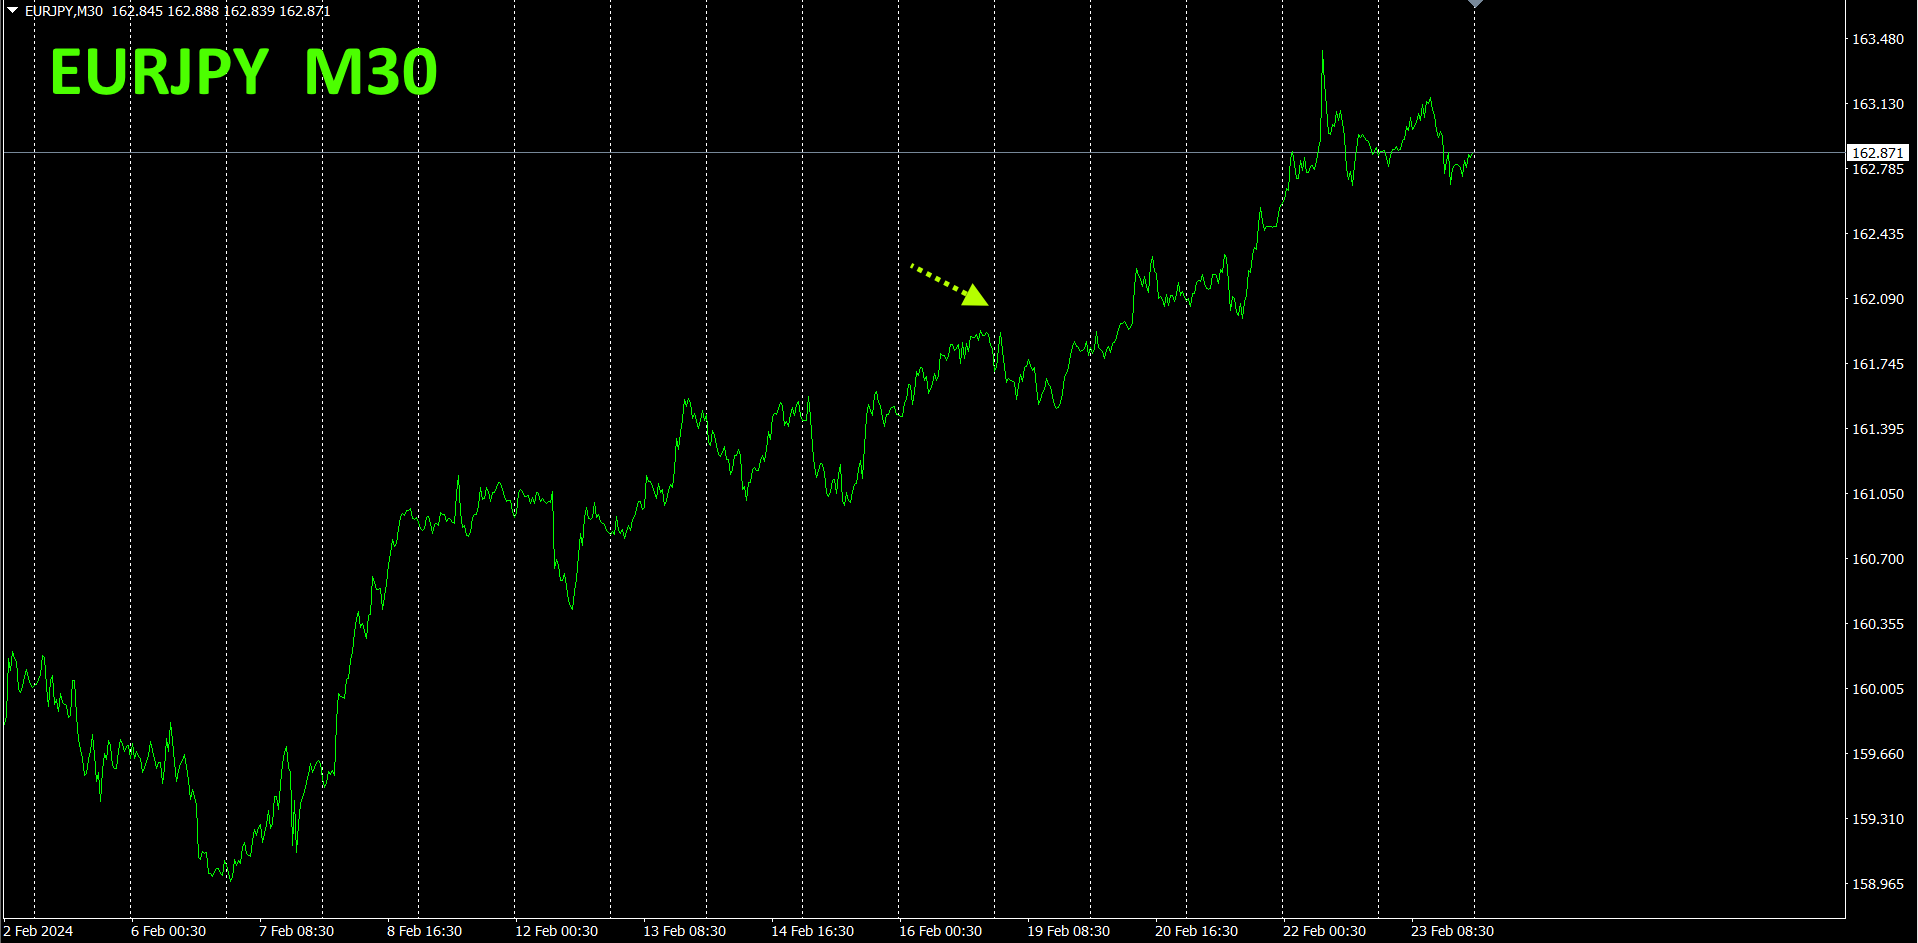
As expected, it declined a bit on Monday. Since the overall trend is upward, it then rose.
A 30-minute currency strength chart.
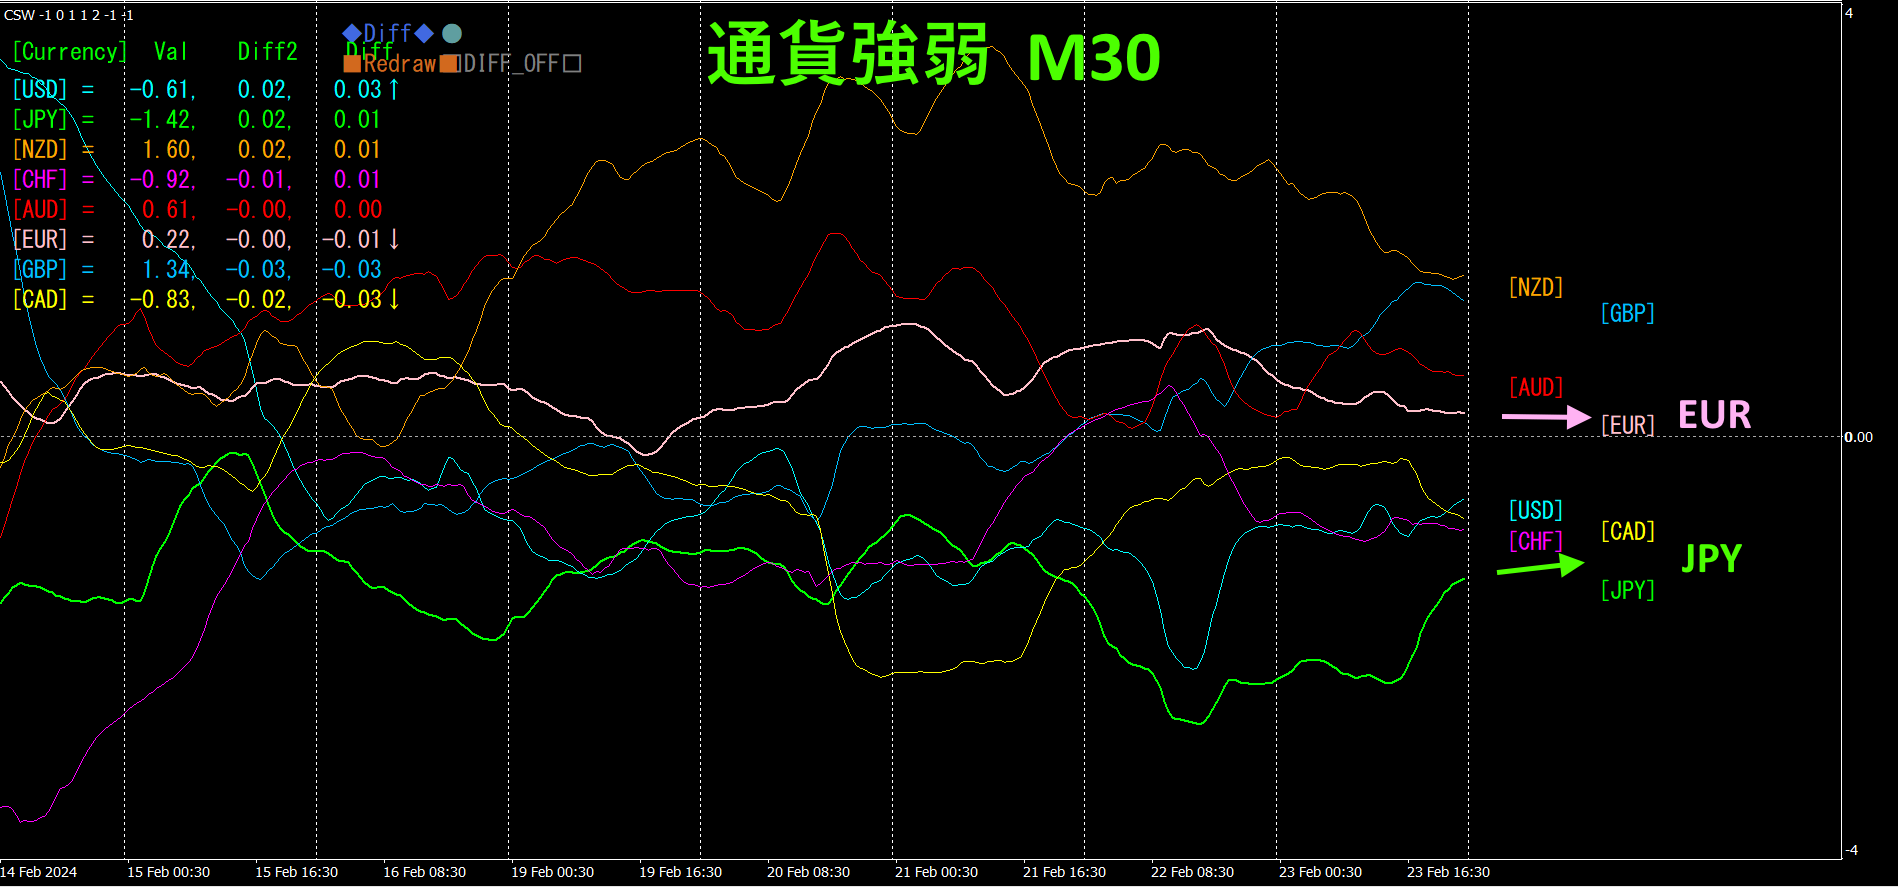
Pink indicatesEUR, green indicatesJPY andEUR are almost horizontal. With no clear direction, the direction cannot be determined.
4. Scan all currency pairs to identify extremes and form a trend strategy (target:NZDCHF)
2505“Extreme Search Indicator” is used to select the currency pair at the bottom of the market,, aiming for a rise from the bottom.
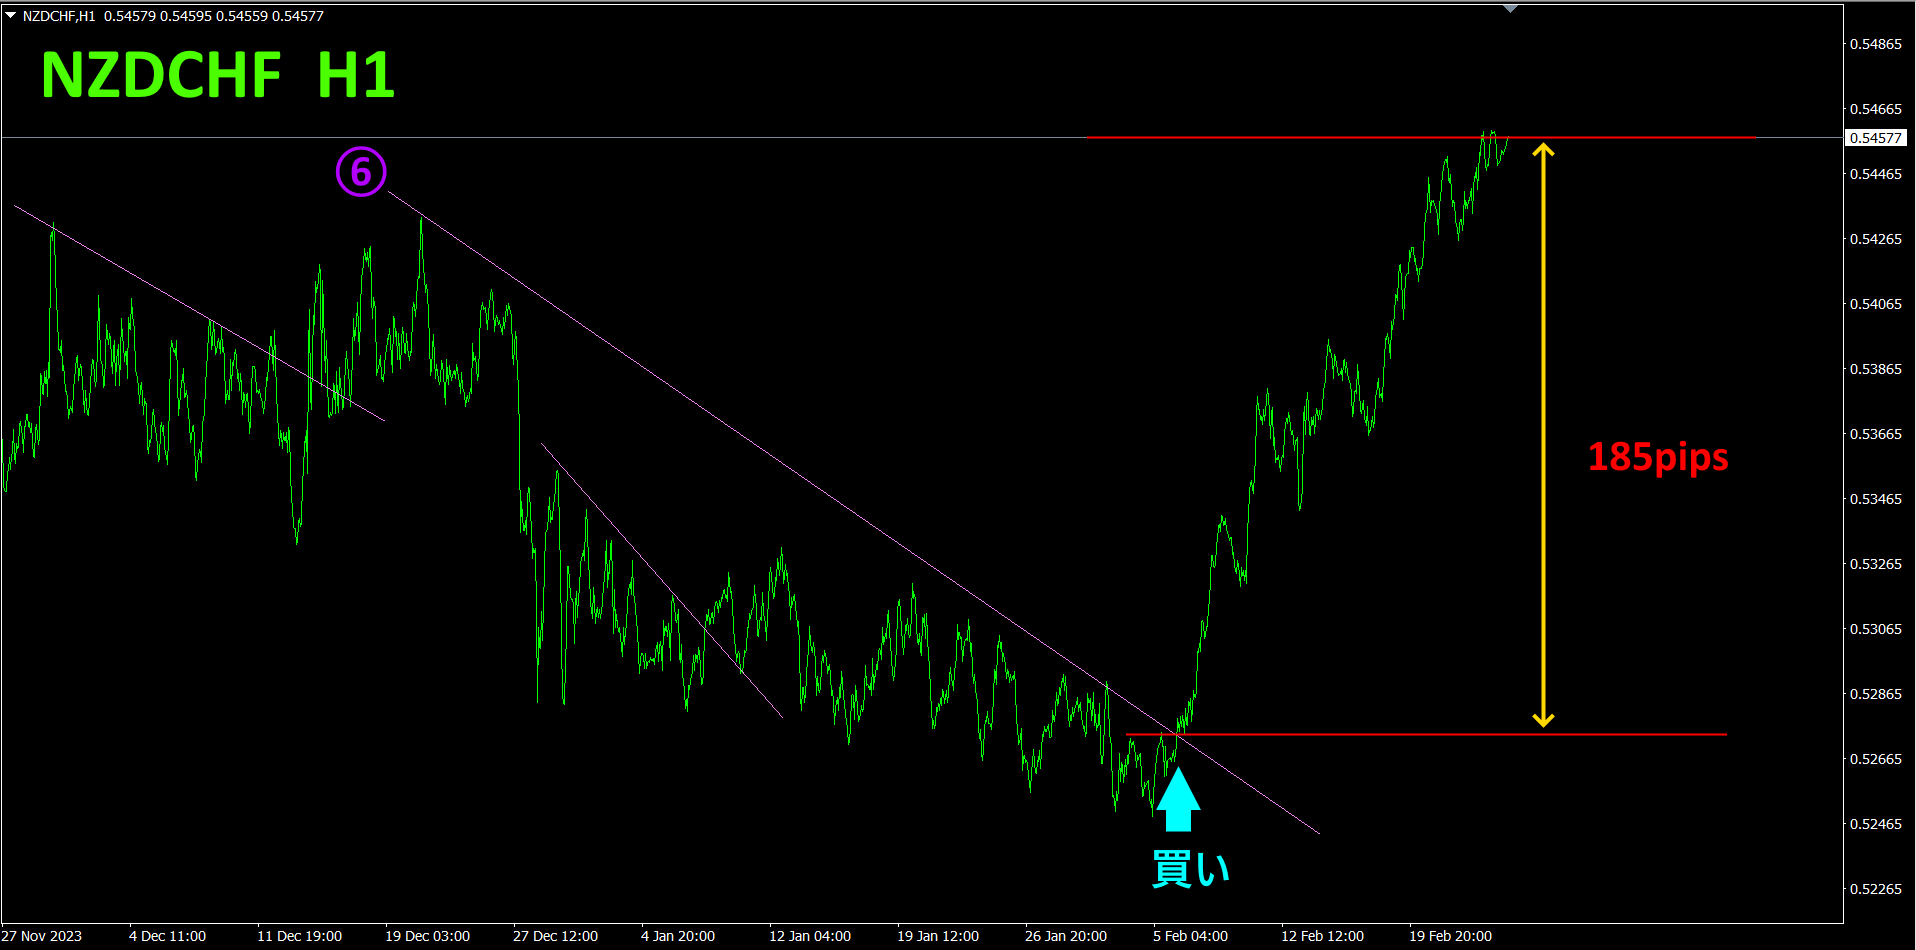
After breaking above the downward-sloping line, I opened a long position. Current unrealized profit is about185pips. (Last week was120pips.) On a longer time horizon, it is hitting a resistance line, so profit-taking would be appropriate here.
Of course, you could also hold until the rising trend line from theTrend Line EX is broken,
Following the market adage “Take profit and you gain handsomely” seems to be the correct approach here as well.
Refer to the 4-hour currency strength chart.
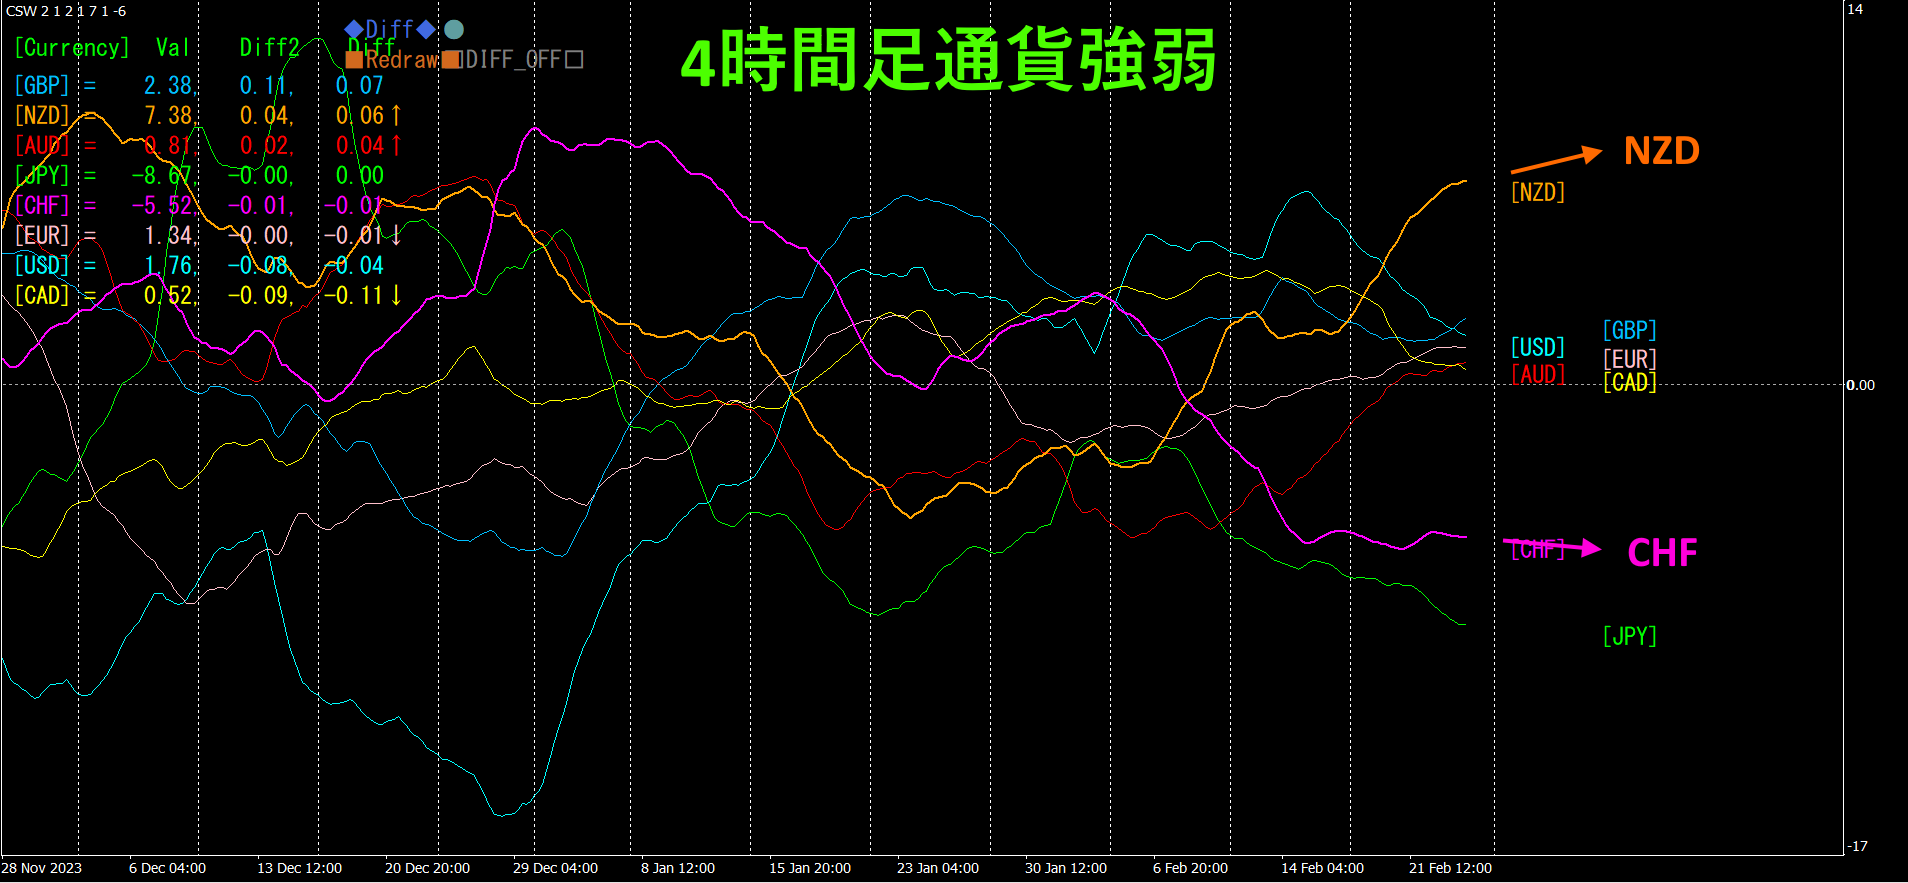
Red-purple isCHF, orange isNZD is slightly upward,CHF is slightly downward. It is expected that the gap between and will close, so “take profit early” is reasonable. Of course, some may believe it could extend a bit further, depending on the investor's judgment.
By comparing typical FX charts with currency strength charts simultaneously, the trend direction becomes clearly “visualized.”
With a semi-automaticEA, the “Trend Line EX” allows you to draw a sloped downward line, and when it breaks above, it automatically buys; when it breaks above, it automatically closes, enabling a passive trading style.
※「Trend Line EX」

https://www.gogojungle.co.jp/tools/indicators/42257
If you are interested in the "8C Currency Strength Visualization Indicator," please refer to the following pages.
MT4 version https://www.gogojungle.co.jp/tools/indicators/39150
MT5 version https://www.gogojungle.co.jp/tools/indicators/39159
【Products I have for sale】


